Hydraulic Modeling at Selected Dam-Removal and Culvert-Retrofit Sites in the Northeastern United States
←
→
Page content transcription
If your browser does not render page correctly, please read the page content below
Prepared in cooperation with the U.S. Fish and Wildlife Service

Hydraulic Modeling at Selected Dam-Removal and
Culvert-Retrofit Sites in the Northeastern United States

Scientific Investigations Report 2021–5056

U.S. Department of the Interior
U.S. Geological Survey
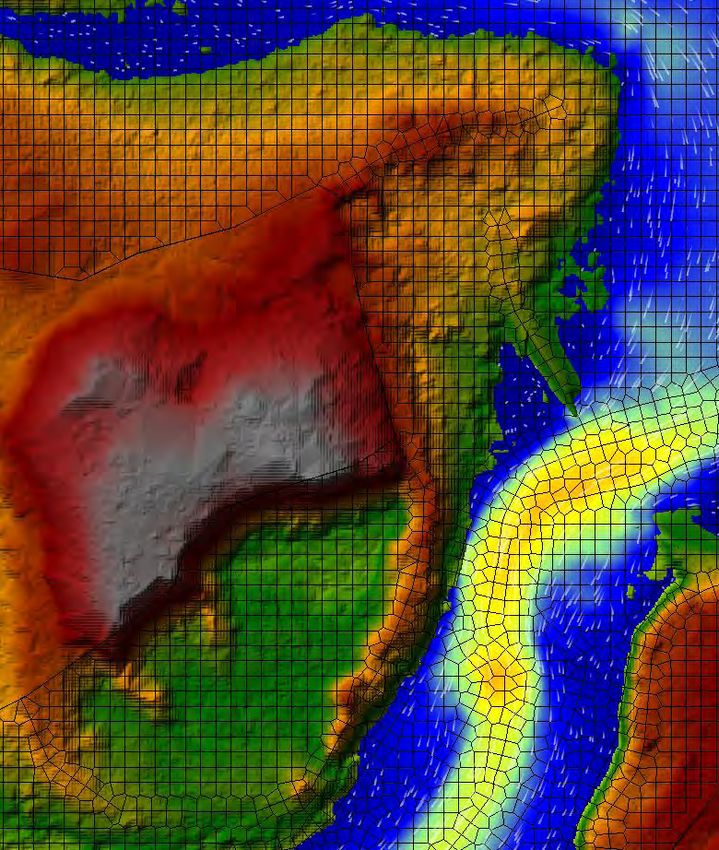
Cover. Screenshot of two-dimensional hydraulic model at Hyde Pond Dam site on Whitford Brook,
Mystic, Connecticut. The model was developed with the U.S. Army Corps of Engineers Hydrologic
Engineering Center’s River Analysis System software.
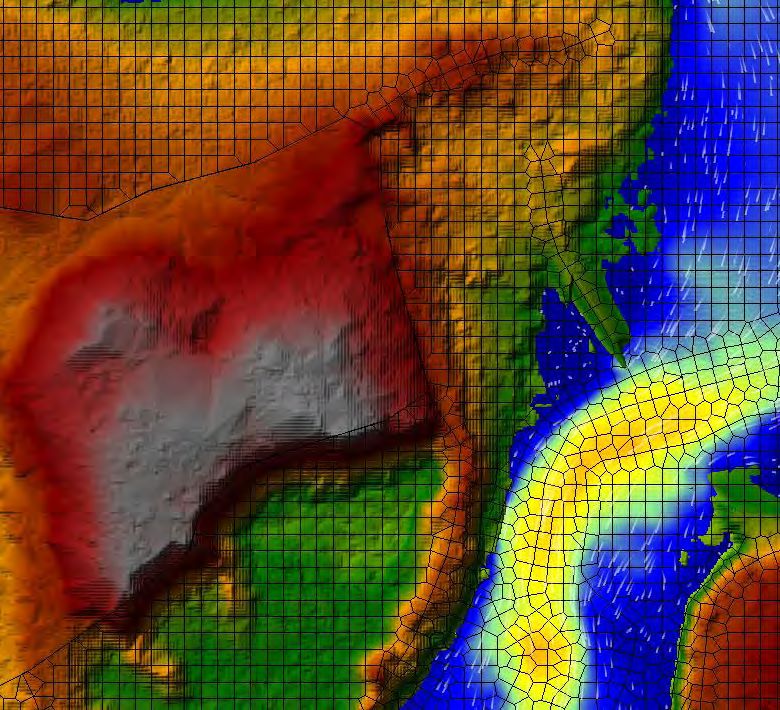
Hydraulic Modeling at Selected
Dam-Removal and Culvert-Retrofit Sites
in the Northeastern United States

By Scott A. Olson and Caelan E. Simeone

Prepared in cooperation with the U.S. Fish and Wildlife Service

Scientific Investigations Report 2021–5056

U.S. Department of the Interior
U.S. Geological Survey
U.S. Geological Survey, Reston, Virginia: 2021 For more information on the USGS—the Federal source for science about the Earth, its natural and living resources, natural hazards, and the environment—visit https://www.usgs.gov or call 1–888–ASK–USGS. For an overview of USGS information products, including maps, imagery, and publications, visit https://store.usgs.gov/. Any use of trade, firm, or product names is for descriptive purposes only and does not imply endorsement by the U.S. Government. Although this information product, for the most part, is in the public domain, it also may contain copyrighted materials as noted in the text. Permission to reproduce copyrighted items must be secured from the copyright owner. Suggested citation: Olson, S.A., and Simeone, C.E., 2021, Hydraulic modeling at selected dam-removal and culvert-retrofit sites in the northeastern United States: U.S. Geological Survey Scientific Investigations Report 2021–5056, 37 p., https://doi.org/10.3133/sir20215056. Associated data for this publication: Simeone, C.E., Olson, S.A., Taylor, N.J., Talbot, T.S., and Kinsey, J.M., 2021, Data and hydraulic models at selected dam removal and culvert retrofit sites in the northeastern United States: U.S. Geological Survey data release, https://doi.org/10.5066/P9LWIWVO. ISSN 2328-0328 (online)
iii

Contents
Abstract�����������������������������������������������������������������������������������������������������������������������������������������������������������1
Introduction����������������������������������������������������������������������������������������������������������������������������������������������������1
     Purpose and Scope������������������������������������������������������������������������������������������������������������������������������2
     Description of Study Sites�������������������������������������������������������������������������������������������������������������������2
Development of Hydraulic Models�����������������������������������������������������������������������������������������������������������13
     Data Used to Develop Models����������������������������������������������������������������������������������������������������������13
           Whittenton Dam�������������������������������������������������������������������������������������������������������������������������13
           West Britannia Dam������������������������������������������������������������������������������������������������������������������13
           Hopewell Mills Dam������������������������������������������������������������������������������������������������������������������13
           Bradford Dam�����������������������������������������������������������������������������������������������������������������������������13
           White Rock Dam������������������������������������������������������������������������������������������������������������������������14
           Hyde Pond Dam��������������������������������������������������������������������������������������������������������������������������14
           Pond Lily Dam�����������������������������������������������������������������������������������������������������������������������������15
           Hughesville Dam������������������������������������������������������������������������������������������������������������������������15
           Wreck Pond Brook Outfall��������������������������������������������������������������������������������������������������������16
     Development of Hydrology����������������������������������������������������������������������������������������������������������������16
Model Execution������������������������������������������������������������������������������������������������������������������������������������������20
     One-Dimensional Hydraulic Models������������������������������������������������������������������������������������������������20
     Two-Dimensional Hydraulic Models������������������������������������������������������������������������������������������������20
Model Results�����������������������������������������������������������������������������������������������������������������������������������������������21
     Whittendon Dam Study Site��������������������������������������������������������������������������������������������������������������34
     West Britannia Dam Study Site��������������������������������������������������������������������������������������������������������34
     Hopewell Mills Dam Study Site��������������������������������������������������������������������������������������������������������34
     Bradford Dam Study Site�������������������������������������������������������������������������������������������������������������������34
     White Rock Dam Study Site��������������������������������������������������������������������������������������������������������������35
     Hyde Pond Dam Study Site���������������������������������������������������������������������������������������������������������������35
     Pond Lily Dam Study Site�������������������������������������������������������������������������������������������������������������������35
     Hughesville Dam Study Site��������������������������������������������������������������������������������������������������������������35
     Wreck Pond Brook Outfall Study Site���������������������������������������������������������������������������������������������36
Summary�������������������������������������������������������������������������������������������������������������������������������������������������������36
References Cited�����������������������������������������������������������������������������������������������������������������������������������������36

Figures
         1. Map showing locations of the nine study sites in Massachusetts, Rhode Island,
            Connecticut, and New Jersey����������������������������������������������������������������������������������������������������3
         2. Map showing inundation areas of the 1-percent annual exceedance probability
            discharge at the Whittenton Dam study site, Taunton, Massachusetts�����������������������������4
         3. Map showing inundation areas of the 1-percent annual exceedance probability
            discharge at the West Britannia Dam study site, Taunton, Massachusetts�����������������������5
         4. Map showing inundation areas of the 1-percent annual exceedance probability
            discharge at the Hopewell Mills Dam study site, Taunton, Massachusetts�����������������������6
iv
5. Map showing inundation areas of the 1-percent annual exceedance probability
discharge at the Bradford Dam study site, Westerly, Rhode Island������������������������������������7
6. Map showing inundation areas of the 1-percent annual exceedance probability
discharge at the White Rock Dam study site, Westerly, Rhode Island�������������������������������8
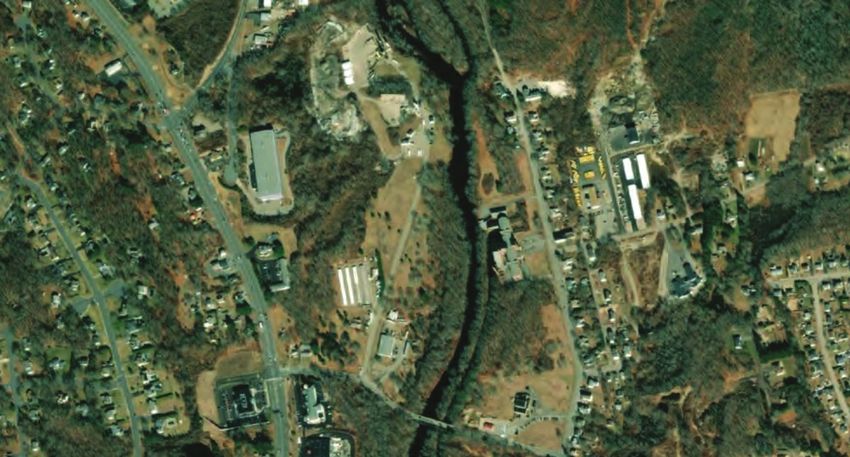
7. Map showing inundation areas of the 1-percent annual exceedance probability
discharge at the Hyde Pond Dam study site, Mystic, Connecticut��������������������������������������9
8. Map showing inundation areas of the 1-percent annual exceedance probability
discharge at the Pond Lily Dam study site, New Haven, Connecticut�������������������������������10
9. Map showing inundation areas of the 1-percent annual exceedance probability
discharge at the Hughesville Dam study site, Warren Glen, New Jersey������������������������11
10. Map showing inundation areas of the 1-percent annual exceedance probability
discharge at the Wreck Pond Brook Outfall study site, Spring Lake, New Jersey���������12
11. Profile plots of the 1-percent annual exceedance probability discharge and
April mean monthly discharge water-surface elevation at the Hyde Pond study
reach in Mystic, Connecticut����������������������������������������������������������������������������������������������������28
Tables
1. Flood discharges of the 50-, 20-, 10-, 4-, 2-, 1-, 0.5-, and 0.2-percent annual
exceedance probabilities at streamgages and dam-removal and culvert-retrofit
study sites in Massachusetts, Rhode Island, Connecticut, and New Jersey������������������17
2. Monthly discharge statistics computed at streamgages and dam-removal study
sites in Massachusetts, Rhode Island, Connecticut, and New Jersey�����������������������������18
3. Median discharge statistics for selected months computed at Pond Lily Dam
site on West River in New Haven, Connecticut���������������������������������������������������������������������19
4. Water-surface elevations at the dam approach cross section at the Whittenton
Dam study site in Taunton, Massachusetts���������������������������������������������������������������������������21
5. Water-surface elevations at the approach to the dam and canal at the West
Britannia Dam study site in Taunton, Massachusetts����������������������������������������������������������22
6. Water-surface elevations at the dam approach cross section at the Hopewell
Dam study site in Taunton, Massachusetts���������������������������������������������������������������������������23
7. Water-surface elevations at the dam approach cross section at the Bradford
Dam study site in Westerly, Rhode Island������������������������������������������������������������������������������24
8. Water-surface elevations at the approach to the dam and canal at the White
Rock Dam study site in Westerly, Rhode Island��������������������������������������������������������������������25
9. Water-surface elevations at the dam approach cross section at the Hyde Pond
Dam study site in Mystic, Connecticut������������������������������������������������������������������������������������26
10. Water-surface elevations at the dam approach cross section at the Pond Lily
Dam study site in New Haven, Connecticut���������������������������������������������������������������������������26
11. Water-surface elevations at the dam approach cross section at the Hughesville
Dam study site in Warren Glen, New Jersey�������������������������������������������������������������������������27
12. Water-surface elevations at the approach cross section to the outfall at the
Wreck Pond Brook Outfall study site in Spring Lake, New Jersey������������������������������������27
13. Water velocities from the two-dimensional models at the dam approach and
where the dam was once located at the Whittenton Dam study site in Taunton,
Massachusetts����������������������������������������������������������������������������������������������������������������������������29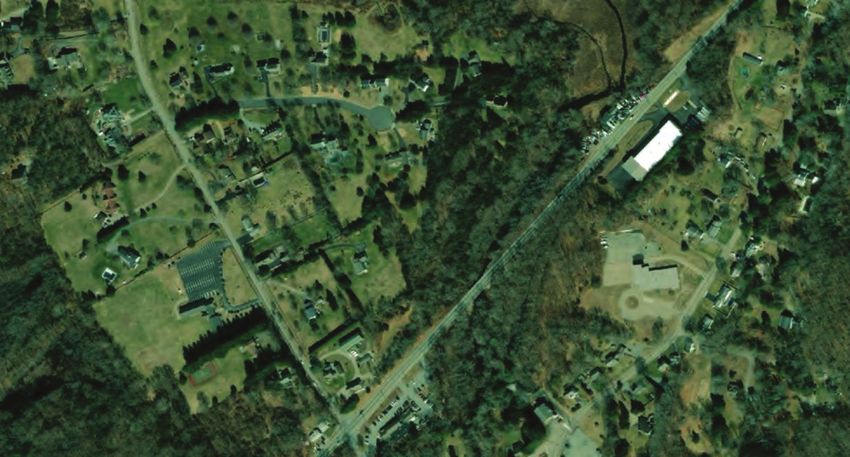
v

     14.     Water velocities from the two-dimensional models at the approach to the dam
             and canal and where the dam was once located at the West Britannia Dam
             study site in Taunton, Massachusetts�������������������������������������������������������������������������������������30
     15.     Water velocities from the two-dimensional models at the dam approach and
             where the dam was once located at the Hopewell Dam study site in Taunton,
             Massachusetts����������������������������������������������������������������������������������������������������������������������������30
     16.     Water velocities from the two-dimensional models at the dam approach and
             where the dam was once located at the Bradford Dam study site in Westerly,
             Rhode Island��������������������������������������������������������������������������������������������������������������������������������30
     17.     Water velocities from the two-dimensional models at the approach to the dam
             and canal and where the dam was once located at the White Rock Dam study
             site in Westerly, Rhode Island��������������������������������������������������������������������������������������������������31
     18.     Water velocities from the two-dimensional models at the dam approach and
             where the dam was once located at the Hyde Pond Dam study site in Mystic,
             Connecticut����������������������������������������������������������������������������������������������������������������������������������31
     19.     Water velocities from the two-dimensional models at the dam approach and
             where the dam was once located at the Pond Lily Dam study site in New
             Haven, Connecticut��������������������������������������������������������������������������������������������������������������������31
     20.     Water velocities from the two-dimensional models at the dam approach and
             where the dam was once located at the Hughesville Dam study site in Warren
             Glen, New Jersey�����������������������������������������������������������������������������������������������������������������������32
     21.     Water velocities from the two-dimensional models at the outfall approach and
             culverts at the Wreck Pond Brook Outfall study site in Spring Lake, New Jersey���������32
     22.     Fish passage criteria applied to study sites and results, for study reaches in
             Massachusetts, Rhode Island, Connecticut, and New Jersey�������������������������������������������33

Conversion Factors
U.S. customary units to International System of Units

                     Multiply                                             By                                          To obtain
                                                                       Length
 foot (ft)                                                             0.3048                   meter (m)
 mile (mi)                                                             1.609                    kilometer (km)
                                                                         Area
 acre                                                                  0.4047                   hectare (ha)
 square mile     (mi2)                                                 2.590                    square kilometer (km2)
                                                                      Flow rate
 foot per second (ft/s)                                                0.3048                   meter per second (m/s)
 cubic foot per second (ft3/s)                                         0.02832                  cubic meter per second (m3/s)
vi

     Datum
     Vertical coordinate information is referenced to the North American Vertical Datum of 1988
     (NAVD 88).
     Horizontal coordinate information is referenced to the North American Datum of 1983 (NAD 83).
     Elevation, as used in this report, refers to distance above the vertical datum.

     Abbreviations
     AEP			            annual exceedance probability
     CONED		           Coastal National Elevation Database
     DEM			            digital elevation model
     FWS			            U.S. Fish and Wildlife Service
     HEC–RAS           Hydrologic Engineering Center’s River Analysis System
     lidar			          light detection and ranging
     MOVE.1		          maintenance of variance extension, type 1
     USGS			           U.S. Geological Survey
Hydraulic Modeling at Selected Dam-Removal and
Culvert-Retrofit Sites in the Northeastern United States

By Scott A. Olson and Caelan E. Simeone

                                                                    for selected fish species were maintained throughout three of
Abstract                                                            the nine study sites, and burst swim velocity criteria were met
                                                                    at all study sites.
      Aquatic connectivity projects, such as removing dams
and modifying culverts, have substantial benefits. The restora-
tion of natural flow conditions improves water quality, sedi-
ment transport, aquatic and riparian habitat, and fish passage.     Introduction
These projects can also decrease hazards faced by communi-
ties by lowering water-surface elevations of flood waters and             In the wake of Hurricane Sandy (October–November
by removing the risk of dam breaches associated with aging or       2012), the U.S. Department of the Interior provided $787 mil-
inadequate infrastructure.                                          lion to fund 160 projects through the Hurricane Sandy Coastal
      This report documents and provides results of one- and        Resiliency Competitive Grant Program that were designed
two-dimensional hydraulic models developed for selected riv-        to reduce ecosystem and community vulnerability to threats
ers and streams in the northeastern United States where a dam       such as coastal storms, flooding, and erosion. Many of these
was removed or a culvert was retrofitted. The models were           projects focused on improving or restoring aquatic connectiv-
developed for conditions before and after the dam removal           ity (U.S. Fish and Wildlife Service, 2019a).
or culvert modification. The discharges applied in the mod-               Aquatic connectivity projects, such as removing dams or
els included monthly discharges and flood discharges for the        improving culvert crossings, have several benefits. Restoration
annual exceedance probabilities of 50, 20, 10, 4, 2, 1, 0.5, and    of natural flow conditions in streams improves water quality,
0.2 percent.                                                        sediment transport, aquatic and riparian habitat, and aquatic
      This study, by the U.S. Geological Survey in coopera-         organism passage. Restoration of a more natural system also
tion with the U.S. Fish and Wildlife Service, demonstrates the      improves resilience for surrounding communities by decreas-
benefits resulting from dam removal and retrofitting under-         ing risks from flood events and removing the risk associated
sized culverts in terms of decreased water-surface elevations       with aging or inadequate infrastructure.
during flooding and improved fish passage. The U.S. Army                  Dams are being removed at an unprecedented rate. Of the
Corps of Engineers Hydrologic Engineering Center’s River            approximately 90,000 dams across the United States, about
Analysis System was used to model the sites in one- and two-        1,800 dams have been removed (American Rivers, 2021). This
dimensional hydraulics, and decreases in the 1-percent annual       investigation by the U.S. Geological Survey, in cooperation
exceedance probability discharge water-surface elevation were       with the U.S. Fish and Wildlife Service, aims to demonstrate
found at all sites studied. The decreases in water-surface eleva-   the benefits of several dam-removal projects in the northeast-
tion at sites in which the impoundment was removed ranged           ern United States.
from 1.3 to 10.4 feet. One site, Bradford Dam in Westerly,                For this investigation, hydraulic models were developed
Rhode Island, had only a 0.2-foot decrease, but at that site the    to evaluate velocity and depth suitability for fish passage and
dam was replaced by a series of weirs to retain the upstream        to evaluate flood inundation. Both one- and two-dimensional
impoundment and allow fish passage.                                 models were developed for scenarios before and after the dam
      Minimal differences were found between the water-             removal or culvert retrofit. Discharges applied in the models
surface elevations computed by the one- and two-dimensional         include mean or median monthly discharges and flood dis-
models. The two-dimensional models, however, provide                charges for the annual exceedance probabilities (AEPs) of 50,
the additional benefit of detailed velocity and depth data          20, 10, 4, 2, 1, 0.5, and 0.2 percent.
throughout the channel at a resolution not possible with a one-           The hydraulic models were developed for nine aquatic
dimensional model. These velocity and depth data allowed for        connectivity restoration sites: (1) Whittenton Dam, Mill
assessment of the suitability for fish passage at the sites. Fish   River, Taunton, Massachusetts; (2) West Britannia Dam,
passage was improved at all the sites by removing the dams          Mill River, Taunton, Mass.; (3) Hopewell Mills Dam, Mill
and retrofitting the culvert. Prolonged swim velocity criteria      River, Taunton, Mass.; (4) Bradford Dam, Pawcatuck River,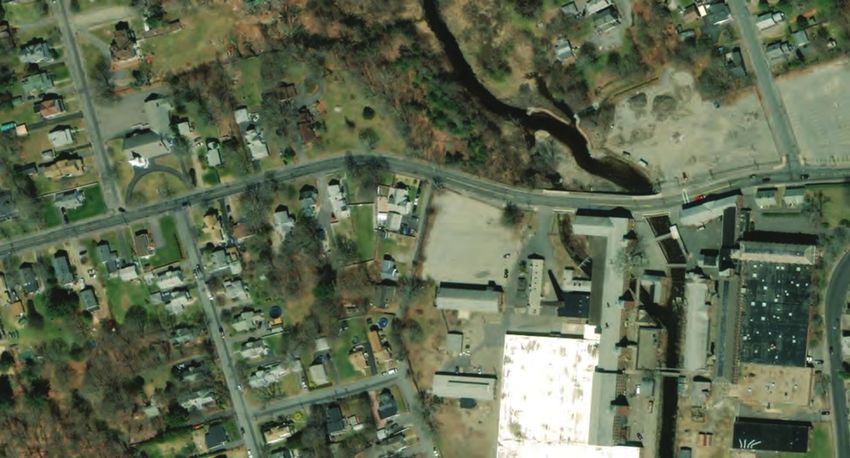
2   Hydraulic Modeling at Selected Dam-Removal and Culvert-Retrofit Sites in the Northeastern United States

Westerly, Rhode Island; (5) White Rock Dam, Pawcatuck              channel. The drainage area at the site is 218 square miles.
River, Westerly, R.I.; (6) Hyde Pond Dam, Whitford Brook,          Although the dam site does not impound a reservoir, the river
Mystic, Connecticut; (7) Pond Lily Dam, West River, New            is relatively flat upstream from the dam and has numerous
Haven, Conn.; (8) Hughesville Dam, Musconetcong River,             swamps that are affected by backwater from the dam, making
Warren Glen, New Jersey; and (9) Wreck Pond Brook Outfall,         the impoundment roughly 600 acres. In 2017, the dam was
Wreck Pond Brook, Spring Lake, N.J. (fig. 1).                      removed and replaced by a series of eight stone weirs designed
                                                                   for fish passage that cross the river with a low-flow notch in
                                                                   the center of the channel. The replacement of the dam with the
Purpose and Scope                                                  weirs did not substantially change the impoundment because
                                                                   the upstream-most weir was at approximately the same eleva-
     The report documents the development and results of
                                                                   tion as the preexisting dam crest.
one- and two-dimensional hydraulic models generated to
                                                                         The second dam site studied on the Pawcatuck River was
evaluate the effects of eight dam removals and one culvert
                                                                   the White Rock Dam in Westerly, R.I. The White Rock Dam
retrofit. The report describes the terrain data, geometric data,
                                                                   site has a drainage area of 292 square miles. The crest of the
and hydrologic data input to the models. Model results are
                                                                   dam was 120 feet long and 8 feet high near the center of the
presented for scenarios before and after the dam removal or
                                                                   channel. It was used to divert water down a canal to a factory.
culvert retrofit. Comparisons of the water-surface elevations
                                                                   Although the dam did not impound a reservoir, approximately
and velocities are shown for each scenario over a wide range
                                                                   33 acres of backwater was caused by the dam during normal
of discharges. An associated U.S. Geological Survey data
                                                                   flow conditions. The dam was removed in 2015, and the canal
release by Simeone and others (2021) has pre-dam-removal
                                                                   that conveyed water diverted to the factory was filled in.
geometry data supplied by the U.S. Fish and Wildlife Service
                                                                         Two small stream dam sites were studied in Connecticut.
(FWS), survey data, photographs, hydrologic data, and the
                                                                   The first, Hyde Pond Dam, is the site of a 2016 dam removal
hydraulic models developed for the study sites.
                                                                   in Mystic, Conn. This dam site is on Whitford Brook and
                                                                   has a drainage area of 15.0 square miles. The dam crest was
Description of Study Sites                                         approximately 50 feet long and 6 feet high at the center of the
                                                                   channel. The impoundment above the dam was about 12 acres.
      There are nine study sites from Massachusetts to             The second is Pond Lily Dam on the West River in New
New Jersey (figs. 1–10). The first three study sites are dam       Haven, Conn. It was also removed in 2016. The drainage area
sites on the Mill River in Taunton, Mass. The Mill River flows     of the West River at the Pond Lily Dam is 17.1 square miles.
south through a developed part of Taunton. The dams were           The dam crest was about 200 feet long and 6 feet high at the
originally constructed to provide water and power to industries    center of the channel. The impoundment upstream from the
along the Mill River. The first dam on the Mill River is the       dam was about 8 acres. Both dams were removed to eliminate
Whittenton Dam. It is the upstream-most of the three study         the threat of a dam breach and to open habitat for migratory
sites on the Mill River and has a drainage area of 41.1 square     species of fish.
miles. The dam crest was approximately 120 feet long and                 There were two study sites in New Jersey. One was a
about 5 feet high near the center of the channel. It had a         dam-removal site, and one was a culvert-retrofit site. The
46-acre impoundment. It was removed in 2013.                       dam-removal study site was the Hughesville Dam site on the
      The second dam on the Mill River, the West Britannia         Musconetcong River in Warren Glen, N.J. The Musconetcong
Dam, is 3,250 feet downstream from the Whittenton Dam. The         River has a drainage area of 148 square miles at the study
drainage area at the dam site is 42.0 square miles. The dam        site. The dam crest was 147 feet long and 14 feet high at the
crest was 90 feet wide and about 5 feet high near the center       center of the channel. The dam was removed in 2016. The
of the channel. The impoundment was about 8 acres. The             dam was considered a run-of-the-river dam site and to have no
dam was used to divert water through a factory along the Mill      impoundment.
River. The West Britannia Dam was removed in 2018. The                   The culvert-retrofit site was at the Wreck Pond Brook
third dam on the Mill River, the Hopewell Mills Dam—also           Outfall in Spring Lake, N.J. The site has a drainage area of
known as the State Hospital Dam—is about 2,200 feet down-          12.7 square miles. The outfall structure at the outlet of Wreck
stream from the West Britannia Dam. The drainage area at this      Pond Brook is meant to regulate the tidal flows at the mouth
dam is 42.3 square miles. The dam crest was about 35 feet in       of the brook to prevent inland flooding from tidal surge. The
length and roughly 5 feet high near the center of the chan-        original outfall structure is a 795-foot-long, 7-foot-diameter
nel, and the dam impounded about 11 acres of water. It was         circular conduit with a gate structure at its upstream end. The
removed in 2012. The removal of the three dams on the Mill         conduit passes under the beach and empties into the ocean.
River opened miles of aquatic habitat to migratory species and     The site was retrofit in 2016 with an additional 600-foot-
improved flood resiliency and safety in Taunton, Mass.             long, 8-foot-by-5-foot rectangular conduit with a sluice gate
      The next two dam sites studied were on the Pawcatuck         at its upstream end. The additional conduit increased aquatic
River in Rhode Island. The first was the Bradford Dam in           connectivity and increased discharge capacity from Wreck
Westerly, R.I. The Bradford Dam’s crest was approximately          Pond Brook.
100 feet in length and about 7 feet high at the center of the
75° 74° 73° 72° 71°
Whittenton
West Dam
42° Britannia
Dam
Hopewell
Hopewell Dam
Mills Dam
White Rock
Dam
Hyde Pond Dam
Pond Lily Dam
Bradford Dam
41°
Hughesville
Dam
EXPLANATION
Study site
Wreck Pond 0 40 80 MILES
Brook Outfall
0 40 80 KILOMETERS
40°
Base from U.S. Geological Survey
Introduction 3
The National Map digital data, 2020
Figure 1. Locations of the nine study sites in Massachusetts, Rhode Island, Connecticut, and New Jersey.4 Hydraulic Modeling at Selected Dam-Removal and Culvert-Retrofit Sites in the Northeastern United States
Introduction 4
71°06'30" 71°06'20"
41°55'40"
iv e r
M ill R
41°55'30"
EXPLANATION
Post-dam-removal inundation area
Pre-dam-removal inundation area
WHITT
ENTON
STREET
Limit of study
Whittenton Dam
Approach
Direction of flow
Base from U.S. Department of Agriculture 0 200 400 800 FEET
Farm Service Agency, GeoEye, and Maxar
digital data, 2020. Base image copyright
2020 Esri and its licensors 0 50 100 200 METERS
Figure 2. Inundation areas of the 1-percent annual exceedance probability discharge at the Whittenton Dam study site, Taunton,
Massachusetts.Introduction 5
71°06'20" 71°06'10" 71°06'
41°55'20"
COT
TAG
E
STR
EET
Mi
ll R
ive
r
41°55'10"
WES
T BR
ITAN
NIA S
TREE
T
Diversion
EXPLANATION channel
Post-dam-removal inundation area
Pre-dam-removal inundation area
Limit of study
West Britannia Dam
Approach
Direction of flow
Base from U.S. Department of Agriculture 0 150 300 600 FEET
Farm Service Agency, GeoEye, and Maxar
digital data, 2020. Base image copyright
0 37.5 75 150 METERS
2020 Esri and its licensors
Figure 3. Inundation areas of the 1-percent annual exceedance probability discharge at the West Britannia Dam study site,
Taunton, Massachusetts.6 Hydraulic Modeling at Selected Dam-Removal and Culvert-Retrofit Sites in the Northeastern United States
71°06'05" 71°06' 71°05'55" 71°5'50"
41°55'05"
T
STREE
ORTH
DANF
41°55'
Mil
l Ri
ver
41°54'55"
EXPLANATION
Post-dam-removal inundation area
Pre-dam-removal inundation area
Limit of study
Hopewell Mills Dam
Approach
Direction of flow
41°54'50"
Base from U.S. Department of Agriculture 0 125 250 500 FEET
Farm Service Agency, GeoEye, and Maxar
digital data, 2020. Base image copyright
2020 Esri and its licensors 0 30 60 120 METERS
Figure 4. Inundation areas of the 1-percent annual exceedance probability discharge at the Hopewell Mills Dam study site,
Taunton, Massachusetts.Introduction 7
71°45'30" 71°45'15" 71°45' 71°44'45"
E 91
STATE ROUT
41°24'30"
Pawcatuck River
41°24'15"
EXPLANATION
Post-dam-removal inundation area
Pre-dam-removal inundation area
Limit of study
Bradford Dam
Approach
Direction of flow
41°24'
Base from U.S. Department of Agriculture 0 300 600 1,200 FEET
Farm Service Agency, GeoEye, and Maxar
digital data, 2020. Base image copyright
2020 Esri and its licensors 0 75 150 300 METERS
Figure 5. Inundation areas of the 1-percent annual exceedance probability discharge at the Bradford Dam study site, Westerly,
Rhode Island.8 Hydraulic Modeling at Selected Dam-Removal and Culvert-Retrofit Sites in the Northeastern United States
71°51' 71°50'45" 71°50'30" 71°50'15" 71°50'
41°24'30"
Canal
41°24'15"
41°24' EXPLANATION
Post-dam-removal inundation area
iver
Pre-dam-removal inundation area
ck R
Limit of study
catu
WHITE ROCK
BRI White Rock Dam
Paw
D
ER Approach
G
OA
D
Direction of flow
Base from U.S. Department of Agriculture 0 375 750 1,500 FEET
Farm Service Agency, GeoEye, and Maxar
digital data, 2020. Base image copyright
2020 Esri and its licensors 0 100 200 400 METERS
Figure 6. Inundation areas of the 1-percent annual exceedance probability discharge at the White Rock Dam study site, Westerly,
Rhode Island.Introduction 9
71°58' 71°57'50" 71°57'40" 71°57'30" 71°57'20"
41°24'
KE
PI
RN
TU
ON
41°23'50"
ND
LO
W
SH
NE
EW
VIL
LE
RO
AD
ok
ro
dB
for
hit
W
EXPLANATION
Post-dam-removal inundation area
Pre-dam-removal inundation area
41°23'40"
Limit of study
Hyde Pond Dam
Approach
Direction of flow
Base from U.S. Department of Agriculture 0 200 400 800 FEET
Farm Service Agency, GeoEye, and Maxar
digital data, 2020. Base image copyright
2020 Esri and its licensors 0 50 100 200 METERS
Figure 7. Inundation areas of the 1-percent annual exceedance probability discharge at the Hyde Pond Dam study site, Mystic,
Connecticut.10 Hydraulic Modeling at Selected Dam-Removal and Culvert-Retrofit Sites in the Northeastern United States
72°58'40" 72°58'30"
41°20'10"
EXPLANATION
ET
ver
TRE
Post-dam-removal inundation area LS
Ri
EL
SD
West
Pre-dam-removal inundation area M
41°20' RA
ST
WH
Limit of study EA
A
LLE
Pond Lily Dam
YA
VE
Approach
NU
E
Direction of flow
Base from U.S. Department of Agriculture 600 FEET
0 150 300
Farm Service Agency, GeoEye, and Maxar
digital data, 2020. Base image copyright
2020 Esri and its licensors 0 40 80 160 METERS
Figure 8. Inundation areas of the 1-percent annual exceedance probability discharge at the Pond Lily Dam study site, New Haven,
Connecticut.Introduction 11
75°08'20" 75°08'15" 75°08'10" 75°08'05"
40°37'55"
40°37'50"
River
one tcong
Musc
AD
RO
EN
GL
EN
A RR
W
D
OR
ILF
40°37'45" M
EXPLANATION
Post-dam-removal inundation area
Pre-dam-removal inundation area
Limit of study
Hughesville Dam
Approach
Direction of flow
Base from U.S. Department of Agriculture 0 150 300 600 FEET
Farm Service Agency, GeoEye, and Maxar
digital data, 2020. Base image copyright
2020 Esri and its licensors 0 40 80 160 METERS
Figure 9. Inundation areas of the 1-percent annual exceedance probability discharge at the Hughesville Dam study site, Warren
Glen, New Jersey.12 Hydraulic Modeling at Selected Dam-Removal and Culvert-Retrofit Sites in the Northeastern United States
74°01'50" 74°01'40" 74°01'30" 74°01'20"
40°08'40"
40°08'30"
EXPLANATION
Post-dam-removal inundation area
E
Pre-dam-removal inundation area
AVENU
Limit of study
FIRST
Wreck Pond Brook Outfall structure
Approach
Direction of flow
Wreck
P ond Bro
40°08'20" ok
Base from U.S. Department of Agriculture 0 300 600 1,200 FEET
Farm Service Agency, GeoEye, and Maxar
digital data, 2020. Base image copyright
2020 Esri and its licensors
0 75 150 300 METERS
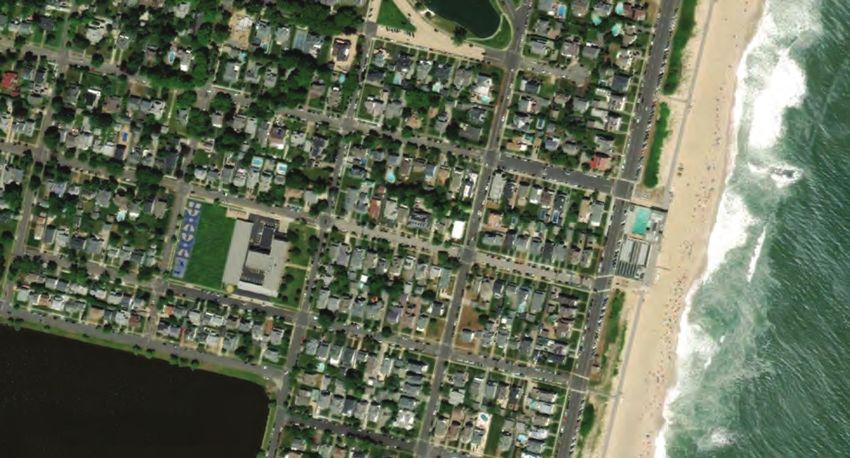
Figure 10. Inundation areas of the 1-percent annual exceedance probability discharge at the Wreck Pond Brook Outfall study site,
Spring Lake, New Jersey.Development of Hydraulic Models 13
Development of Hydraulic Models The FWS also provided a HEC–RAS model developed
by Inter-Fluve engineering firm. The model was a one-
Both one- and two-dimensional hydraulic models for the dimensional hydraulic model that went from just downstream
study sites were developed by using the U.S. Army Corps of from the Hopewell Mills Dam site to upstream from the
Engineers Hydrologic Engineering Center’s River Analysis impoundment of the Whittenton Dam and included all three
System (HEC–RAS), version 5.0.6 (U.S. Army Corps of study sites on the Mill River. The model, with minor correc-
Engineers, 2016). The hydraulic models were developed for tions made to bank stations, roughness, and bathymetry, was
conditions before and after dam removal or culvert retrofit. used for pre-dam-removal conditions. It was also used as the
Geometry data of the dam or culvert and a digital elevation base for the post-dam-removal one-dimensional model, in
model (DEM) of the terrain incorporating the channel bathym- which newly surveyed bathymetry was applied in the three
etry and surrounding topography, before and after the dam study reaches.
removal or culvert retrofit, were needed for model input. The The pre- and post-dam-removal one-dimensional models
models were run using the mean or median monthly dis- were used as the basis for developing the pre- and post-dam-
charges and the flood discharges for the AEPs of 50, 20, 10, 4, removal two-dimensional models. For the two-dimensional
2, 1, 0.5, and 0.2 percent. modeling, the one-dimensional models were shortened to be
specific to the dam sites. At the Whittenton Dam site (fig. 2),
the resulting model extended from about 200 feet downstream
Data Used to Develop Models from the Whittenton Street bridge or about 700 feet down-
stream from the dam to about 2,200 feet upstream from the
Available data were used to develop the hydraulic models dam. Sections were removed near the dam and impoundment
for conditions before dam removal or culvert retrofit at each and replaced by a two-dimensional mesh generated from
site. The available data included topography, bathymetry, and the respective pre- or post-dam-removal DEM. The meshes
structural geometry data. The topography datasets used for extended from about 250 downstream to 400 feet upstream
the digital elevation models (DEMs) in the hydraulic models from the dam location.
were obtained from preexisting sources of light detection and
ranging (lidar) or DEM data. The FWS provided much of
the preremoval data. These were data that had been used in West Britannia Dam
the planning of the dam removals and culvert retrofit, includ-
The models for the West Britannia Dam site (fig. 3)
ing DEMs, survey data, existing hydraulic models, and site
were developed in the same way the Whittenton Dam mod-
plans with structural and topographic information. Often the
els were developed. For the West Britannia Dam, the models
provided data were merged with publically available elevation
extended from about 500 feet downstream from the dam to
datasets to produce the final terrain dataset used in the models.
about 1,800 feet upstream from the dam location. The two-
To develop the hydraulic models at the sites for condi-
dimensional mesh for the pre-dam-removal model extended
tions after dam removal or culvert retrofit, the latest lidar data
from about 100 feet downstream from the dam to about
were merged with field survey data. The sites were surveyed
280 feet upstream from the dam. The two-dimensional mesh
between June 2018 and September 2019 during periods of low
for the post-dam-removal model extended from about 100 feet
flow. Pre-dam-removal geometry data supplied by the FWS,
downstream from the dam site to about 430 feet upstream
survey data, photographs, hydrologic data, and the hydraulic
from the dam site.
models of the study sites are available as a U.S. Geological
Survey (USGS) data release by Simeone and others (2021).
The following subsections describe the data used to develop Hopewell Mills Dam
the models for each study site.
The models for the Hopewell Mills Dam site (fig. 4) were
developed in the same way the Whittenton Dam models were
Whittenton Dam developed. For the Hopewell Mills Dam, the models extended
from about 400 feet downstream from the dam to about
The FWS provided a DEM developed by Inter-Fluve
1,750 feet upstream from the dam site. The two-dimensional
engineering firm for pre-dam-removal conditions. This
meshes for the models extended from about 200 feet
pre-dam-removal DEM contained bathymetric data. For the
downstream from the dam to about 1,280 feet upstream
post-dam-removal conditions, a new base DEM was devel-
from the dam.
oped by using the DEM from the Coastal National Elevation
Database (CONED) Project (U.S. Geological Survey, 2016).
A new bathymetric DEM was generated from newly sur- Bradford Dam
veyed bathymetric points by using ArcGIS Pro (Esri, 2020)
and GeoHECRAS (CivilGEO, Inc., 2020) software. The new The DEM for the pre-dam-removal model of the
bathymetric DEM was merged into the base DEM by using Bradford Dam study site reach (fig. 5) was developed from
ArcGIS Pro. several sources. The base dataset was the DEM from lidar14 Hydraulic Modeling at Selected Dam-Removal and Culvert-Retrofit Sites in the Northeastern United States
data collected in 2011 (Rhode Island Geographic Information DEMs of the channel bathymetry were then merged into the
System, 2013). Additional data provided by the FWS included base DEM by using ArcGIS Pro to develop the final dataset
bathymetric contours surrounding the dam site and a used in the preremoval hydraulic modeling.
HEC–RAS hydraulic model of the river reach. These data This DEM was used to develop the one-dimensional
provided by the FWS were developed by Fuss & O’Neill engi- and two-dimensional models for preremoval conditions.
neering consultants before the dam removal. These bathymet- The models extended from the White Rock Bridge Road,
ric contour data were converted to a DEM by using ArcGIS 3,400 feet downstream from the dam, to 3,200 feet upstream
Pro software. The bathymetry from the hydraulic model’s from the dam. Cross sections were developed on the basis
cross sections were converted to a DEM by using tools within of the DEM, which mimicked the sections in the provided
HEC–RAS. Another DEM was developed of the buildings model. Additional cross sections between the furnished
in the floodplain. The DEMs of the channel bathymetry, the detailed bathymetric data and the downstream bridge (White
detailed bathymetry around the dam, and the buildings were Rock Bridge Road) were gleaned from the furnished model.
then merged into the base DEM to develop the final dataset The geometry of the dam and the downstream bridge were
used in the preremoval hydraulic modeling for this site. also taken from the provided HEC–RAS model. The two-
This DEM was then used to develop the one-dimensional dimensional model was based on the one-dimensional model.
and two-dimensional models for preremoval conditions. The A two-dimensional mesh, which extended from approxi-
models generated for the Bradford Dam site extended from mately 1,350 feet downstream from the dam to about 450 feet
2,900 feet downstream from the dam location to 2,050 feet upstream from the dam and incorporated the canal to the east
upstream. Cross sections were derived from the DEM, which of the river, replaced selected cross sections.
mimicked the sections in the furnished model. The geometry The base DEM for the conditions after the dam removal
of the removed dam and the bridge 280 feet upstream from was also based upon the CONED DEM for overbank areas.
the dam (Rhode Island State Route 91) used in the preremoval However, the bathymetry for this DEM was based upon
hydraulic model were gleaned from the furnished HEC–RAS field surveys done for this project. The surveyed bathymetry
model. For the two-dimensional models, selected cross sec- extended from about 1,300 feet downstream from the dam site
tions were removed from the one-dimensional model and to about 900 feet upstream. The bathymetry was converted to
replaced with a two-dimensional mesh that extended from a DEM and merged into the base DEM by using tools in
2,900 feet downstream from the dam to about 200 upstream HEC–RAS and ArcGIS Pro. Cross sections and two-
from the dam. dimensional mesh for the post-dam-removal models were
The DEM for the conditions after the dam removal was developed on the basis of this final DEM. The cross sections
also based upon the 2011 DEM for overbank areas. However, beyond the surveyed bathymetry and for the bridge (White
the bathymetry for this DEM was based upon field surveys Rock Bridge Road) at the downstream end of the model were
done for this project. The surveyed bathymetry was converted taken from the pre-dam-removal model.
to a DEM by using tools in HEC–RAS. The cross sections and
the two-dimensional mesh for the post-dam-removal models
were generated from this DEM. The geometry of the eight Hyde Pond Dam
weirs that were constructed in place of the dam and the geom- The DEM for the preremoval topography of the Hyde
etry of the bridge were surveyed and used in the post-dam- Pond Dam study site (fig. 7) was developed from several
removal models. The extents of the post-dam-removal model sources. The base dataset was a DEM developed as part of
and two-dimensional mesh were the same as the extents of the the CONED Project (U.S. Geological Survey, 2016). Because
pre-dam-removal models. of a small gap in the base DEM near the upstream end of the
impoundment, data from a 2005 DEM (National Centers for
White Rock Dam Environmental Information, 2005) were used to fill the gap.
Additional data provided by the FWS included bathymetric
The DEM for the preremoval topography of the White contour data within the impoundment upstream from the dam
Rock Dam study site reach (fig. 6) was developed from several site and a HEC–RAS model of the site. These furnished data
sources. The base dataset was a DEM developed as part of the were developed by Princeton Hydro engineering consultants
CONED Project (U.S. Geological Survey, 2016). Additional before the dam removal. The bathymetric contour data in the
data provided by the FWS included bathymetric contours impoundment were converted to a DEM by using ArcGIS Pro
below the dam location and a HEC–RAS hydraulic model of software. Additional bathymetry from the hydraulic model’s
the river reach. These data provided by the FWS were devel- cross sections was difficult to use because the model was not
oped by Fuss & O’Neill engineering consultants before the georeferenced. However, estimates of cross-section locations
dam removal. The bathymetric data were converted to a DEM were made and the bathymetry was converted to a DEM by
by using ArcGIS Pro software. Additional bathymetry from using tools within HEC–RAS. For 1,100 feet of the upstream
the furnished hydraulic model’s cross sections were converted end of the study, no pre-dam-removal bathymetric data were
to a DEM by using tools in the GeoHECRAS software. The available, so a bathymetric DEM of this reach was generatedDevelopment of Hydraulic Models 15
by using new survey data collected for this study. The DEMs 2020). The additional bathymetry from the hydraulic model’s
of the channel bathymetry were merged into the base DEM to cross sections were converted to a DEM by using tools within
develop the final dataset of the pre-dam-removal DEM. HEC–RAS. Another DEM was developed of the buildings
The pre-dam-removal DEM was used to develop the in the floodplain. The DEMs of the channel bathymetry, the
one-dimensional model for pre-dam-removal conditions. The detailed bathymetry around the dam, and the buildings were
model extended from 1,200 feet downstream from the dam to then merged into the base DEM to develop the final dataset of
3,250 feet upstream. Cross sections were generated by using the pre-dam-removal DEM.
the pre-dam-removal DEM. Channel elevations were adjusted The pre-dam-removal DEM was used to develop the
at some sections on the basis of the furnished model. This was one-dimensional and two-dimensional models for pre-dam-
necessary because the furnished model was not georeferenced removal conditions. The models extended from 1,600 feet
and channel data in the pre-dam-removal DEM did not match downstream from the dam to 1,100 feet upstream. Cross
the furnished model in some locations. No adjustments were sections were generated on the basis of the DEM, which
made to cross sections in the impoundment where the bathy- mimicked the sections in the provided model. The geometry of
metric contour data were available. the dam and the bridge (East Ramsdell Street) at the down-
The geometry of the dam for the one-dimensional pre- stream end of the study reach were gleaned from the provided
dam-removal model was taken from the furnished HEC–RAS HEC–RAS model. The two-dimensional mesh generated from
model. Since the State Route 184 bridge in the furnished the pre-dam-removal DEM extended from approximately
HEC–RAS model was of proposed dimensions that had not 1,150 feet downstream from the dam to about 1,100 feet
yet been built, the bridge in the pre-dam-removal model was upstream from the dam.
generated by using new survey data collected for this study. The base DEM for the conditions after the dam removal
The pre-dam-removal one-dimensional model was used was based upon the 2016 DEM (Capitol Region Council of
to develop the two-dimensional hydraulic model. In the two- Governments, 2017) for overbank areas. The bathymetry for
dimensional model, cross-section data from 680 feet down- the reach was based upon field surveys done for this project.
stream from the dam to the upstream end of the study reach The surveyed bathymetry went from 450 feet downstream
were removed and replaced with a two-dimensional mesh. from the dam location to 1,100 feet upstream. Downstream
This mesh extended from 680 feet downstream from the dam from the surveyed bathymetry, additional bathymetric data
to 3,250 feet upstream from the dam. The mesh was generated from the furnished pre-dam-removal model were used. The
from the pre-dam-removal DEM. bathymetry was converted to a DEM and merged with the
The base DEM for the conditions after the dam removal DEM of buildings into base DEM by using tools in ArcGIS
was based upon the 2016 DEM (Capitol Region Council of Pro and HEC–RAS. Cross sections and the two-dimensional
Governments, 2017). The bathymetry for this DEM was based mesh for the post-dam-removal models were developed on
upon field surveys done for this project. The surveyed bathym- the basis of this final DEM. The geometry of the bridge at
etry was available for the entire study reach from 1,200 feet the downstream end of the study reach was taken from the
downstream from the dam to 3,250 feet upstream. The pre-dam-removal model. The post-dam-removal models and
bathymetry was converted to a DEM and merged into the base two-dimensional mesh had the same areal extent as the pre-
DEM by using tools in ArcGIS Pro and HEC–RAS. Cross sec- dam-removal models and mesh.
tions and the two-dimensional mesh for the post-dam-removal
models were developed on the basis of this final post-dam-
removal DEM. The geometry of the bridge at the downstream Hughesville Dam
end of the study reach was also from the study’s survey data. The FWS provided topographic and bathymetric contour
The post-dam-removal models and two-dimensional mesh data for the Hughesville Dam study site (fig. 9). The FWS also
had the same areal extent as the pre-dam-removal models provided a HEC–RAS one-dimensional hydraulic model of the
and mesh. river reach. The furnished data were developed by Princeton
Hydro engineering consultants before the dam removal.
Pond Lily Dam The topographic and bathymetric contour data were merged
and converted to a DEM by using ArcGIS Pro software.
The DEM for the preremoval conditions of the Pond Downstream from the part of the site for which bathymetric
Lily Dam study site reach (fig. 8) was developed from several contour data were provided, additional bathymetry from the
sources. The base dataset was the lidar data collected in 2011 furnished hydraulic model’s cross sections were converted to
(Federal Emergency Management Agency, 2013). Additional a DEM by using tools within GeoHECRAS software. Another
data provided by the FWS included bathymetric elevation DEM was generated of the buildings in the floodplain and of
data within the reach upstream and downstream from the the bridge abutments of the Milford Warren Glen Road bridge.
dam site and a HEC–RAS hydraulic model of the river reach. The DEMs were then merged to develop the final dataset of
These furnished data were developed by Stantec engineering the pre-dam-removal DEM.
consultants before the dam removal. These bathymetric data
were converted to a DEM by using ArcGIS Pro software (Esri,16 Hydraulic Modeling at Selected Dam-Removal and Culvert-Retrofit Sites in the Northeastern United States
The one-dimensional and two-dimensional pre-dam- The base DEM for the conditions after the culvert retrofit
removal models were based on this pre-dam-removal DEM. was based upon the 2014 DEM (U.S. Geological Survey,
Cross sections for the one-dimensional model and the mesh 2015). The bathymetry was based upon field surveys done for
for the two-dimensional model were generated from this this project. The surveyed bathymetry went from the outfall
DEM. The dam geometry used in both the one- and two- structure to roughly 1,000 feet upstream from the outfall
dimensional models was taken from the furnished model. The structure. The surveyed bathymetry was converted to a DEM
bridge geometry used in the one-dimensional model was taken and merged with the DEM of the First Avenue bridge into base
from the newly surveyed data collected for this study. Both DEM by using tools in ArcGIS Pro and HEC–RAS to generate
the one-dimensional model and the two-dimensional mesh the post-culvert-retrofit DEM. The one- and two-dimensional
extended from about 280 feet downstream from the dam to post-culvert-retrofit models were then developed in the
1,380 feet upstream from the dam. Since the DEM included same fashion and with the same extents as the pre-culvert-
the bridge abutments, the two-dimensional mesh used in retrofit models.
the two-dimensional model extended through the bridge.
Modeling the reach with this mesh was viable because the
water surface does not reach the deck of this bridge. Development of Hydrology
To develop the post-dam-removal DEM, the new bathym-
The models in this study were run by using the mean
etry surveyed as part of this study was converted to a DEM
or median monthly discharges and the flood discharges for
by using tools in HEC–RAS. This new bathymetric DEM
the AEPs of 50, 20, 10, 4, 2, 1, 0.5, and 0.2 percent. These
was then merged with the pre-dam-removal DEM, replac-
statistical flows were obtained from available published
ing the pre-dam-removal bathymetry. The post-dam-removal
sources, computed from available USGS streamgage data, or
one-dimensional and two-dimensional hydraulic models were
determined from regression equations by using StreamStats
then developed on the basis of the post-dam-removal DEM by
(https://streamstats.usgs.gov/ss/).
using the same procedures and extents as used for the pre-
For the Mill River, flood discharge hydrology was
dam-removal hydraulic models.
computed by using available 2006 to 2018 annual peak
discharges from the Mill River at Spring Street at Taunton,
Wreck Pond Brook Outfall Mass., streamgage (station identifier 01108410). The annual
peak discharges are available from the USGS National
The DEM for the pre-culvert-retrofit conditions of the Water Information System (U.S. Geological Survey, 2019;
Wreck Pond Brook Outfall site (fig. 10) was developed from https://waterdata.usgs.gov/nwis). The flood discharges for
several sources. The base dataset was the DEM from lidar data the 50-, 20-, 10-, 4-, 2-, 1-, 0.5-, and 0.2-percent AEPs were
collected in 2011 (U.S. Geological Survey, 2012). A DEM of computed with the U.S. Geological Survey PeakFQ soft-
bathymetry was generated from a georeferenced 2014 bathy- ware (Flynn and others, 2006) by following the guidelines
metric map of Wreck Pond and Wreck Pond Brook (Najarian by England and others (2018). The flood discharges were
Associates and Leon S. Avakian, Inc., 2015) by using ArcGIS then weighted with the regional regression equations for
Pro. A DEM of the First Avenue bridge abutments (about Massachusetts (Zarriello, 2017) by using techniques described
475 feet upstream from the outfall structure) was gener- by England and others (2018). Because of the proximity of
ated to facilitate the two-dimensional modeling through the the streamgage to the three modeled sites on the Mill River—
bridge structure. The base DEM, the bathymetric DEM, and the streamgage has a drainage area of 43.5 square miles and
the abutment DEM were merged to develop the pre-culvert- the Whittenton Dam Site has a drainage area of 41.1 square
retrofit DEM. miles—the discharges determined at the streamgage were used
The pre-culvert-retrofit one-dimensional model was at all the Mill River dam sites. The resulting flood discharges
generated from the pre-culvert-retrofit DEM. Cross-section for the 50-, 20-, 10-, 4-, 2-, 1-, 0.5-, and 0.2-percent AEPs at
data were generated from this DEM. The geometry of the the Mill River dam sites are shown in table 1.
gate structure on the upstream side of the outfall and the The mean monthly discharges for the Mill River
First Avenue bridge geometry in the one-dimensional model streamgage were determined from daily mean streamflows
were developed from survey data collected for this study. from January 2006 to February 2019. A script written for
The inverts, length, and diameter of the conduit in the outfall R software (R Core Team, 2017) was used to download and
structure were taken from Najarian Associates and Leon S. compute the monthly discharges. The R script can be found in
Avakian, Inc. (2015). The one-dimensional hydraulic model the data release (Simeone and others, 2021). Because of the
went from the outlet of the outfall to approximately 1,000 feet proximity of the Mill River streamgage to the Mill River dam
upstream from the outfall structure. The two-dimensional sites, the mean monthly flows determined for the streamgage
pre-culvert-retrofit model was generated by using the out- site were used at all three Mill River dam sites. The result-
fall geometry from the one-dimensional model and a two- ing mean monthly discharges for the Mill River dam sites are
dimensional mesh generated from the pre-culvert-retrofit DEM shown in table 2.
extending from 50 feet upstream from the outfall structure to
approximately 2,200 feet upstream from the outfall structure.Development of Hydraulic Models 17
Table 1. Flood discharges of the 50-, 20-, 10-, 4-, 2-, 1-, 0.5-, and 0.2-percent annual exceedance probabilities at streamgages and
dam-removal and culvert-retrofit study sites in Massachusetts, Rhode Island, Connecticut, and New Jersey.
[mi2, square mile; ft3/s, cubic foot per second; %, percent; MA, Massachusetts; RI, Rhode Island; CT, Connecticut; NJ, New Jersey]
Drainage Flood discharge for given annual exceedance probability, in ft3/s
Location area,
in mi2 50% 20%1 10% 4%1 2% 1% 0.5%1 0.2%
Mill River
Whittenton Dam 41.1 550 753 908 1,130 1,320 1,520 1,740 2,060
West Britannia Dam 42.0 550 753 908 1,130 1,320 1,520 1,740 2,060
Hopewell Mills Dam 42.3 550 753 908 1,130 1,320 1,520 1,740 2,060
Mill River at Spring Street at
Taunton, MA, streamgage 43.5 550 753 908 1,130 1,320 1,520 1,740 2,060
(01108410)
Pawcatuck River
Pawcatuck River at Wood
River Junction, RI, streamgage 99.3 7502 1,020 1,280 1,650 1,960 2,310 2,670 3,220
(01117500)
Bradford Dam3 218 1,760 2,380 2,960 3,830 4,560 5,400 6,260 7,560
White Rock Dam3 292 2,420 3,260 4,050 5,230 6,250 7,400 8,590 10,400
Pawcatuck River at Westerly, RI,
295 2,4502 3,300 4,090 5,290 6,320 7,480 8,690 10,500
streamgage (01118500)
Whitford Brook
Hyde Pond Dam 15.0 442 7403 1,010 1,390 1,700 2,040 2,3403 2,700
Whitford Brook at Old Mystic,
15.0 442 7403 1,010 1,390 1,700 2,040 2,3403 2,700
CT, streamgage (01118700)
West River
Pond Lily Dam 17.1 682 1,1203 1,450 1,900 2,270 2,660 3,0403 3,530
Musconetcong River
Musconetcong River near
Bloomsbury, NJ, streamgage 141 1,980 3,200 4,130 5,440 6,510 7,660 8,9003 10,700
(01457000)
Hughesville Dam2 148 2,040 3,290 4,250 5,600 6,700 7,880 9,1603 11,000
Wreck Pond Brook
Wreck Pond Brook Outfall 12.7 256 399 508 654 763 886 1,0003 1,160
1Two-dimensional model not developed for this discharge.
2Value extrapolated.
3Value interpolated.
The Bradford Dam site and the White Rock Dam site mean streamflows from October 1940 to February 2019. A
are both on the Pawcatuck River. The Pawcatuck River has script written for R software (R Core Team, 2017) was used to
two streamgages—Pawcatuck River at Wood River Junction, download and compute the monthly discharges. The R script
R.I. (station identifier: 01117500), and Pawcatuck River at can be found in the data release (Simeone and others, 2021).
Westerly, R.I. (station identifier: 01118500). The drainage area The flood discharges and the mean monthly discharges at the
of the Wood River Junction streamgage is 99.3 square miles, Pawcatuck River dam sites were logarithmically interpolated
and the drainage area of the Westerly streamgage is 295 square between the two streamgages on the basis of drainage area.
miles. The two dam sites are between the streamgages. The The results are shown in tables 1 and 2.
flood discharges for the 50-, 20-, 10-, 4-, 2-, 1-, 0.5-, and The flood discharges for Whitford Brook at the site of the
0.2-percent AEPs for the two streamgages were obtained from Hyde Pond Dam were determined by using StreamStats. These
Zarriello and others (2012). The mean monthly discharges for discharges from StreamStats were computed on the basis of
the Pawcatuck River streamgages were determined from daily the regression equations by Ahearn (2004). Mean monthlyYou can also read