Antimicrobial resistance in the EU/EEA (EARS-Net) - AER for 2019
←
→
Page content transcription
If your browser does not render page correctly, please read the page content below

Antimicrobial resistance in the EU/EEA – AER 2019 SURVEILLANCE REPORT
SURVEILLANCE REPORT
Antimicrobial resistance in the
EU/EEA (EARS-Net)
Annual Epidemiological Report for 2019
Key facts
Thirty European Union (EU) or European Economic Area (EEA) countries reported data for 2019 to the
European Antimicrobial Resistance Surveillance Network (EARS-Net). Twenty-nine countries reported
data for all eight bacterial species under surveillance by EARS-Net (Escherichia coli,
Klebsiella pneumoniae, Pseudomonas aeruginosa, Acinetobacter species, Streptococcus pneumoniae,
Staphylococcus aureus, Enterococcus faecalis and Enterococcus faecium), while one country reported
data for all bacterial species except S. pneumoniae.
EARS-Net data for 2019 displayed wide variations in the occurrence of antimicrobial resistance (AMR)
across the EU/EEA depending on the bacterial species, antimicrobial group and geographical region.
The most commonly reported bacterial species was E. coli (44.2%), followed by S. aureus (20.6%),
K. pneumoniae (11.3%), E. faecalis (6.8%), P. aeruginosa (5.6%), S. pneumoniae (5.3%), E. faecium
(4.5%) and Acinetobacter species (1.7%).
In 2019, more than half of the E. coli isolates reported to EARS-Net and more than a third of
the K. pneumoniae isolates were resistant to at least one antimicrobial group under surveillance, and
combined resistance to several antimicrobial groups was frequent. Resistance percentages were
generally higher in K. pneumoniae than in E. coli. While carbapenem resistance remained rare in E. coli,
several countries reported carbapenem resistance percentages above 10% in K. pneumoniae.
Carbapenem resistance was also common in P. aeruginosa and Acinetobacter species, and at higher
percentages than in K. pneumoniae. For most gram-negative bacterial species–antimicrobial group
combinations, changes in resistance percentages between 2015 and 2019 were moderate, and
resistance remained at previously reported high levels.
For S. aureus, the decline in the percentage of meticillin-resistant (i.e. MRSA) isolates reported in
previous years continued in 2019. Nevertheless, MRSA remains an important pathogen in the EU/EEA,
with levels still high in several countries, and combined resistance to another antimicrobial group was
common. Decreases during the same period were also noted for penicillin non-wild type and macrolide
resistance in S. pneumoniae.
One development of particular concern was the increase in the percentage of vancomycin-resistant
isolates of E. faecium in the EU/EEA, from 10.5% in 2015 to 18.3% in 2019 (EU/EEA population-
weighted mean percentage).
For several bacterial species–antimicrobial group combinations, a north-to-south and west-to-east gradient
was evident in the EU/EEA. In general, lower percentages of resistance were reported by countries in the
north of Europe and higher percentages were reported by countries in the south and east of Europe.
However, for vancomycin-resistant E. faecium, no distinct geographical pattern was evident.
Suggested citation: European Centre for Disease Prevention and Control. Antimicrobial resistance in the EU/EEA (EARS-Net) -
Annual Epidemiological Report 2019. Stockholm: ECDC; 2020.
Stockholm, November 2020
© European Centre for Disease Prevention and Control, 2020. Reproduction is authorised, provided the source is acknowledged.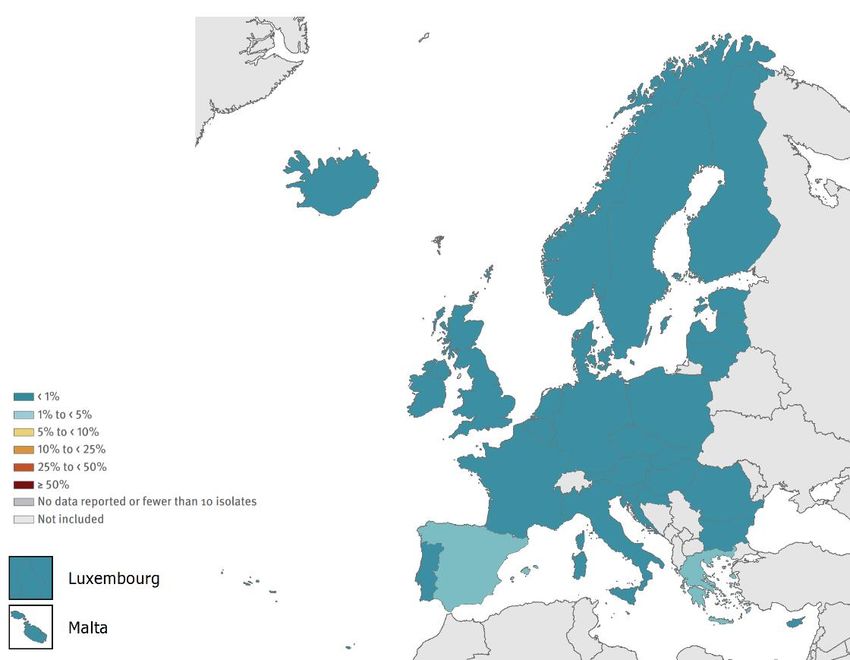
Antimicrobial resistance in the EU/EEA (EARS-Net) – AER 2019                                                 SURVEILLANCE REPORT

Methods
This report is based on data reported to the European Antimicrobial Resistance Surveillance Network (EARS-Net) for
the period 2015 to 2019, retrieved from The European Surveillance System (TESSy) and ECDC’s decentralised data
storage for antimicrobial resistance and healthcare-associated infections (ARHAI) on 10 September 2020. TESSy is a
system for the collection, analysis and dissemination of data on communicable diseases in Europe. The ARHAI
decentralised data storage is a system allowing EU/EEA countries to store their surveillance data on their national
servers in TESSy data format. A subset of the data used for this report is available online from ECDC’s online
Surveillance Atlas of Infectious Diseases [1].
The antimicrobial resistance (AMR) results presented in this report are based on antimicrobial susceptibility testing (AST)
results from invasive (blood or cerebrospinal fluid) isolates of eight bacterial species. These species are all of public
health importance in Europe: Escherichia coli, Klebsiella pneumoniae, Pseudomonas aeruginosa, Acinetobacter species,
Streptococcus pneumoniae, Staphylococcus aureus, Enterococcus faecalis and Enterococcus faecium.
Each year, 30 European Union (EU) and European Economic Area (EEA) countries report AST results collected from
medical microbiology laboratories to EARS-Net. When it is not possible to include data from all relevant laboratories in
the country, countries can report data from sentinel laboratories. In 2019, the estimated national population coverage
of the data reported to EARS-Net varied between 11% and 100%, with more than one third of the countries reporting
a population coverage of 80% or higher. Data validity, reported as sample representativeness by the National Focal
Points for AMR and/or the Operational Contact Points for Epidemiology/Microbiology/TESSY-IT data manager for AMR,
was assessed as high by just under two thirds of the countries. However, of the eight countries reporting medium or
poor geographical representativeness or hospital sample representativeness, most were countries with a
comparatively low population coverage (Table 1).
For several countries, there have been changes in the blood culture rate, population coverage or data
representativeness between 2015 and 20191, and these differences should be kept in mind when interpreting trends
in AMR percentages.
Starting with data collected for 2019, EARS-Net now only accepts AST results generated using the European
Committee on Antimicrobial Susceptibility Testing (EUCAST) clinical breakpoints and methodology [2], thus ensuring
compliance with the EU case definition for AMR [3]. In previous years, use of EUCAST breakpoints was encouraged,
but results based on other interpretive criteria were accepted. In 2019, a majority of countries had fully implemented
the EUCAST methodology among EARS-Net contributing laboratories. However, for a few countries, this new
requirement has resulted in a lower number of laboratories included in 2019 compared to previous years.
The ongoing COVID-19 pandemic has challenged the national reporting capacity of some countries, resulting in fewer
laboratories reporting compared to previous years. An overview of the number of reporting laboratories and of
isolates reported, per country and for the period 2015 to 2019, can be found in a PDF containing all country
summaries which is available on the landing page for this report (see footnote 1).
A more detailed description of the methodology is available in the EARS-Net reporting protocol [4]. All laboratories
providing data to EARS-Net are offered the opportunity to participate in an annual External Quality Assessment (EQA)
to assess the reliability of the laboratory test results [5].

Data analysis
Before data analysis, data were de-duplicated to only include the first isolate per patient, year and bacterial
species. The main steps of the data analysis are described in the next sections. For a detailed description of the
EARS-Net surveillance system and how the data is interpreted, please refer to the EARS-Net 2018 report [6].

AST categories
For the analysis, an isolate was considered as resistant to an antimicrobial agent when tested and categorised as
resistant (R) according to EUCAST clinical breakpoints. For S. pneumoniae, the term penicillin non-wild-type was
used in this report, referring to S. pneumoniae isolates reported by the local laboratories as ‘susceptible, increased
exposure’ (I) or resistant (R) to penicillin, assuming Minimum Inhibitory Concentrations (MIC)s to benzylpenicillin
above those of wild-type isolates (i.e. >0.06 mg/L). Data reported before 2019 may include results obtained using
other clinical breakpoints, with different definitions of the cut-off values for the AST categories.

National percentages
Resistance/non-wild-type percentages are presented for a single antibiotic and/or for a group of antibiotics. The bacterial
species-antimicrobial agent combinations presented in this report are shown in Table 2. When combining the results for a

1 A PDF containing all country summaries is available on the landing page for this report at the following link:
https://www.ecdc.europa.eu/en/publications-data/surveillance-antimicrobial-resistance-europe-2019

2
SURVEILLANCE REPORT                                                        Antimicrobial resistance in the EU/EEA – AER 2019

group of antibiotics, the outcome was based on the result for the antibiotic showing the highest level of resistance. For
example, when an isolate was ‘susceptible, increased exposure’ (I) to imipenem and ‘resistant’ (R) to meropenem, then
the susceptibility to the group carbapenems, which comprises imipenem and meropenem, was set to R.
Combined resistance was reported when the isolate was R to at least one antibiotic in each of the antibiotic groups
in the definition of combined resistance, with the exception of S. pneumoniae for which combined resistance was
based on combined penicillin non-wild-type and R to macrolides (Table 3). Isolates with missing data for one or
several of the required antibiotic groups were excluded from the analysis of combined resistance. Missing data
could be caused by differences in local AST panels or limited reporting of results to local or national surveillance
initiatives. The proportion of isolates included should be taken into account when interpreting results for combined
resistance.
When fewer than 10 isolates were reported for a specific bacterial species–antimicrobial group combination in a
country, the AMR percentage was not displayed on the maps or in the tables presented in this report.

EU/EEA population-weighted mean percentage
An EU/EEA population-weighted mean percentage was determined by multiplying the AMR percentage for each
country with the corresponding national population weight and summing up the results; weights were rescaled if
AMR percentages were not available for one or more countries. Annual population data were retrieved from the
Eurostat online database [7]. To calculate the EU/EEA percentage, country weightings were used to adjust for
imbalances in reporting propensity and population coverage, since, in most cases, the number of reported isolates
by country was not representative of the total population.

Trend analyses
The statistical significance of temporal trends in AMR percentages by country and for the EU/EEA population-
weighted mean was calculated based on data from the last five years (i.e. 2015 to 2019). Countries reporting
fewer than 20 isolates for any individual year within the period, or not providing data for all years within the
period, were not included in the analysis. The statistical significance of trends was assessed by a chi-square test
for trend, and a p-value of
Antimicrobial resistance in the EU/EEA (EARS-Net) – AER 2019                                               SURVEILLANCE REPORT

Table 1. Self-assessed national coverage and sample representativeness* and blood culture
sets/1 000 patient-days, EU/EEA countries, 2019
    Country       Estimated national        Geographical            Hospital         Patient and isolate     Blood culture sets/
                       population        representativeness    representativeness    representativeness      1 000 patient-days
                     coverage (%)
    Austria       Unknown               High                   High                  High                   Unknown
    Belgium       26                    Medium                 High                  High                   87.5**
    Bulgaria      45                    Medium                 Medium                Medium                 8.6
    Croatia       Unknown               Unknown                Unknown               Unknown                Unknown
    Cyprus        35                    High                   High                  High                   56.9
    Czechia       81                    High                   High                  High                   16.8
    Denmark       100                   High                   High                  High                   160.9
    Estonia       100                   High                   High                  High                   33.4
    Finland       96                    High                   High                  High                   160.4
    France        20**                  High                   High                  High                   112.2
    Germany       27                    High                   Medium                High                   37.9
    Greece        Unknown               Unknown                Unknown               Unknown                Unknown
    Hungary       90                    High                   High                  High                   12.3
    Iceland       100                   High                   High                  High                   61.6
    Ireland       96                    High                   High                  High                   58.9
    Italy         41                    High                   High                  High                   Unknown
    Latvia        90                    High                   Medium                Medium                 9.5
    Lithuania     100                   High                   High                  High                   6.1
    Luxembourg    Unknown               Unknown                Unknown               Unknown                Unknown
    Malta         95                    High                   High                  High                   28.5
    Netherlands   70                    High                   High                  High                   Unknown
    Norway        94                    High                   High                  High                   86.7
    Poland        17                    Medium                 Medium                Medium                 39.8
    Portugal      97                    High                   High                  High                   244.2
    Romania       11                    Poor                   Poor                  Poor                   21.0
    Slovakia      56                    High                   High                  High                   36.1
    Slovenia      99                    High                   High                  High                   40.4
    Spain         32                    Medium                 High                  High                   67.6
    Sweden        78                    High                   High                  High                   105.6
    United        Unknown***            Medium***              High                  High                   Unknown
    Kingdom
* As estimated by the National Focal Points for AMR and/or the Operational Contact Points for Epidemiology/Microbiology/TESSY-
IT data manager for AMR.
Estimated population coverage: Mean population coverage (%) of laboratories capable of reporting data on Escherichia coli,
Klebsiella pneumoniae, Pseudomonas aeruginosa, Staphylococcus aureus, Enterococcus faecalis and Enterococcus faecium.
Geographical representativeness: High: All main geographical regions are covered and data are considered as representative
of the national epidemiology. Medium: Most geographical regions are covered and data are considered to provide medium
representativeness of the national epidemiology. Poor: Only a few geographical areas are covered and data are poorly
representative of the national epidemiology. Unknown: unknown or no data provided.
Hospital representativeness: High: The hospital sample is representative of the acute care hospital distribution in the country.
Medium: The hospital sample is partly representative of the acute care hospital distribution in the country. Poor: The hospital
sample is poorly representative of the acute care hospital distribution in the country. Unknown: Unknown or no data provided.
Patient and isolate representativeness: High: The isolate sample is representative of bacterial species causing invasive
infections and of patient case-mix for the hospitals included. Medium: The isolate sample is partly representative of bacterial
species causing invasive infections and of patient case-mix for the hospitals included. Poor: The isolate sample is poorly
representative of bacterial species causing invasive infections and of patient case-mix for the hospitals included. Unknown:
Unknown or no data provided.
** Not including Streptococcus pneumoniae network
*** Estimated 100% population coverage and high representativeness in Northern Ireland, Scotland and Wales.

4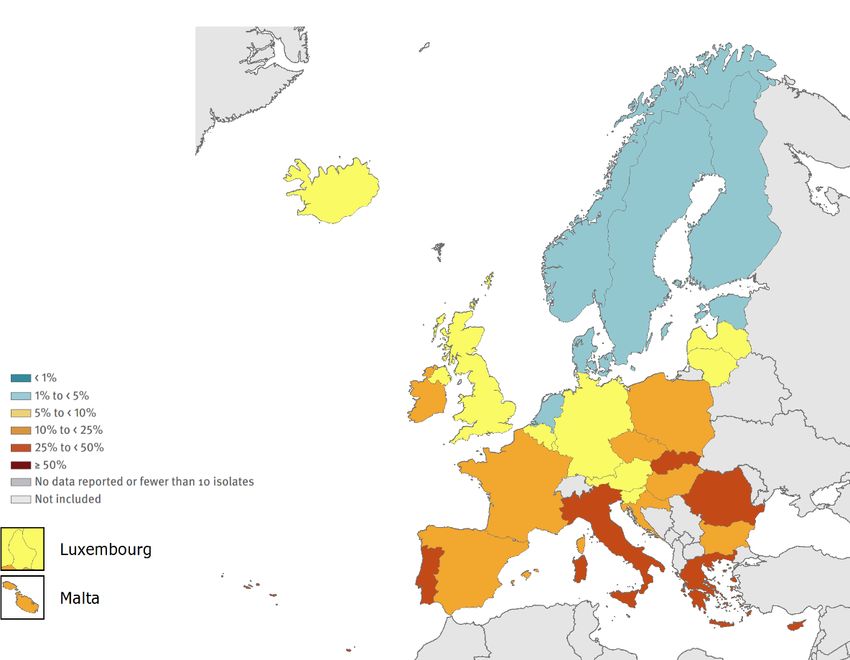
SURVEILLANCE REPORT                                                                  Antimicrobial resistance in the EU/EEA – AER 2019

Table 2. Bacterial species-antimicrobial group combinations presented in this report

 Bacterial species                  Antimicrobial group                       Antimicrobial agents
 Escherichia coli                   Aminopenicillins                          Ampicillin or amoxicillin
                                    Third-generation                          Cefotaxime, ceftriaxone or ceftazidime
                                    cephalosporins
                                    Carbapenems                               Imipenem or meropenem
                                    Fluoroquinolones                          Ciprofloxacin, levofloxacin or ofloxacin
                                    Aminoglycosides                           Gentamicin, tobramycin or netilimicin
 Klebsiella pneumoniae              Third-generation                          Cefotaxime, ceftriaxone or ceftazidime
                                    cephalosporins
                                    Carbapenems                               Imipenem or meropenem
                                    Fluoroquinolones                          Ciprofloxacin, levofloxacin or ofloxacin
                                    Aminoglycosides                           Gentamicin, tobramycin or netilimicin
 Pseudomonas aeruginosa             Piperacillin + tazobactam                 Piperacillin + tazobactam
                                    Ceftazidime                               Ceftazidime
                                    Carbapenems                               Imipenem or meropenem
                                    Fluoroquinolones                          Ciprofloxacin or levofloxacin
                                    Aminoglycosides                           Gentamicin, tobramycin or netilimicin
 Acinetobacter species              Carbapenems                               Imipenem or meropenem
                                    Fluoroquinolones                          Ciprofloxacin or levofloxacin
                                    Aminoglycosides                           Gentamicin, tobramycin or netilimicin
 Streptococcus                      Penicillins                               Oxacillin or penicillin*
 pneumoniae                         Macrolides                                Clarithromycin, erythromycin or azithromycin
                                    Fluoroquinolones                          Levofloxacin or moxifloxacin**
                                    Third-generation                          Cefotaxime or ceftriaxone
                                    cephalosporins
 Staphylococcus aureus              MRSA                                      Cefoxitin, oxacillin or molecular MRSA
                                                                              confirmation tests***
                                    Rifampicin                                Rifampin
                                    Fluoroquinolones                          Levofloxacin, ofloxacin or ciprofloxacin****
 Enterococcus faecalis              High-level aminoglycoside                 Gentamicin high-level resistance
 and                                resistance
 Enterococcus faecium               Vancomycin                                Vancomycin
* Priority is given to penicillin susceptibility test results over oxacillin results.
** Susceptibility results for norfloxacin are also accepted as marker for fluoroquinolone susceptibility. Priority is given to
levofloxacin and moxifloxacin susceptibility results over norfloxacin results.
*** Detection of the mecA gene by PCR or positive PBP2A-agglutionation test is given priority over phenotypic susceptibility
results. Reports of cloxacillin or dicloxacillin or flucloxacillin or meticillin resistance are accepted as marker for oxacillin resistance
if oxacillin is not reported.
**** Susceptibility results for norfloxacin are also accepted as marker for fluoroquinolone susceptibility. Priority is given to
ciprofloxacin, levofloxacin and/or ofloxacin susceptibility results over norfloxacin results.

                                                                                                                                              5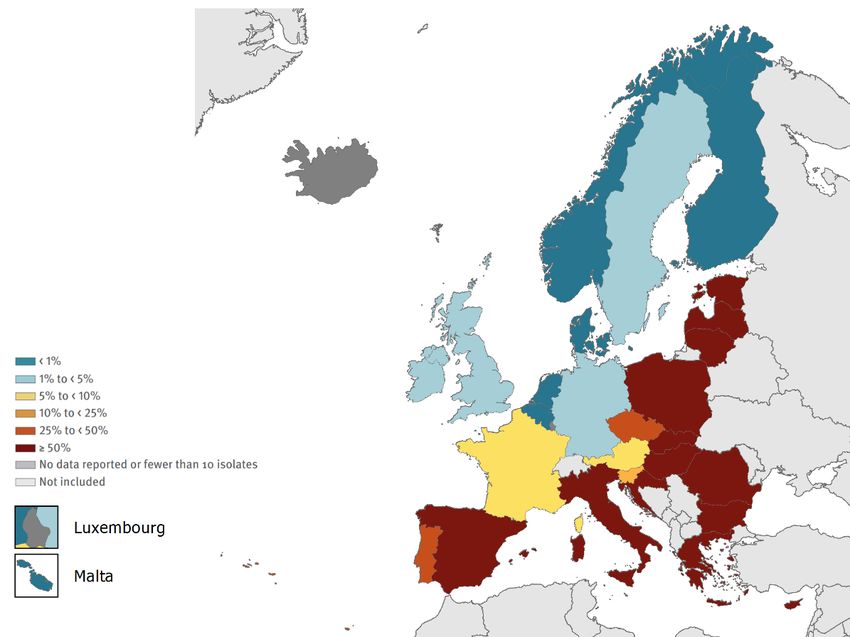
Antimicrobial resistance in the EU/EEA (EARS-Net) – AER 2019                                                SURVEILLANCE REPORT

EU/EEA overview
Epidemiology
Thirty EU/EEA countries reported data for 2019 to EARS-Net. Twenty-nine countries reported data for all eight
bacterial species under surveillance by EARS-Net (E. coli, K. pneumoniae, P. aeruginosa, Acinetobacter species,
S. pneumoniae, S. aureus, E. faecalis and E. faecium), while one country (Greece) reported data for all bacterial
species except S. pneumoniae. The most commonly reported bacterial species was E. coli (44.2%), followed by
S. aureus (20.6%), K. pneumoniae (11.3%), E. faecalis (6.8%), P. aeruginosa (5.6%), S. pneumoniae (5.3%),
E. faecium (4.5%) and Acinetobacter species (1.7%).
Country-specific results on data availability and age group, sex and ICU patient proportions are available for each bacterial
species2 , and for age group and sex for specific AMR phenotypes in the ECDC Surveillance Atlas of Infectious Diseases [1].
The AMR situation in bacterial species reported to EARS-Net for 2019 varied widely, depending on the bacterial
species, antimicrobial group (Table 3) and geographical region (Figures 1-10 and related PDF in link).
In 2019, more than half of the E. coli isolates reported to EARS-Net and more than a third of
the K. pneumoniae isolates were resistant to at least one antimicrobial group under surveillance, and combined
resistance to several antimicrobial groups was frequent. Resistance percentages were generally higher
in K. pneumoniae than in E. coli. While carbapenem resistance remained rare in E. coli, several countries reported
carbapenem resistance percentages above 10% in K. pneumoniae. Carbapenem resistance was also common
in P. aeruginosa and Acinetobacter species, and at higher percentages than in K. pneumoniae. For most gram-
negative bacteria under surveillance, changes in the EU/EEA mean resistance percentages between 2015 and 2019
were moderate, and resistance remained at previously reported high levels.
For S. aureus, the decline in the percentage of meticillin-resistant (i.e. MRSA) isolates reported in previous years
continued in 2019. Nevertheless, MRSA remains an important pathogen in the EU/EEA, with levels still high in several
countries, and combined resistance to another antimicrobial group was common. Decreases during the same period
were also noted for penicillin non-wild type and macrolide resistance percentages in S. pneumoniae.
One development of particular concern was the increase in the percentage of vancomycin-resistant isolates of
E. faecium in the EU/EEA, from 10.5% in 2015 to 18.3% in 2019 (EU/EEA population-weighted mean percentage).
For several bacterial species–antimicrobial group combinations, the reported AMR percentages varied widely between
countries, and a north-to-south and west-to-east gradient was evident. In general, the lowest AMR percentages were
reported by countries in the north of Europe whereas the highest AMR percentages were reported by countries in the
south and east of Europe. However, for vancomycin-resistant E. faecium, no distinct geographical pattern could be seen.

Discussion
The considerable variability in AMR percentages across EU/EEA countries highlights opportunities for significant AMR
reduction through investments to improve current control and prevention practices. Despite the political prioritisation
of AMR as a threat to public health and the availability of evidence-based guidance for antimicrobial stewardship,
adequate microbiological capacity and infection prevention and control, it is clear that public health action to tackle
AMR remains insufficient.
The major driver behind the occurrence and spread of AMR is the use of antimicrobial agents and transmission of
microorganisms with AMR - between humans, between animals, and between humans, animals and the environment.
While antimicrobial use exerts an ecological pressure on microorganisms and contributes to the emergence and
selection of AMR, poor infection prevention and control practices promote further spread of microorganisms with
AMR. Results from the ECDC point prevalence survey of healthcare-associated infections and antimicrobial use in
European acute care hospitals showed that the prevalence of patients receiving antibiotics was positively associated
with AMR, and conversely, antibiotic stewardship activities and resources for hospital hygiene were negatively
associated with AMR [8]. Prudent antimicrobial use and high standards for infection prevention and control in all
healthcare sectors are the cornerstones of an effective response to AMR.
AMR calls for concerted efforts at country level as well as close international cooperation. In 2017, the European
Commission adopted a European One Health Action Plan against AMR to support the EU and its Member States in
delivering innovative, effective and sustainable responses to AMR [9]. In a 2017 survey, a majority of EU/EEA
countries reported having initiated work towards establishing objectives and targets for the reduction of antibiotic use
in humans, often in the context of developing a national action plan for AMR. However, only a few countries had
published targets in 2017 [10], and a minority had identified specific funding sources to implement their national
action plans [8].

2
 A PDF containing all country summaries is available on the landing page for this report at the following link:
https://www.ecdc.europa.eu/en/publications-data/surveillance-antimicrobial-resistance-europe-2019

6
SURVEILLANCE REPORT                                                   Antimicrobial resistance in the EU/EEA – AER 2019

Public health implications
The high levels of AMR for several important bacterial species-antimicrobial group combinations reported to EARS-
Net for 2019 show that AMR remains a serious challenge in the EU/EEA. AMR is considered to be one of the
biggest threats to public health today, both globally [11] and in the EU/EEA [9]. Recent estimates based on data
from EARS-Net show that each year, more than 670 000 infections occur in the EU/EEA due to bacteria resistant to
antibiotics, and that approximately 33 000 people die as a direct consequence of these infections [12]. The related
cost to the healthcare systems of EU/EEA countries is around EUR 1.1 billion [8].
Rising proportions of AMR will be an increasing concern unless governments respond more robustly to the threat.
Further investment in public health interventions to tackle AMR are urgently needed, and would have a significant
positive impact on population health and future healthcare expenditures in the EU/EEA. It has been estimated that
a mixed intervention package including antibiotic stewardship programmes, enhanced hygiene, mass media
campaigns, and the use of rapid diagnostic tests has the potential to prevent approximately 27 000 deaths per
year in the EU/EEA. In addition to saving lives, such a public health package could pay for itself within just one
year and end up saving around EUR 1.4 billion per year in the EU/EEA [8].

                                                                                                                     7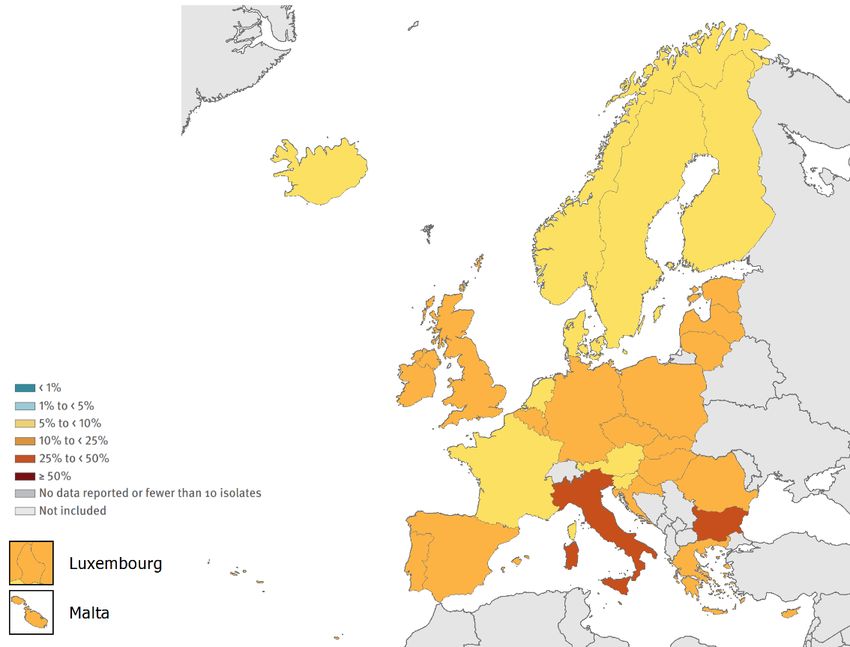
Antimicrobial resistance in the EU/EEA – AER 2019 SURVEILLANCE REPORT
Table 3. Total number of invasive isolates tested (N) and percentage of isolates with resistant phenotype (%), by bacterial species and antimicrobial group,
population-weighted EU/EEA mean, 20152019
2019
2015 2016 2017 2018 2019 Trend
Bacterial EU/EEA
Antimicrobial group 2015-
species country
N % N % N % N % N % 2019**
range*
Aminopenicillin (amoxicillin/ampicillin) resistance 79 507 58.9 108 239 59.0 125 866 58.7 133 700 57.5 129 576 57.1 35.5-71.7 ↓
Third-generation cephalosporin
91 822 14.6 123 944 14.9 140 584 14.9 152 720 15.1 156 887 15.1 6.2-38.6 ↑#
(cefotaxime/ceftriaxone/ceftazidime) resistance
Carbapenem (imipenem/meropenem) resistance 88 020 0.2 122 437 0.1 140 438 0.1 151 457 0.1 155 841 0.3 0.0-1.6 ↑
Escherichia Fluoroquinolone (ciprofloxacin/levofloxacin/ofloxacin)
coli 91 832 24.8 125 161 25.2 141 562 25.7 154 698 25.3 160 692 23.8 11.3-43.5 ↓
resistance
Aminoglycoside (gentamicin/netilmicin/tobramycin)
91 746 11.6 124 480 11.6 141 788 11.4 154 266 11.1 160 406 10.8 4.7-24.4 ↓
resistance
Combined resistance to third-generation
cephalosporins, fluoroquinolones, and 89 780 6.3 121 582 6.4 135 108 6.3 148 206 6.2 153 818 5.9 0.4-19.0 ↓
aminoglycosides
Third-generation cephalosporin
22 801 31.1 30 633 31.4 32 969 31.2 38 436 31.7 40 764 31.3 4.3-75.7
(cefotaxime/ceftriaxone/ceftazidime) resistance
Carbapenem (imipenem/meropenem) resistance 22 063 6.8 30 309 7.4 32 960 7.1 38 140 7.5 40 430 7.9 0.0-58.3 ↑
Klebsiella Fluoroquinolone (ciprofloxacin/levofloxacin/ofloxacin)
22 707 30.1 30 769 30.3 32 924 31.5 38 770 31.6 41 330 31.2 4.3-66.9 ↑#
pneumoniae resistance
Aminoglycoside (gentamicin/netilmicin/tobramycin)
22 650 24.2 30 209 24.4 33 136 24.1 38 555 22.7 41 195 22.3 3.5-57.3 ↓
resistance
Combined resistance to fluoroquinolones, third-
22 220 19.7 29 589 20.6 31 613 20.5 37 402 19.5 39 983 19.3 0.0-53.1 ↓
generation cephalosporins and aminoglycosides
Piperacillin + tazobactam resistance 12 498 18.1 15 125 17.5 16 428 16.7 18 607 16.8 19 355 16.9 2.3-52.8 ↓
Ceftazidime resistance 12 498 15.4 15 219 14.4 16 512 14.7 18 960 14.1 19 849 14.3 3.5-52.2 ↓#
Carbapenem (imipenem/meropenem) resistance 12 840 19.3 15 573 18.2 17 109 17.4 19 233 17.2 20 127 16.5 0.0-55.4 ↓
Pseudomonas
aeruginosa Fluoroquinolone (ciprofloxacin/levofloxacin) resistance 12 803 20.9 15 504 18.8 16 951 20.2 19 211 19.7 20 273 18.9 4.5-52.2 ↓#
Aminoglycoside (gentamicin/netilmicin/tobramycin)
12 825 15.3 15 525 14.0 16 979 13.2 19 186 11.8 20 109 11.5 0.3-48.9 ↓
resistance
Combined resistance to >3 antimicrobial groups
(among piperacillin + tazobactam, ceftazidime, 12 863 14.6 15 628 13.4 17 129 13.0 19 306 12.6 20 296 12.1 0.0-49.7 ↓
carbapenems, fluoroquinolones and aminoglycosides)
Carbapenem (imipenem/meropenem) resistance 5 057 32.1 5 590 32.6 6 186 33.1 6 526 31.9 5 953 32.6 0.0-92.3
Acinetobacter Fluoroquinolone (ciprofloxacin/levofloxacin) resistance 5 032 38.5 5 596 37.5 6 098 37.4 6 496 36.2 5 918 36.9 0.0-95.8 ↓
species
Aminoglycoside (gentamicin/netilmicin/tobramycin)
5 003 32.4 5 562 32.7 6 042 32.2 6 459 31.3 5 909 33.0 0.0-92.1
resistance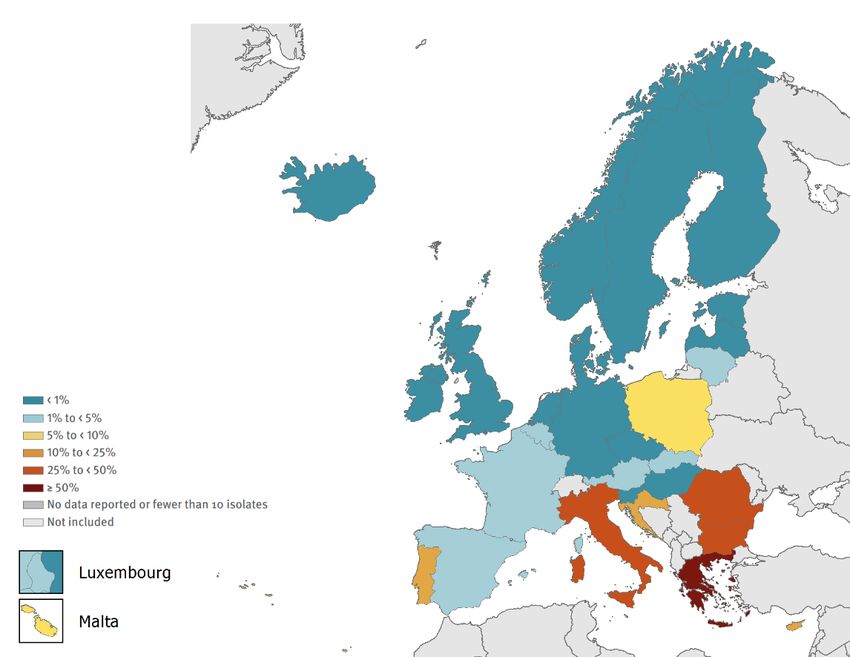
SURVEILLANCE REPORT Antimicrobial resistance in the EU/EEA – AER 2019
2019
2015 2016 2017 2018 2019 Trend
Bacterial EU/EEA
Antimicrobial group 2015-
species country
N % N % N % N % N % 2019**
range*
Combined resistance to carbapenems,
4 908 27.6 5 418 28.3 5 872 28.2 6 294 28.3 5 677 29.7 0.0-91.4 ↑#
fluoroquinolones and aminoglycosides
Staphylococcus
MRSA 46 173 19.0 57 730 17.7 66 279 16.8 72 882 16.4 73 808 15.5 1.1-46.7 ↓
aureus
Penicillin non-wild-type*** 12 178 14.2 15 666 13.1 17 212 12.9 18 676 12.9 18 112 12.1 4.0-33.3 ↓
Streptococcus Macrolide (erythromycin/clarithromycin/azithromycin)
12 659 16.6 16 027 16.6 17 613 15.7 19 217 15.2 18 832 14.5 3.5-30.4 ↓
pneumoniae resistance
Combined penicillin non-wild-type and resistance to
11 684 8.5 15 182 8.4 16 584 8.2 17 811 7.8 17 420 7.2 1.3-20.0 ↓
macrolides
Enterococcus
High-level gentamicin resistance 10 887 31.9 12 910 31.8 13 930 29.7 15 343 27.1 13 368 26.6 0.0-44.1 ↓
faecalis
Enterococcus
Vancomycin resistance 9 336 10.5 12 511 12.3 14 213 14.9 15 992 17.3 16 432 18.3 0.0-50.0 ↑
faecium
* Indicates the lowest and the highest national resistance percentage among reporting EU/EEA countries
** ↑ and ↓ indicate statistically significant increasing and decreasing trends, respectively. # indicates a significant trend in the overall data, but that no trend was detected in data which only
included laboratories that reported continuously for all five years.
*** In this report, the term penicillin non-wild-type refers to S. pneumoniae isolates reported by local laboratories as ‘susceptible, increased exposure’ (I) or resistant (R) to penicillin, assuming MICs to
benzylpenicillin above those of the wild-type isolates (i.e. >0.06 mg/L). The analysis is based on the qualitative susceptibility categories S, I and R as quantitative susceptibility information was missing for a
large part of the data. It should be understood that laboratories not using EUCAST clinical breakpoints during the period 20152018 might define the cut-off values for the susceptibility categories
differently.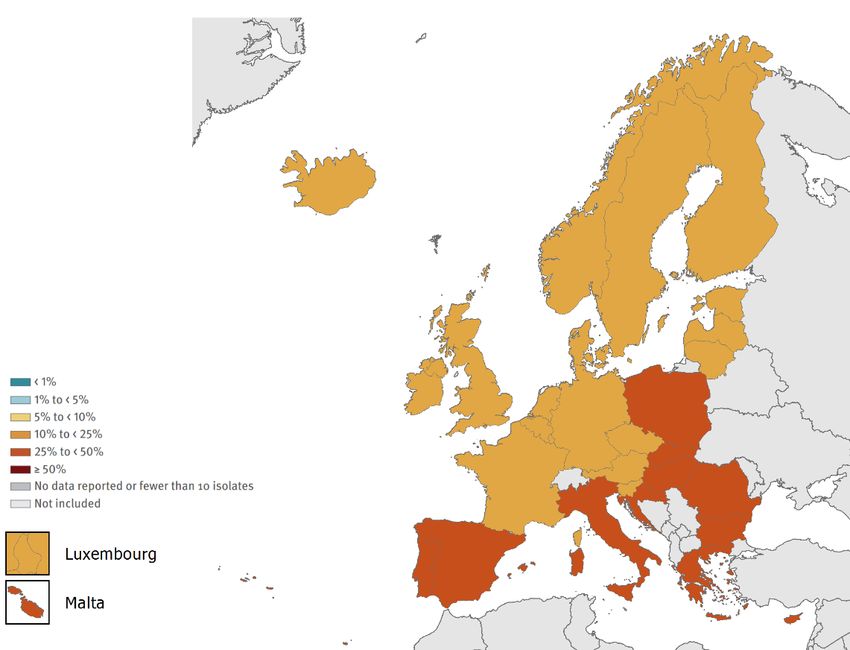
Antimicrobial resistance in the EU/EEA – AER 2019 SURVEILLANCE REPORT
Bacterial species-specific results
Escherichia coli
Epidemiology
For 2019, 30 EU/EEA countries reported 163 005 isolates of Escherichia coli. Of these, 129 576 (79%) isolates had
AST results for aminopenicillins, 156 887 (96%) isolates had AST results for third-generation cephalosporins,
160 692 (99%) isolates had AST results for fluoroquinolones, 160 406 (98%) isolates had AST results for
aminoglycosides, and 155 841 (96%) isolates had AST results for carbapenems (Table 3).
At the EU/EEA level, more than half (57.1%) of the E. coli isolates reported to EARS-Net for 2019 were resistant to at
least one of the antimicrobial groups under surveillance (i.e. aminopenicillins, fluoroquinolones, third-generation
cephalosporins, aminoglycosides and carbapenems) (Table 4). In 2019, the highest EU/EEA population-weighted mean
resistance percentage was reported for aminopenicillins (57.1%), followed by fluoroquinolones (23.8%), third-generation
cephalosporins (15.1%) and aminoglycosides (10.8%). Resistance to carbapenems remained rare (0.3%) (Table 3).
Between 2015 and 2019, there were significantly increasing trends in the EU/EEA population-weighted mean
percentages for third-generation cephalosporin resistance and carbapenem resistance, while the EU/EEA trends for
aminopenicillin resistance, fluoroquinolone resistance and aminoglycoside resistance decreased significantly during
the same period. When restricting the analysis to only include the laboratories that consistently reported data for all
five years, all trends remained significant, with the exception of third-generation cephalosporin resistance (Table 3).
Resistance to multiple antimicrobial groups was common. Among the resistant phenotypes, resistance to aminopenicillins,
both as single resistance or in combination with other antimicrobial groups, was the most common at the EU/EEA level
(Table 4). In 2019, the percentage of combined resistance, measured as resistance to fluoroquinolones, third-generation
cephalosporins and aminoglycosides, was 5.9% (EU/EEA population-weighted mean) and this had shown a small, but
statistically significant, decreasing trend during the period 20152019 (Table 3).
With the exception of carbapenem resistance, large inter-country variations were noted for all antimicrobial groups
under surveillance (Table 3), with generally higher resistance percentages reported from southern and eastern
Europe than from northern Europe (Figure 1, Figure 2, Figure 3 and related PDF link – footnote 1).
Table 4. Escherichia coli. Total number of invasive isolates tested (n: 118 399)* and percentage
resistance (%) per phenotype, EU/EEA, 2019
Resistance pattern Number of % of total**
isolates
Fully susceptible 50 797 42.9
Single resistance (to indicated antimicrobial group)
Total (all single resistance) 41 146 34.8
Aminopenicillins 37 854 32.0
Fluoroquinolones 2 783 2.4
Other antimicrobial groups 509 0.4
Resistance to two antimicrobial groups
Total (all two-group combinations) 12 456 10.5
Aminopenicillins + fluoroquinolones 7 073 6.0
Aminopenicillins + third-generation cephalosporins 2 986 2.5
Aminopenicillins + aminoglycosides 2 190 1.8
Other antimicrobial group combinationsa 207 0.2
Resistance to three antimicrobial groups
Total (all three-group combinations) 8 620 7.3
Aminopenicillins + third-generation cephalosporins + fluoroquinolones 5 454 4.6
Aminopenicillins + fluoroquinolones + aminoglycosides 2 468 2.1
Other antimicrobial group combinationsa 698 0.6
Resistance to four antimicrobial groups
Total (all four-group combinations) 5 348 4.5
Aminopenicillins + third-generation cephalosporins + fluoroquinolones + aminoglycosides 5 305 4.5
Other antimicrobial group combinationsa 43SURVEILLANCE REPORT Antimicrobial resistance in the EU/EEA – AER 2019
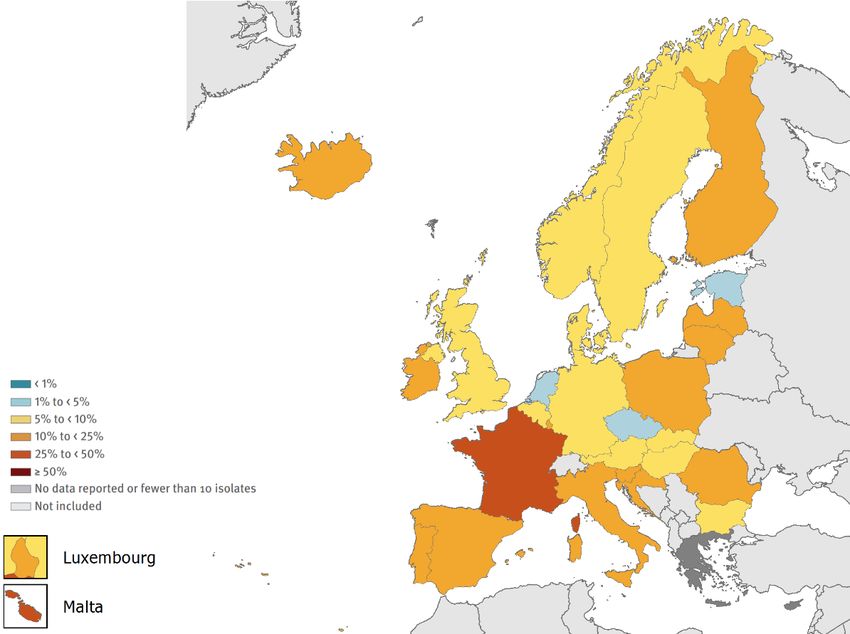
Figure 1. Escherichia coli. Percentage of invasive isolates resistant to fluoroquinolones (ciprofloxacin
or/and levofloxacin or/and ofloxacin), by country, EU/EEA, 2019
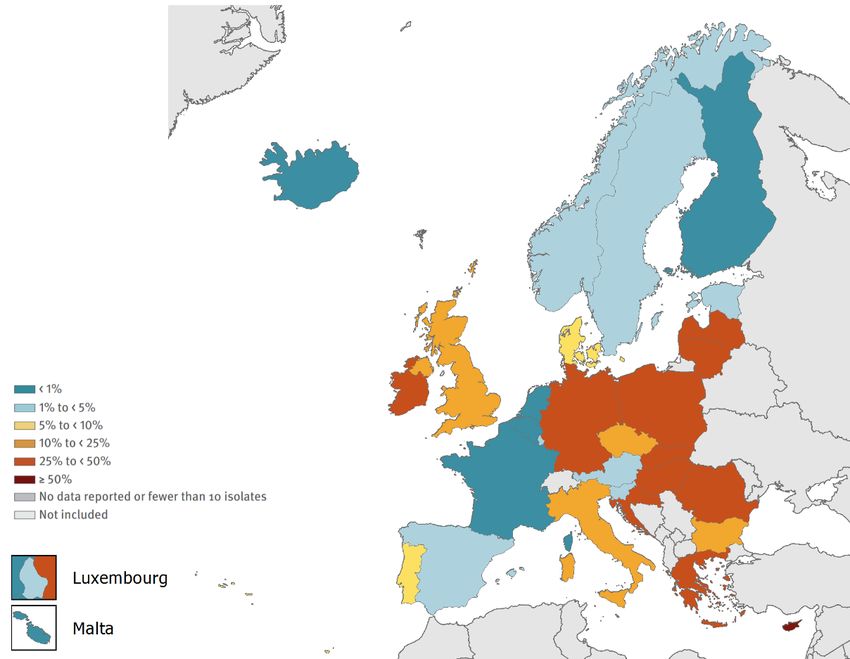
Figure 2. Escherichia coli. Percentage of invasive isolates resistant to third-generation
cephalosporins (cefotaxime or/and ceftriaxone or/and ceftazidime), by country, EU/EEA, 2019
11Antimicrobial resistance in the EU/EEA (EARS-Net) – AER 2019 SURVEILLANCE REPORT Figure 3. Escherichia coli. Percentage of invasive isolates resistant to carbapenems (imipenem or/and meropenem), by country, EU/EEA, 2019 Discussion E. coli is a major cause of bloodstream infection in Europe, and prompt access to effective antimicrobial treatment is essential to reduce the health-related and economic burden caused by these infections. Infections caused by antimicrobial-resistant E. coli proportionally contribute most to the burden of AMR in the EU/EEA, both in terms of the number of cases and the number of attributable deaths [12]. As resistant E. coli commonly occur in the community, interventions to reduce the burden of these infections should not be restricted to hospital settings, but should also target primary and community care. Time series analyses of EU/EEA population-weighted means for third-generation cephalosporin resistance and fluoroquinolone resistance in E. coli reported to EARS-Net for the years 2002 to 2018 have shown that although resistance percentages increased substantially during the period, the increase was most prominent up until around 2012. After this, the increase was less pronounced [13]. This was confirmed for the five-year period presented in this report (20152019). There was no significant EU/EEA trend for third-generation cephalosporin resistance if only those laboratories that had continuously reported were included. Meanwhile, there was a small, but statistically significant, decreasing EU/EEA trend for fluoroquinolone resistance. Nevertheless, percentages of AMR reported for 2019 were comparatively much higher than in 2002, highlighting the need for further efforts to improve antimicrobial stewardship and infection prevention and control. Use of broad-spectrum antimicrobials is a known risk factor for the colonisation and spread of antimicrobial- resistant Enterobacterales, including E. coli. Associations between national resistance percentages in E. coli and national antimicrobial consumption rates, in both the hospital and community sector, have been reported [14]. The latest data from the European Surveillance of Antimicrobial Consumption Network (ESAC-Net) show large inter-country variations in the use of broad-spectrum antimicrobials [15], indicating a need for increased focus on antimicrobial stewardship [16] and the potential for further reductions in antimicrobial consumption. As high resistance levels have been reported in E. coli isolates from food-producing animals in Europe, including the rare occurrence of isolates with carbapenemase production [17], ensuring cross-sectoral collaboration between the human, veterinary and food production sectors is essential. This work is underpinned by the European Commission’s ‘One Health’ approach, which addresses resistance in both humans and animals. ECDC is working closely with the European Food Safety Authority (EFSA) and the European Medicines Agency (EMA) to better understand the interrelationships between antimicrobial use and antimicrobial resistance in humans and animals across Europe. 12
SURVEILLANCE REPORT                                                     Antimicrobial resistance in the EU/EEA – AER 2019

Although carbapenem-resistant isolates remained rare among the invasive E. coli isolates included in EARS-Net,
there was a small but significant increase in the EU/EEA population-weighted mean between 2015 and 2019. A
further increase in invasive infections caused by carbapenem-resistant E. coli would have severe consequences on
the burden of AMR in the EU/EEA. Carbapenem-resistant Enterobacterales (CRE) infections are associated with
high mortality, primarily due to delays in the administration of effective treatment and the limited availability of
treatment options. The September 2019 update of ECDC’s rapid risk assessment on CRE highlights the need for
high standards in infection prevention and control, combined with adequate microbiological capacity to detect and
prevent further spread [18].
Carbapenem resistance is most often mediated by a range of carbapenemases, which may in some cases confer
resistance to virtually all available beta-lactam antibacterial drugs. However, there are carbapenemase-producing
isolates that test susceptible to meropenem and/or imipenem, based on clinical breakpoints. One example is OXA-
244-producing E. coli that might be classified only as ESBL-producing instead of carbapenemase-producing E. coli,
unless specifically tested for OXA-48-like carbapenemases. A recent ECDC risk assessment on OXA-244-producing
E. coli [19] indicated a pan-European problem, with a high risk of further spread of OXA-244-producing E. coli in
the EU/EEA, given the rapid and simultaneous increase in multiple countries between 2013 and 2020. There is a
risk that transmission of OXA-244-producing E. coli in the community may contribute to the loss of carbapenems
as options for treatment of E. coli infections, and therefore there is an urgent need for further investigation to
determine the source and routes of transmission for these.
To address the need for enhanced CRE surveillance and complement the phenotypic-based surveillance data
available from EARS-Net, a Carbapenem- and/or Colistin-Resistant Enterobacterales (CCRE) survey has been
incorporated into EURGen-Net for the period 2018 to 2020 [20]. The results of this survey will provide information
on the prevalence and distribution of carbapenemases, and contribute to a better understanding of the
epidemiology of CRE in Europe and the risk factors associated with CRE infections.

                                                                                                                     13
Antimicrobial resistance in the EU/EEA (EARS-Net) – AER 2019 SURVEILLANCE REPORT
Klebsiella pneumoniae
Epidemiology
For 2019, 30 EU/EEA countries reported 41 814 isolates of Klebsiella pneumoniae. Of these, 40 764 (97%) isolates
had AST results for third-generation cephalosporins, 41 330 (99%) isolates had AST results for fluoroquinolones,
41 195 (99%) isolates had AST results for aminoglycosides and 40 430 (97%) isolates had AST results for
carbapenems (Table 3).
At the EU/EEA level, more than a third (36.6%) of the K. pneumoniae isolates reported to EARS-Net for 2019 were
resistant to at least one of the antimicrobial groups under surveillance (i.e. fluoroquinolones, third-generation
cephalosporins, aminoglycosides and carbapenems) (Table 5). In 2019, the highest EU/ EEA population-weighted
mean resistance percentage was reported for third-generation cephalosporins (31.3%), followed by
fluoroquinolones (31.2%), aminoglycosides (22.3%) and carbapenems (7.9%) (Table 3).
Between 2015 and 2019, there were significantly increasing trends in the EU/EEA population-weighted mean
percentages for carbapenem resistance and fluoroquinolone resistance, while the EU/EEA trend for aminoglycoside
resistance decreased significantly during the same period. With the exception of fluoroquinolone resistance, all
EU/EEA trends remained significant when restricting the analysis to include only those laboratories that
consistently reported data (Table 3).
Single resistance was less commonly reported than resistance to two or more antimicrobial groups, with the most
common resistance phenotype being combined resistance to fluoroquinolones, third-generation cephalosporins
and aminoglycosides (Table 5). The EU/EEA population-weighted mean for combined resistance to
fluoroquinolones, third-generation cephalosporins and aminoglycosides was 19.3% in 2019, and showed a small,
but statistically significant, decreasing trend during the period 20152019 (Table 3).
Large inter-country variations could be noted for all antimicrobial groups under surveillance (Table 3), with generally
higher resistance percentages reported from southern and eastern Europe than from northern Europe (Figure 4, Figure
5 and related PDF link – footnote 1). The countries reporting the highest percentages of carbapenem resistance in
K. pneumoniae were also among those reporting the highest resistance percentages for the other antimicrobial groups.
Table 5. Klebsiella pneumoniae. Total number of invasive isolates tested (n: 39 025)* and
percentage resistance (%) per phenotype, EU/EEA, 2019
Number of % of
Resistance pattern
isolates total**
Fully susceptible 24 738 63.4
Single resistance (to indicated antimicrobial group)
Total (all single resistance) 3 119 8.0
Fluoroquinolones 1 542 4.0
Third-generation cephalosporins 1 313 3.4
Other antimicrobial groupsa 264 0.7
Resistance to two antimicrobial groups
Total (all two-group combinations) 3 152 8.1
Third-generation cephalosporins + fluoroquinolones 2 148 5.5
Third-generation cephalosporins + aminoglycosides 546 1.4
Fluoroquinolones + aminoglycosides 369 0.9
Other antimicrobial group combinationsa 89 0.2
Resistance to three antimicrobial groups
Total (all three-group combinations) 6 090 15.6
Third-generation cephalosporins + fluoroquinolones + aminoglycosides 5 018 12.9
Third-generation cephalosporins + fluoroquinolones + carbapenems 996 2.6
Other antimicrobial group combinations a 76 0.2
Resistance to four antimicrobial groups
Third-generation cephalosporins + fluoroquinolones + aminoglycosides + carbapenems 1 926 4.9
* Only isolates with complete susceptibility information for fluoroquinolones (ciprofloxacin and/or levofloxacin and/or ofloxacin), third-generation
cephalosporins (cefotaxime and/or ceftriaxone and/or ceftazidime), aminoglycosides (gentamicin, tobramycin and/or netilimicin) and carbapenems
(imipenem and/or meropenem) were included in the analysis. This represented 93% of all reported K. pneumoniae isolates.
** Not adjusted for population differences in the reporting countries.
a
Only resistance combinations >1% of the total are specified.
14SURVEILLANCE REPORT Antimicrobial resistance in the EU/EEA – AER 2019
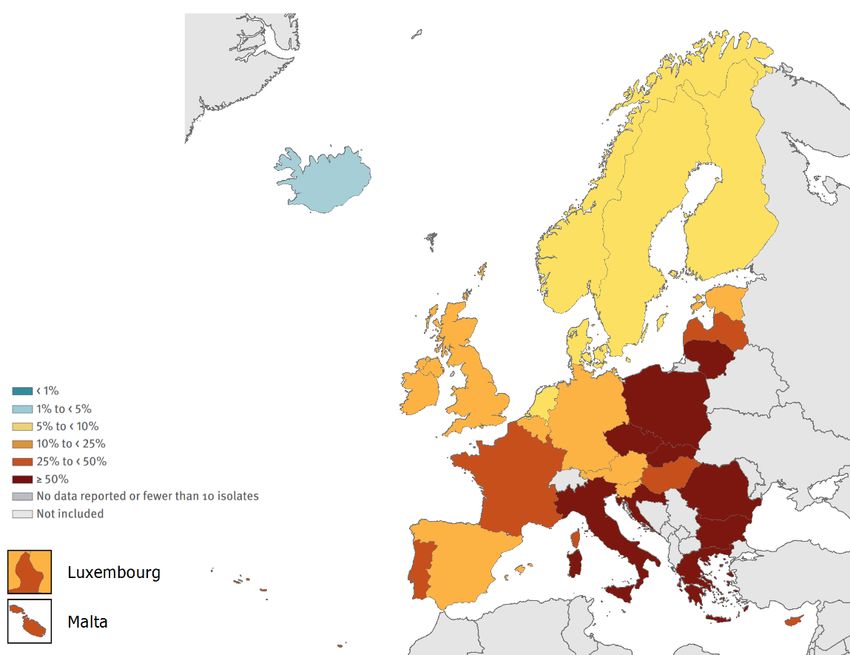
Figure 4. Klebsiella pneumoniae. Percentage of invasive isolates resistant to third-generation
cephalosporins (cefotaxime or/and ceftriaxone or/and ceftazidime), by country, EU/EEA, 2019
Figure 5. Klebsiella pneumoniae. Percentage of invasive isolates resistant to carbapenems
(imipenem or/and meropenem), by country, EU/EEA, 2019
Discussion
The resistance situation in K. pneumoniae in the EU/EEA remains problematic. Although the annual increase in the
EU/EEA population-weighted mean carbapenem resistance percentage during the last five years was more moderate than
in the previous periods, it has increased more than seven-fold since 2006 [13]. For several individual EU/EEA countries,
most notably in the south and south-central parts of Europe, the increase has been substantially larger [1]. Carbapenem
resistance was almost always combined with resistance to several other key antimicrobial groups, leading to a severely
15Antimicrobial resistance in the EU/EEA (EARS-Net) – AER 2019 SURVEILLANCE REPORT limited range of treatment options for invasive infections caused by this type of bacteria. ECDC’s study on the health burden of AMR concluded that even in countries with lower levels of carbapenem-resistant K. pneumoniae, the impact of AMR on the national health burden is significant because of the high attributable mortality of these infections [12]. This underlines the need for continuous close monitoring and greater efforts to efficiently respond to this public health threat. The highest percentages of carbapenem resistance observed in south and south-eastern Europe have also been reflected in other European surveillance initiatives, such as the ECDC point prevalence survey of healthcare-associated infections and antimicrobial use in European acute care hospitals [21] and EURGen-Net [22]. Results from these initiatives also show that the situation in EU/EEA countries has deteriorated in recent years with regard to the epidemiological stage and incidence of these infections. Numerous reports on outbreaks and examples of cross-border spread of CRE demonstrate the transmission potential in EU/EEA healthcare systems [23-25]. Outbreaks in EU/EEA countries have also highlighted the importance of early detection of CRE in settings with low incidence, due to their high transmissibility [22-27]. CRE can be resistant to carbapenems as a result of various mechanisms, but most frequently through production of carbapenemase enzymes. It is not possible to assess the overall presence and spread of carbapenemase-producing Enterobacterales through the data available from EARS-Net, as some carbapenemases do not confer a fully carbapenem-resistant phenotype. One example is the OXA-48-like carbapenemase enzymes, presenting a particular problem for laboratory detection because of their weak hydrolysing capacity of carbapenems [23]. This is partly reflected by the substantially higher percentages of K. pneumoniae isolates reported as ‘susceptible, increased exposure’ (I) than reported as ‘resistant’ (R) in some EU/EEA countries [1]. Although Klebsiella pneumoniae carbapenemase (KPC) still plays an important role among the carbapenemases produced by K. pneumoniae, recent outbreaks of carbapenemase (NDM-1 and OXA-48)-producing and colistin-resistant K. pneumoniae have highlighted the concomitant increase in virulence, transmissibility and antimicrobial resistance among certain K. pneumoniae strains, which pose a considerably higher risk to human health than was previously the case with the broader K. pneumoniae population. Early detection of such strains and close cooperation between clinicians and public health services is crucial to avoid spread among the patient population in the EU/EEA. There is a need for increased capacity in the EU/EEA to support outbreak investigations and surveillance with real-time whole genome sequencing to identify high-risk clones and to implement enhanced control measures to avoid further spread [26-27]. One initiative addressing this need is the Carbapenem and/or Colistin-Resistant Enterobacterales (CCRE) survey (as part of EURGen-Net) that will provide updated and more detailed information on the distribution of carbapenemase- producing K. pneumoniae in Europe [20]. As highlighted in the September 2019 update of ECDC’s rapid risk assessment on CRE, options for action include timely and appropriate diagnosis, high standards of infection prevention and control, and antimicrobial stewardship [18]. In recent years, many EU/EEA countries have developed and implemented recommendations and guidance documents on multidrug-resistant Enterobacterales and/or CRE [28], indicating a trend towards nationally coordinated responses to this public health threat. In 2017, to support countries, ECDC published a guidance document on how to prevent the entry and spread of CRE into healthcare settings. The guidance outlines evidence-based best practices for the prevention of CRE, including measures for intervention that can be adopted or adapted to local needs, depending on the availability of financial and structural resources [29]. Colistin is frequently being used to treat CRE infections, but colistin resistance may develop during treatment. The transferable plasmid-mediated colistin resistance genes that can transmit colistin resistance more easily between bacteria further increase the risk for spread of colistin resistance [30]. Colistin resistance poses a substantial public health risk to the EU/EEA because it further limits treatment options in patients with infections caused by multidrug- resistant gram-negative bacteria, including CRE. The distribution of colistin resistance is difficult to assess through EARS- Net, as colistin susceptibility testing is generally not part of the initial routine AST panel for Enterobacterales, being performed instead at national level after referral of multidrug-resistant isolates to a reference laboratory. In addition, colistin susceptibility testing is methodologically challenging, substantially reducing the quality of results from agar dilution, disk diffusion and gradient diffusion. A joint EUCAST and CLSI sub-committee has issued recommendations confirming that broth microdilution is so far the only valid method for colistin susceptibility testing [31]. A survey among EARS-Net participating laboratories in 2017 showed that a majority of the local laboratories that responded did not test for colistin susceptibility locally, or used methods that are not recommended by EUCAST (unpublished data, ECDC/UK NEQAS). This has led to the conclusion that data sources other than EARS-Net are needed for colistin susceptibility surveillance until local laboratory capacity has improved. To better understand the capacity for colistin susceptibility testing and the distribution of colistin-resistant Enterobacterales in Europe, ECDC has included colistin in the surveillance panel of the CCRE survey. This survey includes a capacity building component for reference laboratories, which will hopefully also improve diagnostic capacity at the local level [20]. WHO sees a critical need for research and the development of new antibiotics targeting third-generation cephalosporin- and carbapenem-resistant Enterobacterales, including K. pneumoniae and E. coli [32]. 16
SURVEILLANCE REPORT                                                                         Antimicrobial resistance in the EU/EEA – AER 2019

Pseudomonas aeruginosa
Epidemiology
For 2019, 30 EU/EEA countries reported 20 536 isolates of Pseudomonas aeruginosa. Of these, 19 355 (94%)
isolates had AST results for piperacillin+tazobactam, 19 849 (97%) isolates had AST results for ceftazidime,
20 273 (99%) isolates had AST results for fluoroquinolones, 20 109 (98%) isolates had AST results for
aminoglycosides and 20 127 (98%) isolates had AST results for carbapenems (Table 3).
In the EU/EEA, 31.8 % of the P. aeruginosa isolates reported to EARS-Net for 2019 were resistant to at least one
of the antimicrobial groups under surveillance (i.e. piperacillin+tazobactam, fluoroquinolones, ceftazidime,
aminoglycosides and carbapenems) (Table 6). The highest EU/EEA population-weighted mean resistance
percentage in 2019 was reported for fluoroquinolones (18.9%), followed by piperacillin + tazobactam (16.9%),
carbapenems (16.5%), ceftazidime (14.3%) and aminoglycosides (11.5%) (Table 3).
Between 2015 and 2019, EU/EEA trends decreased significantly for all antimicrobial groups under surveillance.
When restricting the analysis to include only the laboratories that consistently reported data for all five years, the
trends for piperacillin+tazobactam resistance, carbapenem resistance and aminoglycoside resistance remained
statistically significant (Table 3).
Resistance to two or more antimicrobial groups was common and seen in 17.6% of all tested isolates (Table 6).
Between 2015 and 2019, the EU/EEA population-weighted mean percentage of combined resistance, defined as
resistance to at least three of the antimicrobial groups under surveillance, significantly decreased from 14.6% to
12.1% (Table 3). Large inter-country variations could be noted for all antimicrobial groups (Table 3), with generally
higher resistance percentages reported from southern and eastern Europe than northern Europe (Figure 6 and related
PDF link – footnote 1).
Table 6. Pseudomonas aeruginosa. Total number of invasive isolates tested (n: 18 416)* and
percentage resistance (%) per phenotype, EU/EEA, 2019
                                                                                                            Number of                % of
    Resistance pattern
                                                                                                             isolates               total**
    Fully susceptible (to tested antibiotics)                                                                 12 735                 69.2
    Single resistance (to indicated antimicrobial group)
    Total (all single resistance types)                                                                        2 434                  13.2
    Fluoroquinolones                                                                                            961                    5.2
    Carbapenems                                                                                                 759                    4.1
    [Piperacillin+tazobactam]                                                                                   309                    1.7
    Aminoglycosides                                                                                             267                    1.4
    Ceftazidime                                                                                                 138                    0.7
    Resistance to two antimicrobial groups
    Total (all two groups combinations)                                                                        1 405                   7.6
    [Piperacillin+tazobactam] + ceftazidime                                                                     657                    3.6
    Fluoroquinolones + carbapenems                                                                              243                    1.3
    Other antimicrobial group combinations a                                                                    505                    2.7
    Resistance to three antimicrobial groups
    Total (all three group combinations)                                                                         710                   3.9
    [Piperacillin+tazobactam] + ceftazidime + carbapenems                                                        198                   1.1
    Other antimicrobial group combinationsa                                                                      512                   2.8
    Resistance to four antimicrobial groups
    Total (all four group combinations)                                                                          510                   2.8
    [Piperacillin+tazobactam] + fluoroquinolones + ceftazidime + carbapenems                                     191                   1.0
    Other antimicrobial group combinations a                                                                     319                   1.7
    Resistance to five antimicrobial groups
    [Piperacillin+tazobactam] + fluoroquinolones + ceftazidime + aminoglycosides +                               622                   3.4
    carbapenems
* Only isolates with complete susceptibility information for at least three antimicrobial groups among piperacillin + tazobactam, fluoroquinolones
(ciprofloxacin and/or levofloxacin), ceftazidime, aminoglycosides (gentamicin, tobramycin and/or netilmicin) and carbapenems (imipenem and/or
meropenem) were included in the analysis. This represented 90% (18 416/20 536) of all reported P. aeruginosa isolates.
** Not adjusted for population differences in the reporting countries.
a
    Only resistance combinations >1% of the total are specified.

                                                                                                                                                 17
Antimicrobial resistance in the EU/EEA (EARS-Net) – AER 2019 SURVEILLANCE REPORT Figure 6. Pseudomonas aeruginosa. Percentage of invasive isolates with resistance to carbapenems (imipenem or/and meropenem), by country, EU/EEA, 2019 Discussion EARS-Net data showed that at the EU/EEA level, small but significantly decreasing trends in resistance were noted for P. aeruginosa for several antimicrobial groups under surveillance during the period 2015 to 2019. Nevertheless, high resistance percentages and combined resistance persisted in many countries, especially in the eastern and south-eastern parts of Europe. As P. aeruginosa is intrinsically resistant to many antimicrobial agents, additional acquired resistance is further complicating the treatment of P. aeruginosa infections. The public health implications of AMR in P. aeruginosa should not be neglected, as P. aeruginosa remains one of the major causes of healthcare-associated infection in Europe [21,33-34]. P. aeruginosa and Acinetobacter species bloodstream infections are proportionally far more commonly reported from some EU/EEA countries than others [1]. A recent analysis based on EARS-Net data highlighted that countries reporting high proportions of P. aeruginosa and Acinetobacter-species bloodstream infections among all reported bloodstream infections were also those where the percentage of isolates with acquired resistance in gram-negative bacteria was generally highest [35]. This finding is probably attributed to shared risk factors, such as a higher consumption of broad- spectrum antimicrobials [15] and sub-standard infection prevention and control measures in healthcare (e.g. lower consumption of alcohol-based hand rub, lower proportions of beds in single rooms and less staff in infection control teams) for these countries [21]. Addressing these factors will probably have a positive impact on both the burden of infections caused by bacteria with high levels of intrinsic resistance, such as P. aeruginosa and Acinetobacter species, and on the burden caused by bacteria with acquired resistance. 18
SURVEILLANCE REPORT                                                                      Antimicrobial resistance in the EU/EEA – AER 2019

Acinetobacter species
Epidemiology
For 2019, 30 EU/EEA countries reported 6 113 isolates of Acinetobacter species. Of these, 5 918 (97%) isolates
had AST results for fluoroquinolones, 5 909 (97%) isolates had AST results for aminoglycosides and 5 953 (97%)
isolates had AST results for carbapenems (Table 3).
More than half (53.4%) of the Acinetobacter species isolates reported by EU/EEA countries to EARS-Net for 2019
were resistant to at least one of the antimicrobial groups under surveillance (i.e. fluoroquinolones,
aminoglycosides and carbapenems) (Table 7). The highest EU/EEA population-weighted mean resistance
percentage in 2019 was reported for fluoroquinolones (36.9%), followed by aminoglycosides (33.0%) and
carbapenems (32.6%) (Table 3).
Between 2015 and 2019, the EU/EEA trend for fluoroquinolone resistance decreased significantly (Table 3).
Resistance to one or two antimicrobial groups was considerably less common than combined resistance to all
three groups under surveillance (Table 7). Between 2015 and 2019, the EU/EEA population-weighted mean
percentage for combined resistance to fluoroquinolones, aminoglycosides and carbapenems significantly increased
from 27.6% to 29.7%, however this trend did not remain statistically significant when restricting the analysis to
include only the laboratories that consistently reported data for all five years (Table 3).
Large inter-country variations could be noted for all antimicrobial groups (Table 3), with generally higher
resistance percentages reported from southern and eastern Europe than northern Europe (Figure 7 and related
PDF link – footnote 1).
Table 7. Acinetobacter species. Total number of invasive isolates tested (n: 5 696)* and percentage
resistance (%) per phenotype, EU/EEA, 2019
                                                                                                   Number of                      %
 Resistance pattern
                                                                                                    isolates                  of total**
 Fully susceptible                                                                                   2 652                       46.6
 Single resistance (to indicated antimicrobial group)
 Total (any single resistance)                                                                          276                        4.8
  Fluoroquinolones                                                                                       167                       2.9
 Aminoglycosides                                                                                         86                        1.5
 Carbapenems                                                                                             23                        0.4
 Resistance to two antimicrobial groups
 Total (any two-group combinations)                                                                     282                        5.0
 Fluoroquinolones + carbapenems                                                                         159                        2.8
 Fluoroquinolones + aminoglycosides                                                                     115                        2.0
 Aminoglycosides + carbapenems                                                                           8                         0.1
 Resistance to three antimicrobial groups
 Fluoroquinolones + aminoglycosides + carbapenems                                                      2 846                      43.6

* Only isolates with complete susceptibility information for carbapenems (imipenem and/or meropenem), fluoroquinolones (ciprofloxacin and/or
levofloxacin) and aminoglycosides (gentamicin, tobramycin and/or netilimicin) were included in the analysis. This represented 93% (5 696/6 113)
of all reported Acinetobacter spp. isolates.
** Not adjusted for population differences in the reporting countries

                                                                                                                                             19
You can also read