A planetary-scale disturbance in the most intense Jovian atmospheric jet from JunoCam and ground-based observations
←
→
Page content transcription
If your browser does not render page correctly, please read the page content below
A planetary-scale disturbance in the most intense Jovian
      atmospheric jet from JunoCam and ground-based
                         observations
   A. Sanchez-Lavega, J. Rogers, G. Orton, E. García-Melendo, J. Legarreta, F.
             Colas, J. Dauvergne, R. Hueso, J. Rojas, S. Perez-Hoyos, et al.

     To cite this version:
    A. Sanchez-Lavega, J. Rogers, G. Orton, E. García-Melendo, J. Legarreta, et al.. A planetary-scale
    disturbance in the most intense Jovian atmospheric jet from JunoCam and ground-based observa-
    tions. Geophysical Research Letters, American Geophysical Union, 2017, 44 (10), pp.4679-4686.
    �10.1002/2017GL073421�. �hal-02262451�

                                 HAL Id: hal-02262451
                https://hal.archives-ouvertes.fr/hal-02262451
                                    Submitted on 16 Sep 2021

    HAL is a multi-disciplinary open access            L’archive ouverte pluridisciplinaire HAL, est
archive for the deposit and dissemination of sci- destinée au dépôt et à la diffusion de documents
entific research documents, whether they are pub- scientifiques de niveau recherche, publiés ou non,
lished or not. The documents may come from émanant des établissements d’enseignement et de
teaching and research institutions in France or recherche français ou étrangers, des laboratoires
abroad, or from public or private research centers. publics ou privés.
                                              Copyright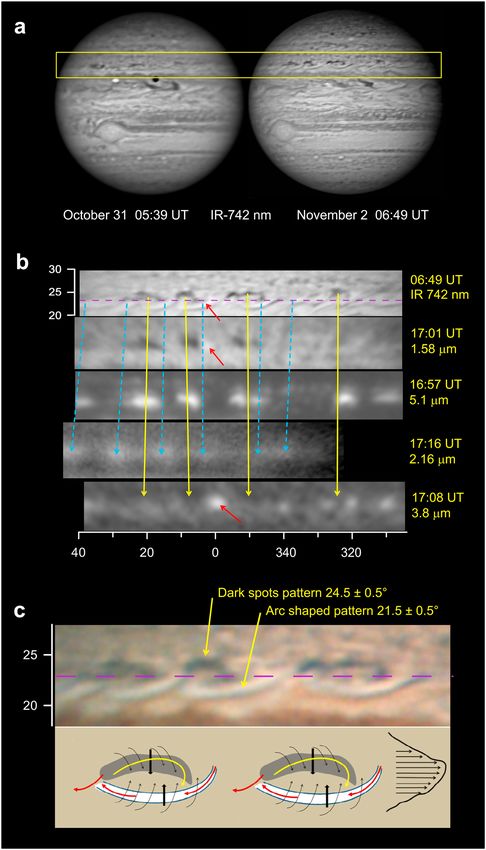
PUBLICATIONS
Geophysical Research Letters
RESEARCH LETTER                            A planetary-scale disturbance in the most intense
10.1002/2017GL073421
                                           Jovian atmospheric jet from JunoCam
Special Section:                           and ground-based observations
Early Results: Juno at Jupiter
                                           A. Sánchez-Lavega1 , J. H. Rogers2, G. S. Orton3 , E. García-Melendo4 , J. Legarreta5 , F. Colas6,
                                           J. L. Dauvergne7 , R. Hueso1, J. F. Rojas1 , S. Pérez-Hoyos1, I. Mendikoa1 , P. Iñurrigarro1 ,
Key Points:
• A planetary-scale disturbance            J. M. Gomez-Forrellad4, T. Momary3 , C. J. Hansen8 , G. Eichstaedt9 , P. Miles10 ,
  developed in the highest-speed           and A. Wesley11
  Jupiter jet at 23.5°N latitude during
  October and November 2016                1
                                             Departamento Física Aplicada I, Escuela de Ingeniería de Bilbao, Universidad del País Vasco UPV/EHU, Bilbao, Spain,
• Four “plumes” were involved in the       2
                                             British Astronomical Association, London, UK, 3Jet Propulsion Laboratory, Pasadena, California, USA, 4Fundació Observatori
  outbreak moving with speeds
  between 155 and 175 m s , the
                               1          Esteve Duran, Seva, Spain, 5Sistemen Ingeniaritza eta Automatika Saila, Bilboko Ingeniaritza Eskola, Euskal Herriko
  fastest features at cloud level          Uniberstitatea UPV/EHU, Bilbao, Spain, 6IMCCE, Observatoire de Paris, Paris, France, 7S2P, Ciel et Espace, Paris, France,
                                           8
• Nonlinear numerical models                 Planetary Science Institute, Tucson, Arizona, USA, 9Independent Scholar, Stuttgart, Germany, 10Gemeye Observatory,
  reproduce the disturbance from the       Rubyvale, Queensland, Australia, 11Astronomical Society of Australia, Murrumbateman, New South Wales, Australia
  interaction between local sources (the
  plumes) and the zonal eastward jet

                                           Abstract      We describe a huge planetary-scale disturbance in the highest-speed Jovian jet at latitude
Supporting Information:                    23.5°N that was first observed in October 2016 during the Juno perijove-2 approach. An extraordinary
• Supporting Information S1
                                           outburst of four plumes was involved in the disturbance development. They were located in the range of
Correspondence to:                         planetographic latitudes from 22.2° to 23.0°N and moved faster than the jet peak with eastward velocities in
A. Sánchez-Lavega,                         the range 155 to 175 m s1. In the wake of the plumes, a turbulent pattern of bright and dark spots (wave
agustin.sanchez@ehu.eus                    number 20–25) formed and progressed during October and November on both sides of the jet, moving with
                                           speeds in the range 100–125 m s1 and leading to a new reddish and homogeneous belt when activity
Citation:                                  ceased in late November. Nonlinear numerical models reproduce the disturbance cloud patterns as a result of
Sánchez-Lavega, A., et al. (2017), A       the interaction between local sources (the plumes) and the zonal eastward jet.
planetary-scale disturbance in the most
intense Jovian atmospheric jet from
JunoCam and ground-based
observations, Geophys. Res. Lett., 44,     1. Introduction
4679–4686, doi:10.1002/2017GL073421.
                                           Planetary-scale disturbances in Jupiter’s atmosphere are the main source of the changes in the belt-zone
Received 18 MAR 2017                       albedo pattern and in the global appearance of the planet. There are two regions of Jupiter, the South
Accepted 12 APR 2017                       Equatorial Belt (SEB) at planetographic latitude ~16°S and the North Temperate Belt southern component
Published online 25 MAY 2017
                                           (NTBs) at latitude 23.5°N, that undergo such changes in a dramatic and somewhat similar manner [Peek,
                                           1958; Rogers, 1995; Sánchez-Lavega and Gómez, 1996; Sánchez-Lavega et al., 2008]. They start from a similar
                                           single or multiple convective outbreak that manifests as a bright spot (at visual wavelengths) whose interac-
                                           tion with the sheared background winds forms a characteristic disturbance that propagates relative to the
                                           outbreak source, encircling the whole latitude in ~1–3 months, finally generating a new low-albedo band
                                           (a belt). We refer to these great disturbances as the SEBD and the NTBD, following previous works by
                                           Sánchez-Lavega et al. [1991, 2008] (see Rogers [2016] for the nomenclature of events at these latitudes).
                                           Just like the similar Great White Spot phenomena in Saturn’s atmosphere [Sánchez-Lavega et al., 2017], these
                                           outbreak events give us information on the atmospheric dynamics and cloud and aerosol behavior over the
                                           pressure range in altitude from 0.01 to 5 bar.
                                           A typical NTBD (plume outbreak and planetary-scale disturbance) starts at the latitude ~23.5°N on the peak of
                                           the most rapid Jovian jet at cloud tops (pressure level ~0.7 bar) as observed at visual wavelengths [Rogers,
                                           1995; Sánchez-Lavega et al., 2008]. The jet peak velocity ranges from ~135 to 175 m s1, where this variability
                                           could be intrinsic or related to different altitudes of the tracers coupled to a possible vertical wind shear.
                                           The jet gradually accelerates before a NTBD outbreak, until it reaches almost the speed of the subsequent
                                           plumes [Rogers et al., 2006; Sanchez-Lavega et al., 2008]. The best studied events occurred in 1975 [Rogers,
                                           1976; Sánchez-Lavega and Quesada, 1988], 1990 [Sánchez-Lavega, et al., 1991; Rogers, 1992; García-Melendo
                                           et al., 2005], and 2007 [Sánchez-Lavega et al., 2008; Rogers and Mettig, 2008]. The last NTBD before the
©2017. American Geophysical Union.         present one occurred in April 2012 but was not well observed due to solar conjunction [Rogers and
All Rights Reserved.                       Adamoli, 2012]. Here we present a study of the 2016 outbreak that was exceptional since four plumes

SÁNCHEZ-LAVEGA ET AL.                                                   JUPITER’S NTB JET DISTURBANCE                                                            4679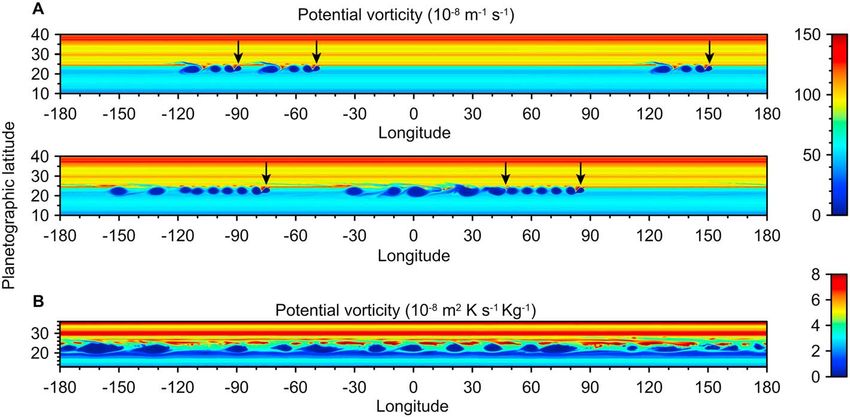
Geophysical Research Letters                                                          10.1002/2017GL073421

                            were active in generating the disturbance, whereas in the last two well-studied events in 1990 and 2007
                            there were two plumes. In addition, this eruption took place shortly before the Juno spacecraft perijove-
                            2 (PJ2) on 19 October.

                            2. Observations
                            For this study we used the following: (1) images obtained in the spectral range 0.38–1 μm with telescopes of
                            25–50 cm in diameter, from the Planetary Virtual Observatory and Laboratory (PVOL) database [Hueso et al.,
                            2010, 2017a] and with telescopes from the Aula EspaZio Gela Observatory [Sánchez-Lavega et al., 2014]; (2)
                            images obtained with PlanetCam “lucky imaging” camera that operates between 0.38 and 1.7 μm mounted
                            on the 2.2 m telescope at Calar Alto Observatory in Spain [Mendikoa et al., 2016]; (3) JunoCam color image
                            series [Hansen et al., 2014] obtained during perijove-2 approach between 11 and 14 October; (4) the 3 m
                            planetary-dedicated NASA Infrared Telescope Facility (IRTF) using the SpeX imager (wavelengths 1.58, 1.64,
                            1.65, 2.16, 2.26, 3.42, 3.8, and 5.1 μm); and (5) the 1 m planetary-dedicated telescope at Pic-du-Midi
                            Observatory (France) in the red range (0.6–1 μm). See supporting information for the list of contributors, data-
                            bases, and methods used to analyze these images.
                            2.1. Pre-outbreak Clouds
                            Hubble Space Telescope (HST) maps of the cloud morphology obtained on 9–10 February 2016 show that
                            northward of the jet peak in a conspicuous narrow band from latitudes 24.5° ± 0.2° to 25.5° ± 0.4°, the
                            reflectivity at 275 nm was high relative to surroundings, but it was low in the 890 nm methane absorption
                            band (OPAL program [Simon et al., 2015] (Figures S1 and S5 [Hueso et al., 2017b]). This suggests that this
                            narrow band was a region depleted in high-altitude aerosols, with UV brightness due to Rayleigh scattering
                            and methane band darkness due to gas absorption. We performed a preliminary analysis of photometrically
                            calibrated PlanetCam images obtained before the outbreak on 19 May 2016 using nine filters from the UV
                            (378 nm) to three near-infrared methane absorption bands (M2—727 nm, M3—890 nm, and YM—
                            1.162 μm) and their adjacent continuums (Figure S2). Radiative transfer models for February 2016 show a
                            particle-free stratosphere and upper troposphere with a haze deck located at 370 ± 100 mbar with optical
                            thickness of τ haze = 3.8 ± 0.6, above a cloud (τ cloud = 6.0 ± 2.0) assumed to be located at the ammonia
                            condensation level (~ 700 mbar) (see supporting information).
                            At 658 nm, the northern and southern parts of the jet, with cyclonic (latitude range 24° to 29°) and anticyclo-
                            nic (19° to 23.5°) ambient vorticities, respectively, were turbulent and occupied by a pattern of spots at visible
                            wavelengths, darker on the southern side where they showed a wavy appearance with some spatial periodi-
                            city (Figure S1). Color composite maps showed that the southern pattern was pale blue but at the jet and on
                            the northern side the color was brown, denoting the effects of altitude differences and probably differences
                            in the nature of chromophores at both sides of the jet (see supporting information).
                            2.2. Disturbance Outbreak: The Plumes
                            JunoCam images obtained between 11 and 14 October during the PJ2 approach phase (PJ2 was on 19
                            October) showed, at high phase angle and low resolution, bright and dark spots pertaining to the NTBs jet
                            outbreak [Rogers, 2016] (Figure 1a). Four bright spots or “plumes” labeled as A, B, C, and D were sequentially
                            captured as they came into view as the planet rotated (in section 2.3 we give estimates of the outbreak times).
                            Their mutual separation ranged from ~27,000 km to 229,500 km (Figures 1b and 2). The brightest part of the
                            plumes A and D (their “cores”) had a size of 4700 km (east-west) and 3200 km (north-south), as measured on
                            19 October at 3.8 μm from IRTF images. The plumes were bright at 2.12 and 2.16 μm where molecular hydro-
                            gen absorption dominates and at 3.8 μm that senses altitude levels above the main upper cloud layer [Irwin,
                            2003]. However, they do not appear at 5.1 μm (Figure S3), sensitive to thermal infrared radiation from the
                            interior, indicating that they had high opacity, consistent with the presence of thick clouds. Both aspects
                            are in good agreement with the high cloud-altitude and high-opacity plumes quantitatively described in
                            Sánchez-Lavega et al. [2008].
                            The plumes emerged in the anticyclonic southern flank of the undisturbed jet (Figure 3). Plume A was located
                            at latitude +22.4° ± 0.7° and had a longitude drift rate of 4.2°/d in System I (SI) (speed 157.3 ± 1.1 m s1 in
                            System III or SIII) as retrieved from a simple linear fit (Figure 2). Throughout the paper, the velocities given in
                            m s1 take System III as reference (see supporting information for system definitions). Plume D was at

SÁNCHEZ-LAVEGA ET AL.                                  JUPITER’S NTB JET DISTURBANCE                                                    4680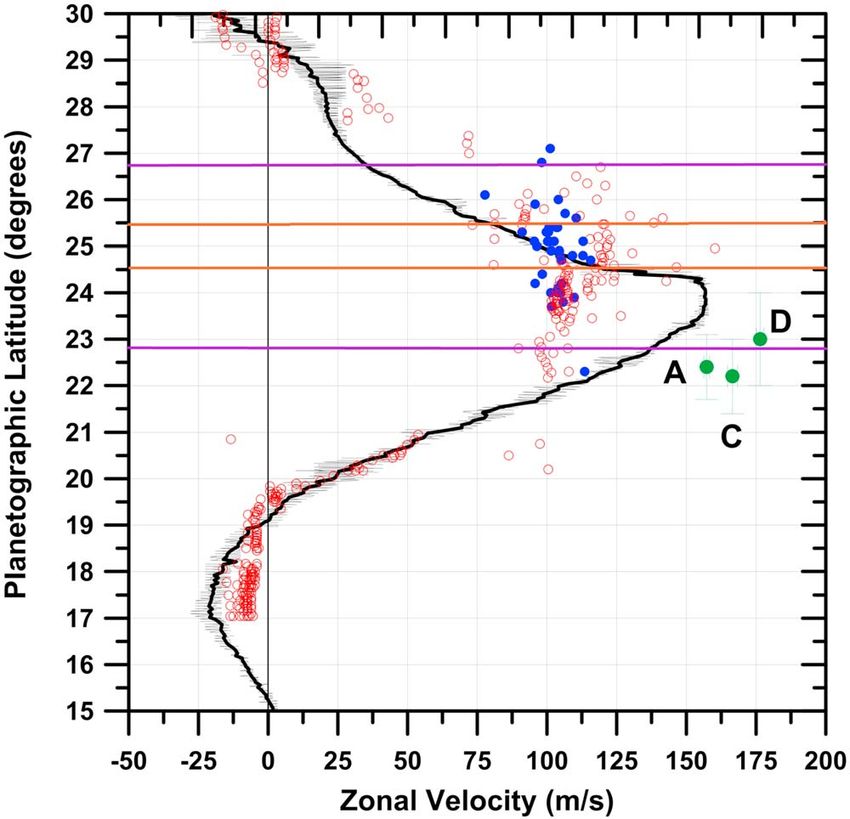
Geophysical Research Letters 10.1002/2017GL073421
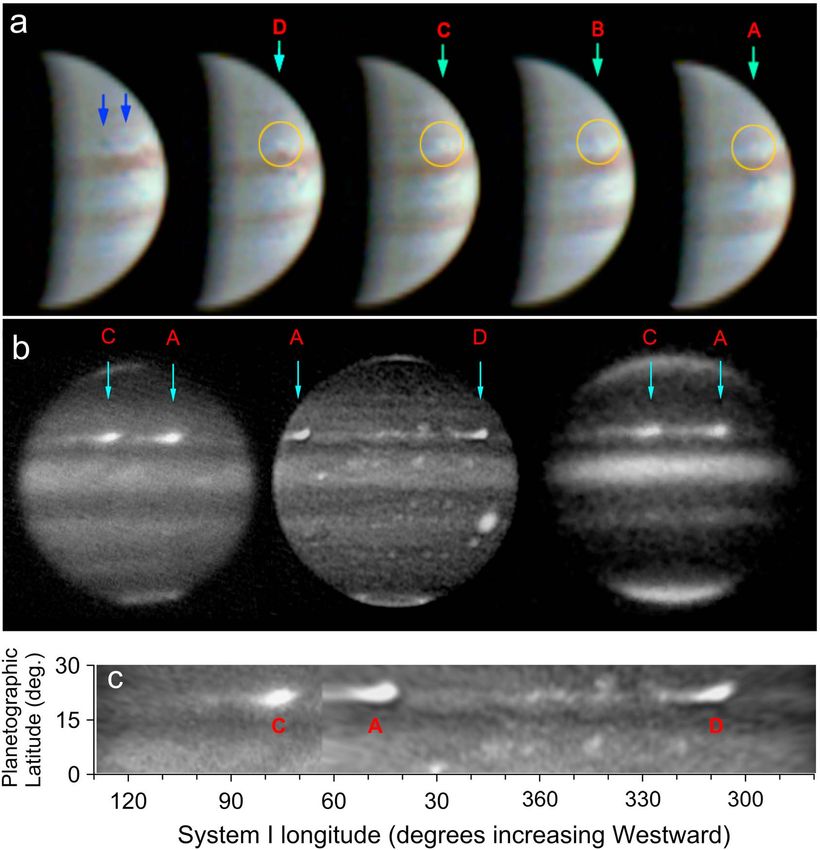
Figure 1. Images of the NTBD outbreak plumes: (a) JunoCam image series obtained on 14 October in SCET (UT at spacecraft, hh:mm:ss), from right to left: Image 085
(09:43:31), Image 089 (10:45:07), Image 091 (11:15:10), Image 113 (16:45:16), and Image 115 (17:15:20). The dark spots pertaining to the NTBD (blue arrows) and the
four different plumes (A, B, C, and D) are marked by red arrows and circles, respectively. (b) SpeX IRTF images on 19 October showing plumes (A, C, and D) at wavelengths
3.8 μm (19:47:39 UT, left, and 17:50:27 UT, middle) and 2.12 μm (19:56:51, right). (c) Map showing the location of plumes C, A, and D from the series (Figure 1b).
+23.0° ± 1.0° and had a drift rate of 5.64°/d in SI (speed 176.4 ± 1.3 m s1). Plumes B and C showed a more
complex behavior. The drift rate of these plumes suggests that a merger of B and C could have occurred, but
it is also possible that one of them disappeared rapidly. Two motion solutions are possible, one extremely fast
with drift rate 7.2°/d in SI (198.6 ± 2 m s1) never observed on Jupiter and the other with 4.8°/d in SI
(166.5 ± 1.8 m s1) for the track of B plus C after 19 October (latitude +22.2° ± 0.8°). We adopt this second
case for our wind profile and simulations, calling this plume C. Plumes C and D disappeared by the end of
October upon arriving at the location of the chains of dark spots preceding them and located to the north
of the jet (Figures 3 and 4), but A was alive until early November. The lifetimes of the plumes of about
1 month are typical of the NTBD phenomena [Sánchez-Lavega et al., 1991, 2008].
2.3. The Planetary-Scale Disturbance
As observed in previous cases [Sánchez-Lavega et al., 1991, 2008], each plume generated a wake consisting of
a turbulent pattern of bright and dark spots that forms continuously on their westward side (i.e., following
them) that progressed during October and November at both sides of the jet peak spanning a latitude
SÁNCHEZ-LAVEGA ET AL. JUPITER’S NTB JET DISTURBANCE 4681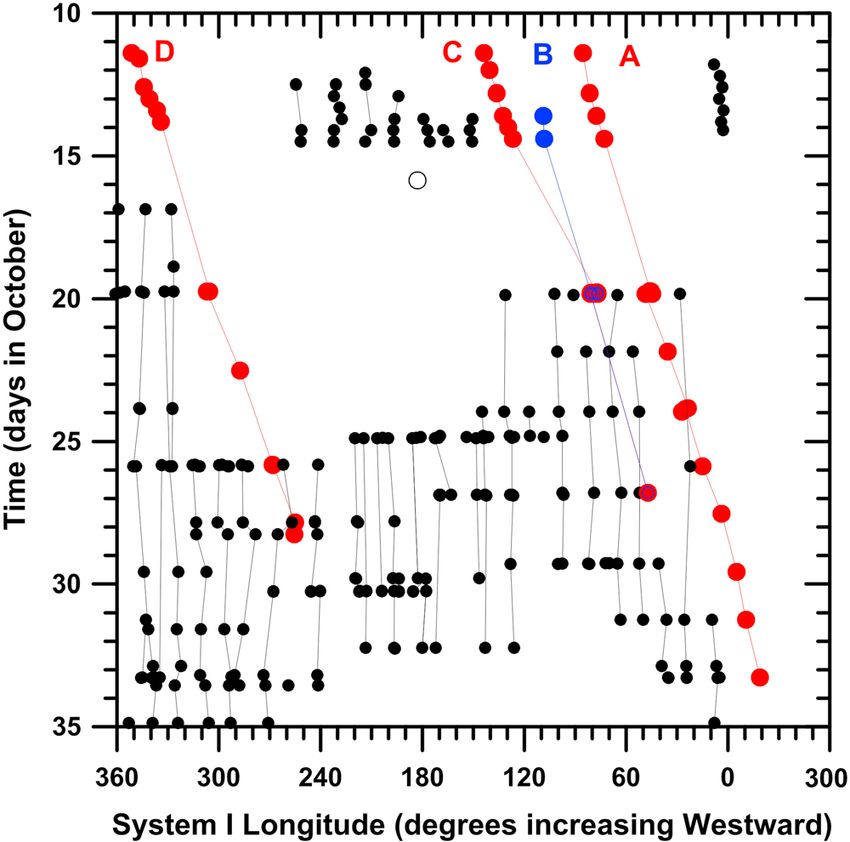
Geophysical Research Letters                                                              10.1002/2017GL073421

                                                                                                         band from ~19° to 27°N (Figure 3) and
                                                                                                         being nearly stationary relative to
                                                                                                         System I (Figure 2). Pre-outbreak images
                                                                                                         from July and August 2016 show the
                                                                                                         NTB free of this pattern (images avail-
                                                                                                         able on PVOL server; see supporting
                                                                                                         information). The turbulent pattern was
                                                                                                         formed by a chain of alternating irregu-
                                                                                                         lar dark and bright features as observed
                                                                                                         at red continuum wavelengths, with an
                                                                                                         approximate wave number of 20–25
                                                                                                         (wavelengths ~8000–10,000 km). The
                                                                                                         highest-resolution images (31 October
                                                                                                         to 6 November) showed the pattern of
                                                                                                         dark spots at latitude 24.5° ± 0.5°N in
                                                                                                         the cyclonic side of the pre-outbreak
                                                                                                         jet profile and bright arc-shaped fila-
                                                                                                         ments at 21.5° ± 0.5° in the pre-outbreak
                                                                                                         anticyclonic side (Figure 3). Each dark
                                                                                                         bright feature had a length of
                            Figure 2. Drift rate in System I longitude of the features pertaining to the ~14,000 km, and its morphology, reflec-
                            NTBD, tracked between 10 October and 4 November 2016. The plumes A, tivity in the visual, and radiance at short
                            C, and D are identified by red dots. Plume B is the blue dot: it disappeared  infrared wavelengths (1.58, 2.16, 3.8, and
                            or merged with plume C. The dark dots indicate features forming the          5.1 μm, Figures 3 and S4) were consis-
                            NTBD westward of the plumes. The lines identify the tracking of the
                                                                                                         tent with descending motions in the
                            features. Data from JunoCam images are for 11–14 October.
                                                                                                         cyclonic side (low cloud opacity and
                                                                                                         high radiances at 5.1 μm) and ascending
                            motions in the bright arc-shaped side (high clouds and reflectivity at 2.16 μm). The mean speed of these fea-
                            tures was nearly constant from ~21 to 26°N (Figure 4), and they formed a pattern reminiscent of the NEBs dark
                            formations (hot spots), gyres, and EZn festoons, so they could be wave-induced features, as our numerical
                            modeling suggests (see section 4). Tracking these features yielded speeds in the range 100–125 m s1 relative
                            to System III or ~50 m s1 relative to NTBs pre-outbreak jet peak speeds (Figures 2 and 3).
                            The first images of the plumes on 11–13 October by JunoCam showed that the long chain of dark spots west-
                            ward of plumes B and C extended ~120° in longitude or 159,000 km. Assuming a relative speed of ~60 m s1
                            between the plumes and the dark spot pattern, the outbreak of B or C or both probably occurred around
                            13–16 September. Similarly, on 19 October the disturbance pattern westward of plume D extended ~65°
                            or 75,000 km indicating that its outbreak probably occurred on 4–8 October. The separation between plume
                            D and the others was too large for one to have triggered the others, suggesting that an unknown process at a
                            deeper level triggered multiple outbreaks within a short time span, as has been observed at previous out-
                            breaks [Sánchez-Lavega et al., 1991, 2008].
                            Once the plumes ceased their activity, the mixing of the features forming the disturbance, most probably
                            generated by turbulence and wind shear, began to form a new North Temperate Belt. At the end of
                            November a red and uniform belt was visible over the jet spanning a latitude range from 22.8° to 26.7°,
                            but all was gray and turbulent on the poleward side from latitudes 26.7° to 32° (Figure S5). The equatorward
                            latitude of the reddish belt edge (22.8°) is where the plumes emerged, whereas the northern edge corre-
                            sponds to a latitude (26.7°) where the measurements of the velocity of the features pertaining to the distur-
                            bance (Figure 4) show a sudden change in their velocity. The white North Tropical Zone showed a long chain
                            of narrow dark filaments tilted from latitudes 19.3° to 22.3° according to the ambient anticyclonic wind shear.

                            3. Disturbance Motions and Wind Profile
                            Jupiter’s wind profile at the upper cloud level was measured in 2016 before the outbreak, using cloud auto-
                            matic tracking on a large set of images and HST image pairs from February 2016 and also using ground-based

SÁNCHEZ-LAVEGA ET AL.                                   JUPITER’S NTB JET DISTURBANCE                                                        4682
Geophysical Research Letters                                                                    10.1002/2017GL073421

                            Figure 3. Images showing the features pertaining to the NTBD westward of the plumes: (a) Images acquired at the Pic-
                            du-Midi Observatory obtained within the spectral range 0.742–1.0 μm showing the same region of the NTBD after 49 h,
                            at the indicated days and times. (b) Strips maps of the NTBD on 2 November at the indicated times and wavelengths with
                            longitude in System I and planetographic latitudes. Two families of features are shown, one at mean planetographic
                            latitude 24.5° (identified by yellow arrows, cyclonic) and the other at 21.5° (identified by blue dashed arrows, anticyclonic).
                            However, we note that some of the features in the 2.16 and 3.8 μm images may be unrelated to the NTBD. The red arrow
                            identifies a particularly bright spot, probably transient, at 3.8 μm (high aerosol density). The residual of plume A is probably
                            the weakly bright spot in the IR 742 nm filter at ~320° I (not present at other wavelengths). (c) Color enlargement showing
                            the morphology of the first strip shown in Figure 3b. The cartoon shows a possible circulation for each dark spot—arc-
                            shaped pair within the pre-outbreak meridionally sheared flow at right. The dashed violet line marks the location of the jet
                            peak before the outbreak.

SÁNCHEZ-LAVEGA ET AL.                                     JUPITER’S NTB JET DISTURBANCE                                                              4683
Geophysical Research Letters 10.1002/2017GL073421
observations with small telescopes up
to May 2016 [Hueso et al., 2017b]. We
use the NTBs HST jet profile as a refer-
ence for the motions and dynamics of
the NTBD.
We have used cloud tracking in October
and November 2016 to determine the
motions of the features pertaining to
the NTBD, covering the latitude range
of the jet from 15°N to 30°N. Two
methods have been used: (1) long-term
tracking (typically 5 to 30 days) of the
most conspicuous features, including
the plumes and using a linear fit to the
drift rate that gives the wind speed
(Figure 2), and (2) tracking of individual
features and supervised brightness
correlation cloud tracking [Hueso et al.,
2009] on image pairs separated a
maximum of 2 days on the highest-
Figure 4. Meridional profile of the NTBs jet stream as measured using HST
images on 9–10 February 2016 about 7–8 months before the outbreak resolution images obtained at Pic-du-
(black curve with wind error measurement indicated [Hueso et al., 2017b]). Midi Observatory from 30 October to 3
The velocity and location of the NTBD disturbance features are shown as November. Both methods are comple-
dots: green for the plumes (A, C, and D), blue dots for long-term tracked mentary and show similar results. The
features (dark and white spots, tracking for 5–10 days), and circles for all
first method provides fewer tracers,
kind of features (tracking on Pic-du-Midi images for about 50 h using two
methods). The NTBD data correspond to the period 11 October to 11 but the precision of the velocity deter-
November 2016. The horizontal orange lines mark the limits of the mination is high (typicallyGeophysical Research Letters 10.1002/2017GL073421
Figure 5. Numerical simulations of the NTBD using three sources as plumes: (a) Shallow Water model (potential vorticity
(vorticity/thickness) and (b) EPIC model (Ertel potential vorticity [Sánchez-Lavega, 2011]. The upper panel identifies the
plumes by arrows and shows the evolution of the NTBD after 7 and 18 days, respectively. The bottom panel shows EPIC
results after 45 simulation days of the three-plume evolution.
Planetary Isentropic-Coordinate (EPIC) general circulation model [Dowling et al., 1998; García-Melendo et al.,
2005]; see supporting information for details and Sánchez-Lavega [2011] for definitions.
In Figure 5 we show selected results of our simulations using both models when injecting three sources (each
1° in radius) placed at longitudes 0°, 40°, and 240°. Results are sensitive to the latitude where the perturbation
is injected. The SW model is able to reproduce the periodic pattern in the wake of the plumes when the initial
disturbance is located in the latitude range 24.5° to 25°. Out of these latitudes results diverged from the
observed morphology. For the three sources we find the best simulated cases to occur for Rossby deforma-
tion radius LD ∼ 1000 km and an altitude of the disturbed surface 1/20 the thickness of the SW layer. The EPIC
model gives us information on the possible vertical structure of the atmosphere just before the storm out-
break. The simulations that best reproduce the observations occur when the zonal wind has no vertical shear
beneath the upper clouds and the Brunt-Väisälä frequency is set at N ∼ 5 × 10³ s1. Both the SW and EPIC
models require that the sources must be located at 24.5°N. This suggests that the plumes have their base at a
latitude different than observed, and therefore, the ascending mass flow should be tilted meridionally with
respect to the local vertical and, as observed, moving faster than the velocities implied by the jet profile.
From the dynamical point of view, both models are able to reproduce the general periodic patterns, suggest-
ing that they are generated by the divergence of upwelling material transported aloft by the convective
activity close to the tropopause, the injection of relative vorticity, and its interaction with the jet peak at
23.5°. Both models are unable to reproduce some more specific details such as the arcs displayed in
Figure 3c.
5. Discussion
The SEBD and NTBD planetary-scale disturbances represent one of the major challenges to understand
Jupiter’s atmospheric dynamics, but at the same time the underlying physics can give us important insights
into the parameters that define the upper troposphere, beneath the upper clouds, such as the abundance of
water needed to initiate moist convection and the vertical structure of winds and temperature. They are also
important because they give us information about the nature of Jupiter’s winds through the turbulence
pattern the plumes generate in their wake (vortices, swirls, filaments, and waves) and on how they transfer
or extract energy and momentum from or to the zonal flow, changing the wind profile as reported in this
paper [Sánchez-Lavega et al., 2008; Barrado-Izagirre et al., 2009].
There are some aspects of the disturbances that are mysterious: Why are they cyclical and what process
establishes the temporal scale between events? What is the subjacent trigger mechanism? Why is there a
fixed latitude for the convective plumes and why a variable number of sources (one, two, and four in different
historical events observed so far)? Because this eruption occurred less than a month after Juno’s perijove-1
SÁNCHEZ-LAVEGA ET AL. JUPITER’S NTB JET DISTURBANCE 4685Geophysical Research Letters 10.1002/2017GL073421
PJ1 passage, analysis of the data provided at that time by instruments probing Jupiter’s troposphere can give
important information about the origin of this disturbance, for example, the presence of anomalies in the
temperature or compositional properties at the latitude of the jet. The same analysis of both Juno and
Earth-based supporting observations following perijove-3 on 11 December, i.e., when the plumes have
ceased and the mixing in the latitude band has formed the reddish belt, will provide information on the
perturbations the disturbance has produced.
Acknowledgments References
This work was supported by the Spanish
project AYA2015-65041-P with FEDER Barrado-Izagirre, N., S. Pérez-Hoyos, E. García-Melendo, and A. Sánchez-Lavega (2009), Evolution of the cloud field and wind structure of
support, Grupos Gobierno Vasco Jupiter’s highest speed jet during a huge disturbance, Astron. Astrophys., 507, 513–522.
IT-765-13, and by Universidad del País Dowling, T. E., A. S. Fischer, P. J. Gierasch, J. Harrington, R. P. Lebeau, and C. M. Santori (1998), The Explicit Planetary Isentropic-Coordinate
Vasco UPV/EHU through program (EPIC) Atmospheric Model, Icarus, 132, 221–238, doi:10.1006/icar.1998.5917.
UFI11/55. P.I. was supported by Aula García-Melendo, E., A. Sánchez-Lavega, and T. E. Dowling (2005), Jupiter’s 24°N highest speed jet: Vertical structure deduced from nonlinear
EspaZio Gela under contract from simulations of a large amplitude natural disturbance, Icarus, 176, 272–282.
Diputación Foral de Bizkaia. A portion of García-Melendo, E., and A. Sánchez-Lavega (2017), Shallow water simulations of the three last Saturn’s giant storms, Icarus, 286, 241–260.
this research was supported by the Hansen, C. J., M. A. Caplinger, A. Ingersoll, M. A. Ravine, E. Jensen, S. Bolton, and G. Orton (2014), JunoCam: Juno’s outreach camera, Space Sci.
National Aeronautics and Space Rev., doi:10.1007/s11214-014-0079-x.
Administration with funding both for Hueso, R., J. Legarreta, E. García-Melendo, A. Sánchez-Lavega, and S. Pérez-Hoyos (2009), The Jovian anticyclone BA: II. Circulation and
the Juno Project and for the interaction with the zonal jets, Icarus, 203, 499–515.
ground-based support at the Jet Hueso, R., J. Legarreta, S. Pérez-Hoyos, J. F. Rojas, A. Sánchez-Lavega, and A. Morgado (2010), The international outer planets watch
Propulsion Laboratory, California atmospheres node database of giant planets images, Planet. Space Sci., 58, 1152–1159.
Institute of Technology. We thank all the Hueso R., J. Juaristi, J. Legarreta, A. Sánchez-Lavega, J. F. Rojas, S. Erard, B. Cecconi, and P. Le Sidaner (2017a), The Planetary Virtual Observatory
observers who contributed to the and Laboratory (PVOL) and its integration into the Virtual European Solar and Planetary Access (VESSPA), Planet. Space Sci., doi:10.1016/j.
PVOL2 database. A list of the database pss.2017.03.014, in press.
web addresses where the images used Hueso, R., et al. (2017b), Jupiter cloud morphology and zonal winds from ground-based observations before and during Juno first perijove,
in this paper can be found is given in the Geophys. Res. Lett., 44, doi:10.1002/2017GL073444, in press.
supporting information (Text S1). Irwin, P. G. J. (2003), Giant Planets of Our Solar System, pp. 197–246, Springer & Praxis, Chichester, U. K.
Karkoschka, E., and M. G. Tomasko (2010), Methane absorption coefficients for the Jovian planets from laboratory, Huygens, and HST data,
Icarus, 205, 674–694.
Legarreta, J., N. Barrado-Izagirre, E. García-Melendo, A. Sánchez-Lavega, J. M. Gómez-Forrellad, and the IOPW team (2016), A large active
wave trapped in Jupiter’s equator, Astron. Astrophys., 586, 9, doi:10.1051/0004-6361/201526197.
Mendikoa I., A. Sánchez-Lavega, S. Pérez-Hoyos, R. Hueso, J. F. Rojas, J. Aceituno, F. Aceituno, G. Murga, L. de Bilbao, and E. García-Melendo
(2016), PlanetCam UPV/EHU: A two channel lucky imaging camera for solar system studies in the spectral range 0.38–1.7 microns, Publ.
Astron. Soc. Pac., 128, 035002.
Pedlosky, J. (1979), Geophysical Fluid Dynamics, chap. 7, pp. 504–512, Springer, New York.
Peek, B. M. (1958), The Planet Jupiter, chap. 9, pp. 75–82, Faber & Faber, London.
Rogers, J., and H.-J. Mettig (2008), Jupiter in 2007: Final numerical report (British Astronomical Association). [Available at http://www.brit-
astro.org/jupiter/2007report20.htm.]
Rogers, J. H. (1976), A high-velocity outbreak on the North Temperate Belt, J. Br. Astron. Assoc., 86, 401–408.
Rogers, J. H. (1992), Jupiter in 1989-90, J. Br. Astron. Assoc., 102, 135–150.
Rogers, J. H. (1995), The Giant Planet Jupiter, chap. 7, pp. 101–110, Cambridge Univ. Press, Cambridge, U. K.
Rogers, J. H., H.-J. Mettig, and D. Peach (2006), Renewed acceleration of the 24°N jet on Jupiter, Icarus, 184, 452–459.
Rogers, J. H. (2016), Start of the 2016 NTBs outbreak. Jupiter in 2016/17: Report no.1, British Astronomical Association. [Available at https://
www.britastro.org/node/8102.]
Rogers J. H., and G. Adamoli (2012), Progress of Jupiter’s great northern upheaval, 2012 July–August, Jupiter in 2012/13: Interim report no. 3
(British Astronomical Association). [Available at http://www.britastro.org/jupiter/2012_13report03.htm.]
Sánchez-Lavega, A. (2011), An Introduction to Planetary Atmospheres, chap. 7, pp. 353–427, Taylor-Francis, CRC Press, Florida.
Sánchez-Lavega, A., and J. M. Gómez (1996), The South Equatorial Belt of Jupiter. I: Its life cycle, Icarus, 121, 1–17.
Sánchez-Lavega, A., and J. A. Quesada (1988), Ground-based imaging of Jovian cloud morphologies and motions: II. The northern
hemisphere from 1975 to 1985, Icarus, 76, 533–557.
Sánchez-Lavega, A., I. Miyazaki, D. Parker, P. Laques, and J. Lecacheux (1991), A disturbance in Jupiter’s high-speed north temperate jet
during 1990, Icarus, 94, 92–97.
Sánchez-Lavega, A., et al. (2008), Depth of a strong Jovian jet from a planetary-scale disturbance driven by storms, Nature, 451, 437–440.
Sánchez-Lavega, A., S. Pérez-Hoyos, R. Hueso, T. del Río-Gaztelurrutia, and A. Oleaga (2014), The Aula EspaZio Gela and the Master of Space
Science and Technology in the Universidad del País Vasco (University of the Basque Country), Eur. J. Eng. Educ., 39, 518–526.
Sánchez-Lavega, A, G. Fisher, L. N. Fletcher, E. García-Melendo, B. Hesman, S. Pérez-Hoyos, K. Sayanagi, and L. A. Sromovsky (2017), The great
Saturn storm of 2010–2011, in Saturn in the 21st Century, chap. 13, Cambridge Univ. Press, Cambridge, U. K., in press. [Available at arXiv
1611.07669.]
Simon, A. A., M. H. Wong, and G. S. Orton (2015), First results from the Hubble OPAL program: Jupiter in 2015, Astrophys. J. Lett., 812–855.
SÁNCHEZ-LAVEGA ET AL. JUPITER’S NTB JET DISTURBANCE 4686You can also read