A relation between the radial velocity dispersion of young clusters and their age
←
→
Page content transcription
If your browser does not render page correctly, please read the page content below
A&A 645, L10 (2021)
https://doi.org/10.1051/0004-6361/202039673                                                                                                               Astronomy
c M. C. Ramírez-Tannus et al. 2021                                                                                                                         &
                                                                                                                                                          Astrophysics

                                                                          LETTER TO THE EDITOR

A relation between the radial velocity dispersion of young clusters
                          and their age
    Evidence for hardening as the formation scenario of massive close binaries
    M. C. Ramírez-Tannus1 , F. Backs2 , A. de Koter2,3 , H. Sana3 , H. Beuther1 , A. Bik4 , W. Brandner1 , L. Kaper2 ,
                                       H. Linz1 , Th. Henning1 , and J. Poorta2

      1
          Max Planck Institute for Astronomy, Königstuhl 17, 69117 Heidelberg, Germany
          e-mail: ramirez@mpia.de
      2
          Astronomical Institute “Anton Pannekoek”, University of Amsterdam, Science Park 904, 1098 XH Amsterdam, The Netherlands
      3
          Institute of Astronomy, KU Leuven, Celestijnenlaan 200 D, 3001 Leuven, Belgium
      4
          Department of Astronomy, Stockholm University, Oskar Klein Center, 106 91 Stockholm, Sweden

     Received 14 October 2020 / Accepted 18 December 2020

                                                                                     ABSTRACT

     The majority of massive stars (>8 M ) in OB associations are found in close binary systems. Nonetheless, the formation mechanism
     of these close massive binaries is not understood yet. Using literature data, we measured the radial-velocity dispersion (σ1D ) as a
     proxy for the close binary fraction in ten OB associations in the Galaxy and the Large Magellanic Cloud, spanning an age range from
     1 to 6 Myr. We find a positive trend of this dispersion with the cluster’s age, which is consistent with binary hardening. Assuming
     a universal binary fraction of fbin = 0.7, we converted the σ1D behavior to an evolution of the minimum orbital period Pcutoff from
     ∼9.5 years at 1 Myr to ∼1.4 days for the oldest clusters in our sample at ∼6 Myr. Our results suggest that binaries are formed at larger
     separations, and they harden in around 1 to 2 Myr to produce the period distribution observed in few million year-old OB binaries.
     Such an inward migration may either be driven by an interaction with a remnant accretion disk or with other young stellar objects
     present in the system. Our findings constitute the first empirical evidence in favor of migration as a scenario for the formation of
     massive close binaries.
     Key words. binaries: close – stars: formation – stars: early-type – open clusters and associations: general – binaries: general

1. Introduction                                                                                  an RV dispersion (σ1D ) of 35 km s−1 for the whole sample and
                                                                                                 25 km s−1 when excluding the two close binaries.
It is well established that the vast majority of massive stars                                       After pioneering studies to spectroscopically characterize
(M > 8 M ) come in pairs or as higher-order multiples (e.g.,                                     single massive young stellar objects (mYSOs) such as those car-
Mason et al. 2009; Chini et al. 2012; Peter et al. 2012; Kiminki                                 ried out by Bik et al. (2006, 2012), Ochsendorf et al. (2011),
& Kobulnicky 2012; Kobulnicky et al. 2014; Sana et al. 2014;                                     Ellerbroek et al. (2013), and Ramírez-Tannus et al. (2017) per-
Dunstall et al. 2015). A large fraction of these binaries have                                   formed a single-epoch VLT/X-shooter spectroscopic study of a
orbital periods on the order of 2 months or shorter (Sana &                                      sample of eleven candidate mYSOs in the very young giant H ii
Evans 2011; Sana et al. 2012; Kiminki & Kobulnicky 2012;                                         region M 17 (.1 Myr). The stars range in mass from 6−25 M
Almeida et al. 2017; Barbá et al. 2017). These binaries are effi-                                which is the mass range that dominates the samples from which
ciently detected with spectroscopic techniques measuring peri-                                   multiplicity characteristics of 2−4 Myr old main-sequence OB
odic Doppler shifts of the photospheric lines. Massive bina-                                     stars are derived (Sana et al. 2012; Kobulnicky et al. 2014). The
ries produce a variety of exotic products later in their evolution                               measured radial-velocity dispersion of these mYSOs is σ1D =
such as X-ray binaries, rare types of supernovae (Ibc, IIn, super-                               5.6 ± 0.2 km s−1 . In low density clusters, such as M 17, σ1D of
luminous SNe, Whelan & Iben 1973; Yoon et al. 2010; Langer                                       a single epoch is strongly dominated by the orbital properties of
2012), gamma-ray bursts (Woosley et al. 1993; Cantiello et al.                                   the binary population. For example, if a given cluster has several
2007), and, eventually, gravitational wave sources (e.g., Ivanova                                close binaries of similar masses, one would expect the individ-
et al. 2013; Mandel & de Mink 2016; de Mink & Mandel 2016;                                       ual radial velocities of the stars to differ significantly from each
Eldridge & Stanway 2016). However, the origin of massive close                                   other and, therefore, for σ1D to be large. For 2−4 Myr clusters,
binaries remains unknown.                                                                        with binary fractions >0.5 and minimum periods of ∼1.4 days,
    The first effort to characterize the binarity properties of a                                a dispersion of 30 to 50 km s−1 is typical (e.g., Kouwenhoven
sample of O stars in compact H ii regions was performed by Apai                                  et al. 2007; Sana et al. 2008, 2012; Sota et al. 2014; Kobulnicky
et al. (2007). They did a multi-epoch (two to three epochs) radial                               et al. 2014). The latter is in stark contrast with our observation of
velocity (RV) study of a sample of 16 embedded O stars in seven                                  M 17, suggesting a lack of close massive binaries in this region.
massive star-forming regions. They identified two close binary                                       In Sana et al. (2017), two scenarios are explored that may
stars based on their RV variations (∼90 km s−1 ) and measured                                    explain the low σ1D observed in M 17: a small binary fraction
                                                                                                                                                                             L10, page 1 of 7
                Open Access article, published by EDP Sciences, under the terms of the Creative Commons Attribution License (https://creativecommons.org/licenses/by/4.0),
                                 which permits unrestricted use, distribution, and reproduction in any medium, provided the original work is properly cited.
                                                                   Open Access funding provided by Max Planck Society.
A&A 645, L10 (2021)
fbin and/or a lack of short-period binaries. They conclude that the The radial velocity (RV) of the intermediate to high-mass
observed dispersion can be explained either if fbin = 0.12+0.16 −0.09 stars was obtained by measuring the Doppler shifts of a suitable
or if the minimum orbital period Pcutoff > 9 months. Parent pop- set of photospheric lines. Tables B.1 and B.2 list the RV obtained
ulations with fbin > 0.42 or Pcutoff < 47 days can be rejected for each star together with its error and the spectral lines used in
at the 95% significance level. Since it is unlikely that the binary our analysis.
fraction for M 17 would be so far below that of other clusters, this The RV-fitting approach is similar to the one adopted by Sana
very interesting result suggests that massive binaries form in wide et al. (2017). First, for the profile fitting, we adopted Gaussian
orbits that migrate inward over the course of a few million years. profiles. Second, we clipped the core of diagnostic lines that
In this Letter, we refer to the generic mechanism of shrinking were still contaminated by residuals of the nebular emission.
binary periods as the migration scenario. One strong test for this Third, we simultaneously fit all spectral lines available, thereby
scenario is to compare the velocity dispersion observed in clusters assuming that the Doppler shift is the same for all lines (see
spanning a range of ages. If the binary orbits harden with time, Sect. 2 and Appendix B of Sana et al. 2013).
one would expect σ1D to increase as the cluster age increases. Figure C.1 shows the radial-velocity distribution for the two
In Ramírez-Tannus et al. (2020), VLT/KMOS spectra of regions. We calculated the errors of the histogram bins by ran-
around 200 stars in three very young clusters (M 8, NGC 6357, domly drawing RV values from a Gaussian centered at each
and G333.6−0.2) were obtained. Introducing an automatic measured RV and with a sigma corresponding to the measure-
method to classify the spectra, the effective temperatures, and ment error; we repeated that process 105 times. The value shown
luminosities of the observed stars were characterized in order for each bin is the mean of all the RVs in that bin’s measure-
to place them in the Hertzsprung-Russell diagram (HRD). The ments and the error bar corresponds to the standard deviation.
age and mass range of the observed populations was constrained We obtained σ1D by calculating the weighted standard deviation
by comparison to MESA evolutionary tracks obtained from the of the measured RVs. The weighted mean and standard deviation
MIST project (Paxton et al. 2011, 2013, 2015; Dotter 2016; Choi are listed in the top-left corner of each histogram in Fig. C.1.
et al. 2016). The main sequence stars in M 8 have masses between The measured σ1D for M 8 and NGC 6357 are 32.7 ± 2.6 and
∼5 and ∼70 M and the age of this cluster is between 1 and 3 Myr. 26.9 ± 1.3 km s−1 , respectively.
In G333.6−0.2, the main sequence population ranges in mass
between ∼5 and ∼35 M and the estimated age of this region
isM. C. Ramírez-Tannus et al.: A relation between the radial velocity dispersion of young clusters and their age
Table 1. Age, radial-velocity dispersion, number of stars, and mass 0.06
range for our sample of young clusters hosting massive stars.
Frequency
0.04
Cluster Age σ1D N Mass Pmin Age
(Myr) (km s−1 ) (stars) (M ) (days) (ref.)
15–60 1.4+0.8 0.02
IC 1805 1.6–3.5 65.5 ± 3.1 8 1 2%
IC 1848 3.0–5.0 50.3 ± 12.8 5 15–60 1.4+3.2 2
+17.8
IC 2944 2.0–3.0 31.4 ± 0.3 14 15–60 6.3−4.5 3 0.00
NGC 6231 3.5–5.4 67.6 ± 0.4 13 15–60 1.4+0.7 4 0.0 0.5 1.0 1 0 1
NGC 6611 2.0–6.0 25.3 ± 1.6 9 +43.0
15–60 10.1−8.5
+74.9
5 Pearson r Pearson r
Wd2 1.0–2.0 15.0 ± 0.1 44 6–60 62.2−36.1 6 Fig. 2. Distribution of Pearson coefficients after randomly drawing
M 17 0.0–2.0 5.5 ± 0.5 12 6–20 3500−2834 7 105 samples from the data shown in Fig. 1. Left: 2D Gaussians centered
+3.8
M8 1.0–3.0 32.7 ± 2.6 16 6–20 2.4−1.0 8 at our data points and with σ equal to our error bars. The green,
NGC 6357 0.5–3.0 26.9 ± 1.3 22 6–30 +8.5
5.4−3.4 8 red, and blue areas show the 68, 95, and 99% confidence intervals,
respectively. The black line shows the observed coefficient. Right: 2D
R136 1.0–2.0 25.0 ± 5.9 332 15–60 24.1+9.0 9
−5.1 Gaussians centered at random locations of the parameter space (age
between 0 and 7 Myr and σ1D between 0 and 80 km s−1 ) and with σ
References. (1) Sung et al. (2017); (2) Lim et al. (2014); (3) Baume
equal to our error bars. The blue shaded area represents the probability
et al. (2014); (4) van der Meij et al. (in prep.); (5) Gvaramadze &
(2%) that the observed coefficient is caused by a random distribution.
Bomans (2008); (6) Zeidler et al. (2018); (7) Ramírez-Tannus et al.
(2017); (8) Ramírez-Tannus et al. (2020); (9) Hénault-Brunet et al.
(2012). 4. Physical parameters
Our aim is to characterize the multiplicity properties of observed
clusters based on the observed σ1D . This section presents the
80 1D = (13.3 ± 1.1)*t + (2.0 ± 0.1) results of Monte Carlo population syntheses computed with dif-
70 NGC6231 ferent underlying multiplicity properties.
IC1805
60
(km s 1)
4.1. Binary fraction and minimum period
IC1848
50 We focus on the effect that the binary fraction, fbin , and minimum
40 orbital period, Pcutoff , have on the observed σ1D . The method-
M8 IC2944 ology is similar to that used in Sana et al. (2017). A parent
population of stars is generated with a certain fbin and Pcutoff .
1D
30 NGC6357 NGC6611 The binary star systems in this population are described by their
20 R136 orbital properties. These are the primary mass, M1 , mass ratio,
q, period, P, and eccentricity, e. For the multiplicity properties
10 Wd2
M17 that we do not vary, we adopt the values from Sana et al. (2012)
for Galactic young clusters as the basic properties for our pop-
0 ulation. For the primary star, we adopt a Kroupa mass distribu-
0 1 2 3 4 5 6
t (Myr) tion (Kroupa 2001). The mass ratio distribution is uniform with
0.1 < q < 1. The probability density function of the period is
Fig. 1. Radial-velocity dispersion (σ1D ) versus age of the clusters. The described as pdf(P) ∝ (log P)−0.5 , with the period in days and
purple data points show the data from Sana et al. (2012), the magenta log Pcutoff < log P < 3.5. The eccentricity distribution depends
points show Wd2 and R136 (Zeidler et al. 2018; Hénault-Brunet et al. on the period of the binary system. For P < 4 days, we assume
2012), and the green data points show the clusters studied in Ramírez- circular orbits; for periods between 4 and 6 days, the eccentric-
Tannus et al. (2020) and Sana et al. (2017). The solid black line repre- ities are sampled from pdf(e) ∝ e−0.5 , with 0 ≤ e < 0.5; for
sents the linear fit to the data and the gray area shows the 1-σ errors on periods longer than 6 days the same distribution is used, but with
the fit. 0 ≤ e < 0.9.
In order to calculate the radial velocity of the binary star sys-
probability (2%) that a random distribution causes the observed tems, they are given a randomly generated inclination, i, lon-
coefficient. gitude of periastron, ω, and eccentric anomaly, E. The latter is
Even though the scatter is substantial, we conclude that for determined by generating a random mean anomaly and numeri-
the present data there is a positive correlation between σ1D and cally solving Kepler’s equation to find the corresponding eccen-
the age of the clusters. Although the number of clusters con- tric anomaly using Brent’s method (Brent 1973)1 . This gives all
sidered here remains limited and there are sizable uncertainties of the information required to calculate the binary component of
as to the individual age determinations, our results indicate an the radial velocity of the primary star through
increase in the fraction of close binary systems as the clusters get r !
older. M 17 seems to be a unique cluster given its very young age 1 + e 1
= K1 e cos(ω) + cos 2 arctan tan E + ω ,
vr,b
and extremely low σ1D . Trumpler 14 in this sense seems compa- 1−e 2
rable, being ∼1 Myr old and having no evidence for close bina- (1)
ries amongst its O stars (Sana & Evans 2011). We do not include
this cluster in the analysis because there are not enough stars 1
https://docs.scipy.org/doc/scipy/reference/
with RV measurements to calculate σ1D . generated/scipy.optimize.brentq.html
L10, page 3 of 7A&A 645, L10 (2021)
Pcutoff(t)=10(5 ± 1)exp( t/(0.19+0.06
0.04)) + 1.40
104
M17
103
Pcutoff (days)
102 Wd2
R136
101 NGC6611
NGC6357 IC2944
M8
48
IC1805 NGC6231
18
IC
100
0 1 2 3 4 5 6
t (Myr)
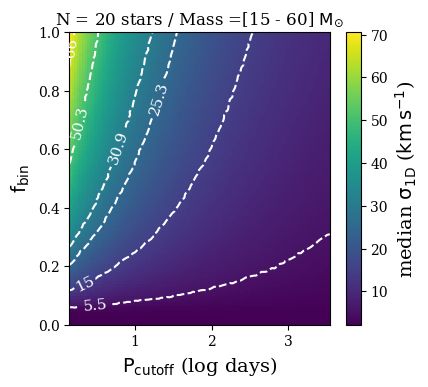
Fig. 3. Median σ1D obtained for distributions with different combina- Fig. 4. Pcutoff versus age of the clusters. The error bars represent the
tions of fbin and Pcutoff . For this set of simulations, we used a sample Pcutoff corresponding to the distributions that represent each σ1D within
of 20 stars ranging in masses from 15 to 60 M . The contours show the their 68% confidence range. The blue line and shaded region show the
trends followed by σ1D values of 5.5, 15, 25.3, 30.9, 50.3, and 66 km s−1 . fit to the data and its 1-σ error bars.
mass ranges in accordance to those of the observed samples (see
with K1 being the amplitude of the orbital velocity of the pri- Table 1). This allowed us to make a similar plot as in Fig. 1 but
mary star. The binary component of the radial velocity is added in terms of Pcutoff . Figure 4 shows the estimated Pcutoff for each
to the velocity due to cluster dynamics, σdyn . This results in a cluster as a function of cluster age. We determined that, assum-
population of stars with radial velocities based on either cluster ing fbin = 0.7, the most likely Pcutoff to explain the observed
dynamics only (in the case of fbin = 0) or both cluster dynamics σ1D of M 17 is around 3500 days and that a Pcutoff of 665 days
and binary orbits. The secondary stars are assumed to be unde- and 126 days can be rejected at the 68% and 95% confidence
tected. We adopt a cluster velocity dispersion for all clusters of levels, respectively. For the clusters with the largest σ1D in our
2 km s−1 , which corresponds to the typical value found by Kuhn sample, IC 1805, IC 1848, and NGC 6231, the cutoff period that
et al. (2019) who measured σdyn for several massive clusters in best explains the observed σ1D is 1.4 days, which is the Pcutoff
the Milky Way. Adopting σdyn = 1 or σdyn = 5 km s−1 has no adopted by Sana et al. (2012).
significant effect on our results. Sana et al. (2012) also conclude In order to get a first estimate of the binary hardening
that the dynamical dispersion of young clusters is negligible with timescale, we fit a function of the form P(t) = P0 e−t/t0 + c to the
respect to the dispersion due to binary motions. Each Monte data in Fig. 4, where P0 is the minimum period at the moment of
Carlo run consists of a generated parent population of 105 stars, binary formation and t0 corresponds to the e-folding time. As P0
which is sampled 105 times to simulate the observation of a is very uncertain, we assumed a typical value of 105 days, corre-
cluster. The mass distribution of the stars in the parent distribu- sponding to an initial separation of ∼100 AU for a pair of 10 M
tion are matched to the mass distribution in the observed cluster. stars. In order to find the range of t0 , we varied P0 from 104 to
The samples contain the same number of stars and measurement 106 days. The resulting fit and corresponding parameter ranges
accuracy as the observed sample. We then constructed density are shown with the blue line and shaded area in Fig. 4. We obtain
distributions of σ1D for each parent population. Each grid point a typical e-folding time of t0 = 0.19+0.06
−0.04 Myr. To harden an orbit
in Fig. 3 shows the median σ1D obtained for a simulated clus- from 3500 to 1.4 days, ∼8 e-foldings are needed, this implies
ter of 20 stars sampled from a parent population with masses that a typical binary hardening timescale is ∼1.6 Myr. Assum-
between 15 and 60 M , where we varied fbin , and Pcutoff . The ing a binary system with two 10 M stars, this would imply a
color bar corresponds to σ1D in km s−1 . The dashed lines show mean hardening rate of ∼7.5 AU yr−1 . For M 17, we discarded
the σ1D contours for 5.5, 15, 25.3, 30.9, 50.3, and 66 km s−1 , periods lower than 665 d with a 68% confidence level. Follow-
which correspond to the σ1D measured for our clusters. As the ing the same argument as before, the typical timescale to harden
number of stars and the mass ranges are different for each clus- an orbit from 665 to 1.4 days would be ∼1 Myr equivalent to a
ter, the contours do not represent the exact way in which we mean hardening rate of ∼4 AU yr−1 .
measured Pcutoff but are meant to show examples of the trends
that a certain σ1D follows in this diagram. A comparison of our
results with Sana et al. (2017) is shown in Appendix D. 5. Discussion and conclusions
In this Letter we present observational evidence that the 1D
4.2. Timescale of binary hardening
velocity dispersion of massive stars in young clusters (σ1D )
increases as they get older (Fig. 1). Additionally, we per-
Assuming that the binary fraction of massive stars is consistent formed Monte Carlo simulations which allowed us to convert
with that observed in OB stars in young open clusters ( fbin = 0.7; the measured values of σ1D to physical parameters. Assuming
Sana et al. 2012), but that binary stars are born in wider orbits, that stars are born with the binary fraction representative of OB
we can estimate Pcutoff which best represents the observed σ1D stars in 2−4 Myr clusters ( fbin = 0.7), we calculated the cutoff
for each cluster. For each cluster, we kept the distribution of period that would correspond to each of the observed popula-
orbital properties fixed and we adjusted the sample size and tions. From Fig. 4 we can conclude that the orbits would harden
L10, page 4 of 7M. C. Ramírez-Tannus et al.: A relation between the radial velocity dispersion of young clusters and their age
in 1−1.5 Myr. It is worth pointing out that the fit relies heavily on Barbá, R. H., Gamen, R., Arias, J. I., & Morrell, N. I. 2017, Proc. Int. Astron.
the M 17 point. If the binary fraction of this cluster were lower Union, 12, 89
than 0.7, the timescales derived would be larger. Nevertheless, Bate, M. R. 2009, MNRAS, 392, 590
Bate, M. R., Bonnell, I. A., & Bromm, V. 2002, MNRAS, 336, 705
the qualitative results of this Letter remain the same. Baume, G., Rodríguez, M. J., Corti, M. A., Carraro, G., & Panei, J. A. 2014,
Sana et al. (2017) propose that the inward migration process MNRAS, 443, 411
could be driven either by the interaction with the remnants of an Bik, A., Kaper, L., & Waters, L. B. F. M. 2006, A&A, 455, 561
accretion disk or with other young stellar objects. The hardening Bik, A., Henning, T., Stolte, A., et al. 2012, ApJ, 744, 87
of the orbits would then stop either when the disk is destroyed, Brent, R. P. 1973, SIAM J. Numer. Anal., 10, 327
Cantiello, M., Yoon, S. C., Langer, N., & Livio, M. 2007, A&A, 465, L29
or when the third body is pushed far out or ejected from the orbit. Chini, R., Hoffmeister, V. H., Nasseri, A., Stahl, O., & Zinnecker, H. 2012,
For a typical system of two 10 M stars, a total angular momen- MNRAS, 424, 1925
tum of ∼6.5 × 1047 kg m2 s−1 (∼3.5 × 1047 kg m2 s−1 ) needs to be Choi, J., Dotter, A., Conroy, C., et al. 2016, ApJ, 823, 102
transferred for the binary to harden from 3500 (665) to 1.4 days. Churchwell, E. 1990, in Hot Star Workshop III: The Earliest Phases of Massive
Rose et al. (2019) explored the possibility of the orbit hardening Star Birth, eds. P. Brown, & W. Fuller, Contemp. Math. Am. Math. Soc., 112,
186
via the Eccentric Kozai-Lidov (EKL) mechanism, where a third Cox, A. N. 2000, Allen’s Astrophysical Quantities (New York: AIP Press)
companion perturbs the orbit of a binary system. They find that, de Mink, S. E., & Mandel, I. 2016, MNRAS, 460, 3545
beginning with a cutoff period of 9 months the EKL mechanism de Mink, S. E., Pols, O. R., & Hilditch, R. W. 2007, A&A, 467, 1181
is insufficient to reproduce the population of short period bina- Dormand, J. R., & Prince, P. J. 1980, J. Comput. Appl. Math., 6, 19
Dotter, A. 2016, ApJS, 222, 8
ries observed by Sana et al. (2012). They suggest that type II Dunstall, P. R., Dufton, P. L., Sana, H., et al. 2015, A&A, 580, A93
migration (Lin & Papaloizou 1986) might explain the tightening Eldridge, J. J., & Stanway, E. R. 2016, MNRAS, 462, 3302
of binaries in such a time period. Moe & Kratter (2018) find that Ellerbroek, L. E., Bik, A., Kaper, L., et al. 2013, A&A, 558, A102
the main mechanism to harden binaries should be the dynamical Feigelson, E. D., Townsley, L. K., Broos, P. S., et al. 2013, ApJS, 209, 26
disruption of coplanar triples that initially fragmented in the disk Fujii, M. S., & Portegies Zwart, S. 2011, Science, 334, 1380
Gvaramadze, V. V., & Bomans, D. J. 2008, A&A, 490, 1071
in combination with energy dissipation within this disk. Other Hénault-Brunet, V., Evans, C. J., Sana, H., et al. 2012, A&A, 546, A73
mechanisms include the combination of EKL oscillations with Indebetouw, R., Mathis, J. S., Babler, B. L., et al. 2005, ApJ, 619, 931
tidal friction both during the pre-main sequence and the main Ivanova, N., Justham, S., Chen, X., et al. 2013, A&ARv, 21, 59
sequence (Bate et al. 2002; Bate 2009). Given the densities of Kiminki, D. C., & Kobulnicky, H. A. 2012, ApJ, 751, 4
the clusters studied, stellar encounters are uncommon and, there- Kobulnicky, H. A., Kiminki, D. C., Lundquist, M. J., et al. 2014, ApJS, 213, 34
Kouwenhoven, M. B. N., Brown, A. G. A., Portegies Zwart, S. F., & Kaper, L.
fore, mechanisms such as binary-binary or single-binary interac- 2007, A&A, 474, 77
tions should not play a significant role in the formation of close Kroupa, P. 2001, MNRAS, 322, 231
binaries (Fujii & Portegies Zwart 2011). Kuhn, M. A., Hillenbrand, L. A., Sills, A., Feigelson, E. D., & Getman, K. V.
Our findings affect predictions of binary population synthe- 2019, ApJ, 870, 32
sis models that follow the evolution of an ensemble of binary Langer, N. 2012, ARA&A, 50, 107
Lim, B., Sung, H., Kim, J. S., Bessell, M. S., & Karimov, R. 2014, MNRAS,
systems subject to, among others, a distribution function for the 438, 1451
zero-age orbital periods. Such models (e.g., Sana et al. 2012; Lin, D. N. C., & Papaloizou, J. 1986, ApJ, 309, 846
Schneider et al. 2015) predict that a small fraction of systems Mandel, I., & de Mink, S. E. 2016, MNRAS, 458, 2634
interact within a timescale of 3 Myr, almost invariably resulting Martins, F., & Palacios, A. 2013, A&A, 560, A16
in a merging of the two components thus creating a blue strag- Mason, B. D., Hartkopf, W. I., Gies, D. R., Henry, T. J., & Helsel, J. W. 2009,
AJ, 137, 3358
gler. Specifically, Schneider et al. (2015) report that of the popu- Massi, F., Giannetti, A., Di Carlo, E., et al. 2015, A&A, 573, A95
lation within two magnitudes in brightness of the main-sequence Moe, M., & Kratter, K. M. 2018, ApJ, 854, 44
turnoff, only 1%, 2%, and 10% is a blue straggler after 1, 2, or Nishiyama, S., Tamura, M., Hatano, H., et al. 2009, ApJ, 696, 1407
3 Myr. Therefore, unless one is specifically interested in early Ochsendorf, B. B., Ellerbroek, L. E., Chini, R., et al. 2011, A&A, 536, L1
blue straggler formation, the temporal evolution of orbital prop- Paxton, B., Bildsten, L., Dotter, A., et al. 2011, ApJS, 192, 3
Paxton, B., Cantiello, M., Arras, P., et al. 2013, ApJS, 208, 4
erties in the first few million years reported here should not affect Paxton, B., Marchant, P., Schwab, J., et al. 2015, ApJS, 220, 15
predictions made by binary population synthesis models that rely Pecaut, M. J., & Mamajek, E. E. 2013, ApJS, 208, 9
on initial conditions defined at the zero-age main sequence only. Peter, D., Feldt, M., Henning, T., & Hormuth, F. 2012, A&A, 538, A74
Except for the caveat mentioned, adopting initial conditions for Ramírez-Tannus, M. C., Kaper, L., de Koter, A., et al. 2017, A&A, 604, A78
the massive star population as reported on by Sana et al. (2012), Ramírez-Tannus, M. C., Poorta, J., Bik, A., et al. 2020, A&A, 633, A155
Rose, S. C., Naoz, S., & Geller, A. M. 2019, MNRAS, 488, 2480
for example, remains a justified approach. Sana, H., & Evans, C. J. 2011, in Active OB Stars: Structure, Evolution, Mass
Loss, and Critical Limits, eds. C. Neiner, G. Wade, G. Meynet, & G. Peters,
Acknowledgements. Based on observations collected at the European Organisa- IAU Symp., 272, 474
tion for Astronomical Research in the Southern Hemisphere under ESO program Sana, H., Gosset, E., Nazé, Y., Rauw, G., & Linder, N. 2008, MNRAS, 386, 447
095.C-0048. This research made use of Astropy, a community-developed core Sana, H., de Mink, S. E., de Koter, A., et al. 2012, Science, 337, 444
Python package for Astronomy (Astropy Collaboration 2018), NASA’s Astro- Sana, H., de Koter, A., de Mink, S. E., et al. 2013, A&A, 550, A107
physics Data System Bibliographic Services (ADS), the SIMBAD database, Sana, H., Le Bouquin, J.-B., Lacour, S., et al. 2014, ApJS, 215, 15
operated at CDS, Strasbourg, France (Wenger et al. 2000), and the cross-match Sana, H., Ramírez-Tannus, M. C., de Koter, A., et al. 2017, A&A, 599, L9
service provided by CDS, Strasbourg. The research leading to these results has Schneider, F. R. N., Izzard, R. G., Langer, N., & de Mink, S. E. 2015, ApJ, 805,
received funding from the European Research Council (ERC) under the Euro- 20
pean Union’s Horizon 2020 research and innovation programme (grant agree- Sharples, R., Bender, R., Agudo Berbel, A., et al. 2013, The Messenger, 151, 21
ment numbers 772225: MULTIPLES). Sota, A., Maíz Apellániz, J., Morrell, N. I., et al. 2014, ApJS, 211, 10
Sung, H., Bessell, M. S., Chun, M.-Y., et al. 2017, ApJS, 230, 3
Wellstein, S., & Langer, N. 1999, A&A, 350, 148
References Wenger, M., Ochsenbein, F., Egret, D., et al. 2000, A&AS, 143, 9
Whelan, J., & Iben, I., Jr. 1973, ApJ, 186, 1007
Almeida, L. A., Sana, H., Taylor, W., et al. 2017, A&A, 598, A84 Woosley, S. E., Langer, N., & Weaver, T. A. 1993, ApJ, 411, 823
Alonso, A., Arribas, S., & Martínez-Roger, C. 1999, A&AS, 140, 261 Wu, S.-W., Bik, A., Henning, T., et al. 2014, A&A, 568, L13
Apai, D., Bik, A., Kaper, L., Henning, T., & Zinnecker, H. 2007, ApJ, 655, 484 Wu, S.-W., Bik, A., Bestenlehner, J. M., et al. 2016, A&A, 589, A16
Arias, J. I., Barbá, R. H., & Morrell, N. I. 2007, MNRAS, 374, 1253 Yoon, S. C., Woosley, S. E., & Langer, N. 2010, ApJ, 725, 940
Astropy Collaboration (Price-Whelan, A. M., et al.) 2018, AJ, 156, 123 Zeidler, P., Sabbi, E., Nota, A., et al. 2018, AJ, 156, 211
L10, page 5 of 7A&A 645, L10 (2021)
Appendix A: Accuracy of the age determination near the Hayashi track were cluster members, we would obtain a
younger age (∼0.1−1 Myr younger) for the PMS stars compared
The effective temperature and bolometric correction of the lumi- to that of the massive stars only.
nosity class V stars are taken from Pecaut & Mamajek (2013);
for the luminosity class III stars, we used the calibrations from
Alonso et al. (1999) for spectral types F0-F9, and for G4-M5 Appendix B: Lines used to measure the radial
stars we used the calibration of Cox (2000). In order to calcu- velocity
late the luminosity of the observed targets, we used the abso-
lute K-band magnitude assuming the Indebetouw et al. (2005)
extinction law to derive the K-band extinction AK . We then Table B.1. Radial velocities and lines used to measure the radial veloc-
ity for each star in M 8.
obtained the absolute magnitudes by scaling the apparent mag-
nitudes to the distance of the clusters (1336+68 −76 pc for M 8 and
1770+140
−120 pc for NGC 6357; Kuhn et al. 2019). The luminosi- Name RV (km s−1 ) Br-12 Br-11 HeI Br-10 HeI Brγ
ties were obtained by using the bolometric correction and the 14 −14.1 ± 7.5 x x x x x x
absolute magnitudes. Finally, we determined the age of the 16 −17.4 ± 8.1 x x x x
regions by comparing the position of the observed stars to MESA 24 −57.1 ± 7.4 x x x x x
isochrones obtained from the MIST project (Paxton et al. 2011, 33 1.3 ± 16.0 x x x x
2013, 2015; Dotter 2016; Choi et al. 2016). The isochrones 36 −5.1 ± 7.6 x x x x
and tracks used have a solar metallicity and an initial rotational 51 −10.2 ± 9.0 x x x x x x
velocity of vini = 0.4 vcrit , the age obtained using tracks with 60 78.4 ± 12.4 x x x x x
vini = 0 are within the reported error bars. 73 56.6 ± 12.4 x x x
Here we discuss some of the issues that might affect the age 79 −38.1 ± 10.0 x x x x
determination and compare our age estimates with those pub- F44 28.5 ± 7.2 x x x
lished in the literature. (i) Binarity could affect the luminosity O10 11.6 ± 13.0 x x x x x x
determination by making stars look brighter than they actually O11 −52.9 ± 35.5 x x
are. Given the spacing of the isochrones at the young age of M 8 O5 −2.9 ± 9.0 x x x x
and NGC 6357, this does not have a significant effect on our age O6 29.9 ± 15.4 x x x x
determination. (ii) The use of different evolutionary tracks could O7 −24.5 ± 13.1 x x x x x x
lead to different age estimates; for example, Martins & Palacios O8 17.1 ± 16.6 x x x x
(2013) show that the main-sequence age for different models
could vary by ∼0.7 Myr for a 20 M isochrone. In our case, this
uncertainty is likely smaller than that caused by the uncertainty
on the spectral type. (iii) The age determination may depend on Table B.2. Radial velocities and lines used to measure the radial veloc-
the adopted extinction law. By using the Nishiyama et al. (2009) ity for each star in NGC 6357.
extinction law, we obtain lower AK values and, therefore, slightly
fainter objects. Nevertheless, given that the extinction in these Name RV (km s−1 ) Br-12 Br-11 HeI Br-10 HeI Brγ
three regions is relatively modest (AK,max ∼ 2.5), the difference
in luminosity produced by the various extinction laws does not 107 9.5 ± 14.7 x x
significantly affect the age determination. (iv) The classification 112 74.8 ± 9.0 x x x x x
of the earliest spectral type (O3) is normally degenerate (see e.g., 118 16.5 ± 13.1 x x x x
Wu et al. 2014, 2016). In the case of NGC 6357, the most mas- 16 9.8 ± 8.1 x x x x x
sive star is of spectral type O3.5. The fact that its spectral type 22 62.1 ± 16.2 x x x x x x
is uncertain could affect the lower age limit. To avoid this, we 73 40.4 ± 11.5 x x x x
determined the age based on the whole population, including the 88 −70.1 ± 12.4 x x x x x
low-mass PMS stars, instead of focusing only on the massive B0 10.7 ± 8.3 x x x x x
stars. B10 32.8 ± 2.9 x x x x
Arias et al. (2007) estimated the age of M 8 to beM. C. Ramírez-Tannus et al.: A relation between the radial velocity dispersion of young clusters and their age
Appendix C: Distribution of radial velocities of the et al. (2017) found a lower value of σ1D = 35.0+21.9
−14.9 km s . The
−1
OB stars in M 8 and NGC 6357 confidence intervals of the two values overlap due to the width
of the distribution.
We assessed the correctness of our method by generating a
(a) M8 (b) NGC 6357
parent population using numerically calculated two body orbits.
The binary star systems were generated in a similar way as
= -2.5±2.5 = 16.6±1.3 described above. Each system is described by a primary mass,
6 = 32.7±2.6 8 N == 26.9 ±1.3 mass ratio, period, and eccentricity using identical distributions
N = 16 22
6 as before. The orbits of the binaries were simulated in a two
4 dimensional plane. Only a single orbit starting at periastron was
N
N
4 simulated numerically using a fourth order Runge-Kutta method
2 (Dormand & Prince 1980). The systems were tested on their sta-
2 bility by integrating for a large number of orbits. The velocity
0 0 was obtained by selecting a random time step from the orbit.
140 70 0 70 140 140 70 0 70 140 The two dimensional x and y velocities were converted to a radial
Radial velocity (km/s) Radial velocity (km/s) velocity using a randomly generated inclination and longitude of
periastron. Finally, the effect of cluster dynamics was added to
Fig. C.1. Distribution of radial velocities for the massive stars in M 8 the radial velocity.
and NGC 6357.
The radial velocities calculated from the numerical two body
orbits were combined with the radial velocities of single stars to
Appendix D: Comparison to previous work generate a new parent population of 105 stars. This parent popu-
lation can be sampled as described above to generate a σ1D dis-
We compare the σ1D distribution obtained with the distribution tribution. Using the same cluster properties, we produced a σ1D
presented in Sana et al. (2017). Therefore, we sampled clus- distribution for M 17 with fbin = 0.7 and Pcutoff = 1.4 days. This
ters of 12 stars with Pcutoff = 1.4 days and fbin = 0.7 and the resulted in σ1D = 40.5+18.6
−16.0 km s , which agrees closely with
−1
radial velocity measurement errors of M 17. This results in a this work. No significant difference with this work was found
σ1D = 40.9+18.9
−16.1 km s
−1
for the method described above. Sana for any binary fraction or cutoff period.
L10, page 7 of 7You can also read