A review of opportunities to recover - value from apple and pear pomace
←
→
Page content transcription
If your browser does not render page correctly, please read the page content below

A review of
opportunities
 to recover
 value from
  apple and
pear pomace
A review of opportunities to recover value from apple and pear pomace

Authors:

Navreet Malhi, John Carragher, Maria Saarela and Stephen Pahl

South Australian Research and Development Institute (SARDI)
Department of Primary Industries and Regions

Front cover image: Ashton Valley Fresh

The Fight Food Waste Cooperative Research Centre (CRC) gratefully acknowledges the Australian
Government’s Cooperative Research Centre Program financial contribution as well as the participants of
this project Green Industries South Australia and the Department of Primary Industries and Regions SA’s
South Australian Research and Development Institute.

This document should be cited as Malhi N, Carragher J, Saarela M, Pahl S, and Fight Food Waste CRC
(2021) A review of opportunities to recover value from apple and pear pomace. Fight Food Waste
Cooperative Research Centre, Adelaide, Australia.

© Fight Food Waste Limited 2021

Level 1, Wine Innovation Central Building, Cnr Hartley Grove and Paratoo Road, URRBRAE SA 5064

enquiries@fightfoodwastecrc.com.au +61 8 8313 3564

All information, data and advice contained within the report is provided by the Fight Food Waste CRC
in good faith and is believed to be accurate and reliable as at the time of publication. However, the
appropriateness of the information, data and advice in the report is not guaranteed and is supplied by
the Fight Food Waste CRC ‘as is’ with no representation or warranty.
Industry partner foreword
As the South Australian (SA) Government agency whose role is to promote and facilitate a more
circular economy in SA, Green Industries SA (GISA) relies on credible and focused targeted industry-
led research.

This makes the work of the Fight Food Waste CRC (and SARDI) invaluable to GISA’s evidence-based
approach to policy and programme development leading to positive circular economy change.

The Fight Food Waste CRC project ‘Options for utilising apple and pear pulp residue’ allowed GISA to
ascertain, via SARDI desk-top research, more recent overall market conditions and technology
updates which encourage possible approaches to upvaluing this particular process residual waste
stream.

Important next steps for the industry include providing low-risk options, such as pilot projects, for
leading apple and pear growers/processors to explore the feasibility of the concepts presented in
the report.

                                                                                                        III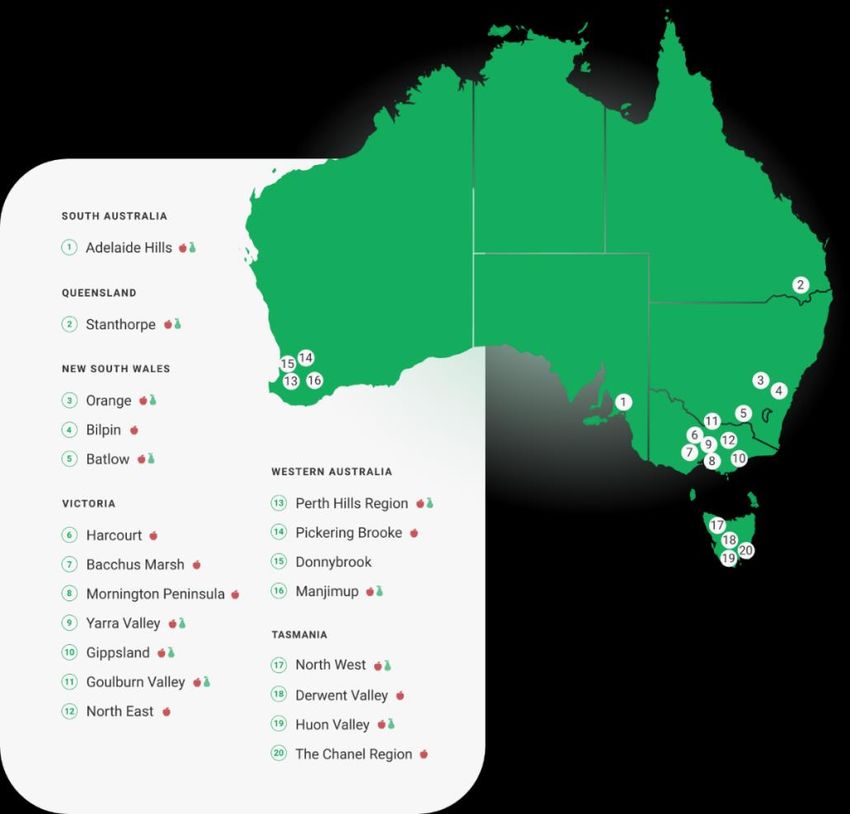
Executive Summary
There are currently more than 550 commercial apple and/or pear growers in Australia producing
over 260,000 tonnes of apples and 100,000 tonnes of pears per annum. Whilst most of this fruit is
sold fresh, approximately 30% is juiced. These juicing operations produce significant quantities of
pomace (residual matter) as a by-product which can create a waste management issue for the
operators. Apple and pear pomace are sources of many valuable compounds such as fibres, sugars
and phenolics. The wet pomace is however highly perishable and has traditionally been used as a
livestock feed supplement or sent to landfill.

In 2016 Green Industries SA commissioned the South Australian Research and Development
Institute (SARDI) to review and provide a report on the potential options for use of this pomace to
return value to South Australian producers and juicers. This project updates the original report by
considering the whole of Australia apple and pear production and juicing sector, and reviews recent
developments in end-product applications. Seven potential use categories were identified, namely
as a feedstock for biofuels; compost and solid growth substrates; food industry applications; pet
food and animal feed; nutraceutical and cosmetic applications; substrate for enzyme and
fermentation products; and textiles, biodegradable consumer products and other biomaterials.

An analysis and assessment of various potential end-products was also undertaken to provide an
idea of the cost-benefit opportunities that exist in an Australian context. Australian producers grow
less than half a percent of the global apple and pear production. Consequently, competing in the
production of any commodity-based products from Australian apple and pear pomace by small
operators will be economically challenging. A co-operative approach or a stand-alone pomace
processing facility fed by several processors may be a viable option for a commodity-based or novel
product in growing marketspaces. Economic feasibility assessments are needed to be undertaken
prior to considering any valorisation options for commercial developments.

                   Objective(s)                                        Result(s)
Objective 1 - Provide an up to date analysis of the        A literature search has been conducted
possible uses of apple and pear pomace residue.            and seven potential use categories have
                                                           been identified.

Objective 2 - Explore potential value-adding               Valorisation options have been explored
options available to maximise return from the              and potential options have been
resource.                                                  assessed.

Objective 3 - Inform the state of technology               State of technology readiness has been
readiness for options available and the relative           assessed and opinion on
cost of making that transformation.                        commercialisation of the product has
                                                           been provided.

Objective 4 - Explore potential target markets.            Target market for each potential use
                                                           have been identified.

                   Next Step(s)                                         Timing
It is anticipated that discussions will be held with       As opportunities arise, dates unknown at
key stakeholders to determine and agree on                 this stage
options for progression of pomace utilisation

                                                                                                      IV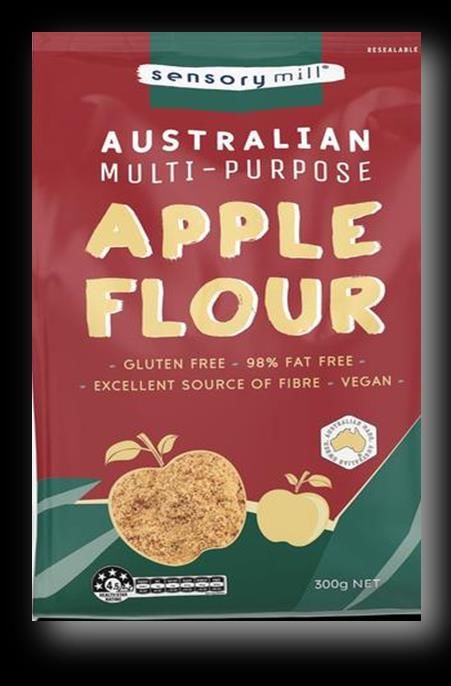
Project Milestone                                     Addressed/ Unaddressed
Project Milestone 1.1: Update literature review of    Completed
   apple and pear pomace uses and technologies.

Project Milestone 1.2: Update Australian and          Completed
   regional area data on apple and pear
   production and juicing percentages.

Project Milestone 1.3: Update relative value and      Completed
   size of market of each potential value-adding
   stream output

Project Milestone 1.4: Insert new information on      Completed
   relative costs of each value-adding processing
   infrastructure

Strategic Alignment 2.1: Existing waste streams       Market opportunities identified and
   relevant to partner organisations surveyed.        reviewed. Some food safety hazards
   Market opportunities and food safety hazards       identified.
   identified. Near-market opportunities
   reviewed.

Strategic Alignment 2.3: Further waste streams        Not addressed/not applicable
   relevant to partner organisations surveyed for
   both known and novel products. Further
   market opportunities and food safety hazards
   identified and reviewed. Intellectual property
   for new product solutions registered.

Strategic Alignment 2.7: Technology needs for         Technology needs and market
   different waste streams and products               opportunities included (where known)
   reviewed. Existing technologies surveyed.
   Market opportunities for technologies
   identified.

Strategic Alignment 2.13: Initial data set collated   Typical composition of apple and pear
   on waste composition, potential hazards and        pomace identified from literature
   volumes relevant to partner organisations.
   Review of available relevant technologies
   delivered. Protocols developed and circulated.

Strategic Alignment 2.15: Techno-economic             An analysis was undertaken that
   analysis of feed/product/process combinations      included the technical feasibility, process
   delivered for project regions.                     complexity and level of investment
                                                      required to commercialise and
                                                      manufacture various products, along
                                                      with an assessment of the state of
                                                      market, product yield and economic
                                                      value of the end product.

                                                                                                V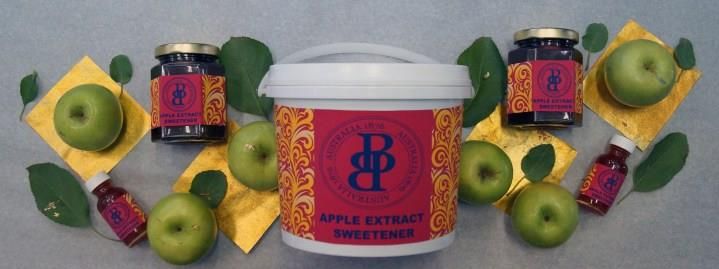
Project Impacts
This project will help inform relevant stakeholders (industry, researchers and other bodies) on the
potential utilisation options for apple and pear pomace. Uptake of such options may potentially
reduce the waste going to landfills and provide economic opportunities for the juicing sector.

                    Utilisation/Commercialisation Opportunities
Potential use categories for apple and pear pomace identified include:
    •   Biofuels
    •   Compost and growth substrate
    •   Food industry applications: including flours, pectin, aroma and flavour compounds,
        sweeteners
    •   Pet food and animal feed
    •   Nutraceutical and cosmetics
    •   Substrate for enzyme and fermentation products
    •   Textile and biodegradable tableware, biomaterials and bio packaging.

This project has not completed a formal techno-economic feasibility or identified if any option is
commercially viable for Australian processors

                                                 IP
The final report is the only project IP developed - no formal protection has been sought.

                                         Confidentiality
Not confidential

                                          Approved By
Project Leader: Dr. Stephen Pahl (South Australian Research and Development Institute) on 22 12
2020

Nominated Participant Representative: Andrew Hutchinson (Green Industries SA) on 02 12 2020

Transform Program Leader: Prof. Peter Halley (University of Queensland) on 28 01 2021

                                                                                                      VI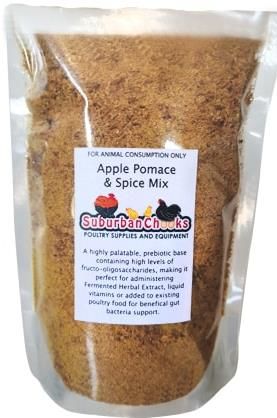
TABLE OF CONTENTS
TABLE OF CONTENTS................................................................................................................VII

LIST OF FIGURES ......................................................................................................................VIII

LIST OF TABLES .......................................................................................................................... IX

1.     BACKGROUND..................................................................................................................... 1
     1.1   PROJECT OBJECTIVES .......................................................................................................................1

2.     METHODOLOGY .................................................................................................................. 2

3.     RESULTS AND DISCUSSION ................................................................................................. 4
     3.1   GLOBAL APPLE AND PEAR PRODUCTION .............................................................................................4

     3.2   PRODUCTION AND JUICING STATISTICS IN AUSTRALIA............................................................................5

     3.3   GEOGRAPHICAL DISTRIBUTION OF APPLE AND PEAR PRODUCTION IN AUSTRALIA ......................................6

     3.4   STATEWIDE PRODUCTION STATISTICS FOR APPLES AND PEARS IN AUSTRALIA ............................................8

     3.5   PROXIMATE COMPOSITION OF APPLE AND PEAR POMACE .....................................................................9

     3.6   POTENTIAL USES .......................................................................................................................... 11

       3.6.1     Biofuels ............................................................................................................................. 14

       3.6.2     Compost and solid growth substrates ............................................................................. 15

       3.6.3     Food industry applications ............................................................................................... 16

       3.6.4     Pet food and animal feed ................................................................................................. 20

       3.6.5     Nutraceutical and cosmetic applications ......................................................................... 22

       3.6.6     Substrate for enzymes and fermentation products ......................................................... 25

       3.6.7     Textiles, biodegradable consumer products and other biomaterials .............................. 27

4.     CONCLUSION AND RECOMMENDATIONS ........................................................................ 29

5.     REFERENCES ...................................................................................................................... 30

6.     ACKNOWLEDGEMENTS..................................................................................................... 38

7.     APPENDIX 1 - SCIENTIFIC PUBLICATION TRENDS ............................................................. 39

                                                                                                                                                      VII
LIST OF FIGURES
Figure 1. Apple production from top five countries plus Australia; values reported as percent of
global production in 2018. Adapted from FAO (2019). .......................................................................4
Figure 2. Pear production from top five countries plus Australia; values reported as percent of global
production in 2018. Adapted from FAO (2019). ..................................................................................4
Figure 3. Total Australian apple production and juicing tonnage since 2012/13. Data sources:
Department of Agriculture and Water Resources (2018), Department of Agriculture, Water and
the Environment (2020). .....................................................................................................................5
Figure 4. Total Australian pear production and juicing tonnage since 2012/13. Data sources:
Department of Agriculture and Water Resources (2018), Department of Agriculture, Water and
the Environment (2020). .....................................................................................................................5
Figure 5. Major apple and pear growing areas in Australia. Reproduced from APAL (2019). ................7
Figure 6. Apple production in Australia 2018/19 by each state. Data source: Hort Innovation (2020). 8
Figure 7. Pear production (excluding Nashi) in Australia 2018/19 by each state. Data source: Hort
Innovation (2020). ...............................................................................................................................8
Figure 8. Typical image of apple pomace showing the heterogeneous nature. Reproduced from
Orchard Groundcare (2019). ...............................................................................................................9
Figure 9. Summary of average composition of apple pomace. Summation of all components equate
to 125%. Adapted from Kennedy, List et al. (1999). ...........................................................................9
Figure 10. Award winning apple extract sweetener from Botanical Innovations. ............................... 17
Figure 11. Apple flour produced in Australian apple orchard by Sensory Mill. ................................... 18
Figure 12. Apple pomace used in poultry feed mix sold online at Aussie Chook Supplies. ................. 21
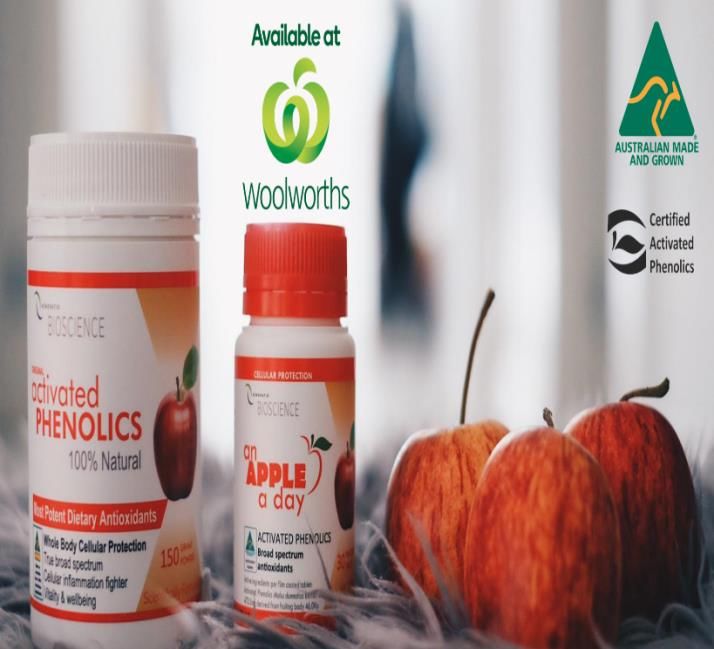
Figure 13. Apple phenolics rich Renovatio products sold online and at Woolworths food
supermarket. .................................................................................................................................... 23
Figure 14. Example of apple pectin based dietary supplement. Product sold online at iHerb.com. ... 23
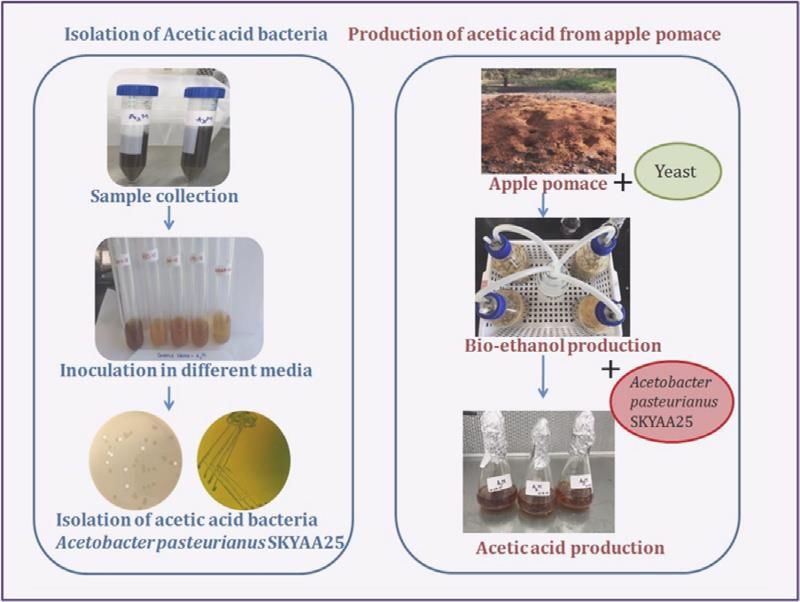
Figure 15. Bioconversion of apple pomace to acetic acid. Reproduced from Vashisht et al. (2019). . 26
Figure 16. Apple skin products available in market to replace leather products. Reproduced from
Kaja (2020), Ledoux (2020) and Mochni.com (2019). ...................................................................... 27
VIII
LIST OF TABLES
Table 1. Assessment table for potential uses identified. Adapted from Wrap Cymru UK (2017). .........2
Table 2. Technology readiness levels. Adapted from Wrap Cider Report (Wrap Cymru UK 2017). .......3
Table 3. Composition of apple pomace on wet weight basis. Adapted from Jewell and Cummings
  (1984). ..................................................................................................................................................9
Table 4. Composition of apple pomace from Spain. Data reported on dry weight basis. Adapted from
  Hijosa-Valsero, Paniagua-Garcia et al. (2017). ....................................................................................9
Table 5. Chemical and nutritional composition of apple and pear pomaces from Korea. Reproduced
  from Rebetika, Bachir, Aguedo, et al. (2014). .....................................................................................9
Table 6. Total phenolic content of peel and seeds from various fruits (wet basis). Adapted from
  Deng, Shen et al. (2012). .................................................................................................................. 10
Table 7. Antioxidant capacity of peel and seeds from various fruits (wet basis). Adapted from Deng,
  Shen et al. (2012). ............................................................................................................................. 10
Table 8. Summary of potential use assessment for apple and/or pear pomace products. ................. 12
Table 9. Examples of bioethanol and butanol available in markets and prices. .................................. 14
Table 10. Potential use assessment of bio-alcohols (i.e. ethanol and butanol) from apple and/or pear
  pomace. ............................................................................................................................................ 15
Table 11. Potential use assessment of biomethane from apple and/or pear pomace. ....................... 15
Table 12. Potential use assessment of compost and solid growth substrates from apple and/or pear
  pomace. ............................................................................................................................................ 16
Table 13. Apple products available in market as food ingredients. ..................................................... 19
Table 14. Potential use assessment for food industry application from apple and/or pear pomace. 20
Table 15. Example of stabilised apple pomace products for animal and pet feed that are available in
  the market. ....................................................................................................................................... 21
Table 16. Potential use assessment pet food and animal feed applications from apple and/or pear
  pomace. ............................................................................................................................................ 22
Table 17. Apple based, nutraceutical and cosmetic products available in market. ............................. 24
Table 18. Potential use assessment of nutraceutical and cosmetic applications from apple and/or
  pear pomace. .................................................................................................................................... 25
Table 19. Fermentation products available in market. ........................................................................ 26
Table 20. Potential use assessment of substrate for enzyme and fermentation products from apple
  and/or pear pomace. ........................................................................................................................ 27
Table 21. Potential use assessment of biodegradable tableware, biomaterials and bio packaging. .. 28
Table 22. Potential use assessment of textiles products from apple and/or pear pomace. ............... 28
Table 23. Top 10 organisations in Scopus database which contain ‘apple pomace’ in the title, abstract
  or keywords. ..................................................................................................................................... 39
Table 24. Top three organisations in Scopus database which contain ‘pear pomace’ in the title,
  abstract or keywords. ....................................................................................................................... 39

                                                                                                                                                          IX
1. BACKGROUND
Commercial apple and/or pear growers in Australia produce over 260,000 tonnes of apples and
100,000 tonnes of pears per annum. Whilst most of this fruit is sold fresh, approximately 30% is
juiced. Juicing operations produce significant quantities of pomace (residual solid matter) as a by-
product which can create a waste management issue for the operators. In 2016 Green Industries SA
commissioned the South Australian Research and Development Institute (SARDI) to produce a report
on the potential options for use of this pomace residue to return value to South Australian
producers and juicers. The report consisted of a literature review of published papers detailing the
various options that Australian and international researchers have explored. It also reviewed the
published data on compositional analysis of the pomace, as well as any yields and market value of
components from the pomace.

However, new applications/end products for the pomace and initiatives to reduce waste through the
supply/value chain has led to an opportunity to update the existing report and provide a whole of
Australia apple and pear production/juicing sector context that is missing from the original
document.

1.1 Project Objectives
There were four principle objectives to this project, namely:
    •   Provide an up to date analysis of the possible uses of apple and pear pomace residue
    •   Explore potential value-adding options available to maximise return from the resource
    •   Inform the state of technology readiness for options available and the relative cost of
        making that transformation
    •   Explore potential target markets.

The future utilisation of the findings from this report, specifically the implementation of food waste
transformation strategies, may reduce the amount of apple pomace going to landfill, provide new
sources of revenue and help Australia to half its food waste by 2030 in accordance with the United
Nations Sustainable Development Goal 12.3.

This project also assisted the Food Waste CRC objectives:
     2.1 Commercially Valuable Products from Waste
          2.1 Existing waste streams relevant to partner organisations surveyed. Market
               opportunities and food safety hazards identified. Near-market opportunities
               reviewed.
          2.3 Further waste streams relevant to partner organisations surveyed for both known and
               novel products. Further market opportunities and food safety hazards identified and
               reviewed. Intellectual property for new product solutions registered.
    2.2 Commercial Prototype Technologies for Waste Transformation
         2.7 Technology needs for different waste streams and products reviewed. Existing
              technologies surveyed. Market opportunities for technologies identified.
    2.3 Framework to Optimise Viability of Technology and Waste Input Combinations
         2.13 Initial data set collated on waste composition, potential hazards and volumes relevant
              to partner organisations. Review of available relevant technologies delivered.
              Protocols developed and circulated.
         2.15 Techno-economic analysis of feed/product/process combinations delivered for
              project regions.

                                                                                                         1
2. METHODOLOGY
A desktop study was undertaken to describe and characterise apple and pear juicing waste residues
and identify the various uses and potential uses of the components, including likely target markets
and potential monetary values; where possible. Keywords/phrases used in search terms included
‘apple pomace’, ‘pear pomace’, and ‘valorisation’. Snowball searches were subsequently undertaken
from scientific and grey literature.
The review also considered fruit production and juicing statistics in order to identify if Australia had
any competitive advantage. Institutes that contained either ‘apple pomace’ or ‘pear pomace’ in the
title of scientific publications were also identified and these results are summarised in Appendix 1.
Each of the identified potential uses were then evaluated against the scoring criteria outlined in
Table 1. The maturity of the technology were gauged against the technology readiness levels using
the benchmarking tool in Table 2.
Table 1. Assessment table for potential uses identified. Adapted from Wrap Cymru UK (2017).
Criteria Description of criteria
Assessment of the maturity of the technology (as per Table 2)
Technology Readiness Level
required for each particular end-product/application
Assessment (low-medium-high) of the complexity of the processes
Process complexity
involved for the production of particular end-product/application
Assessment of the size (low-medium-high) and trajectory of
State of market markets in Australia and or globally for each particular end-
product/application
Assessment of any likelihood of novelty, differentiation, disruption
Product differentiation (cost), or specific benefit derived from any particular by-product
utilisation
Assessment of the economic value (low-medium-high) of product
Economic value of end-product or ingredient derived from the pomace and potential scale of
production from by-product
Assessment of the yield (low-medium-high) of whole pomace
Product yield product or ingredient derived from pomace that is or has a
potential to be used in another market product
Assessment of investment costs (low-medium-high) involved (such
Level of investment to manufacture and
as resource input, equipment energy, water, materials, logistics
commercialise a product
etc.) to manufacture product from pomace and to commercialise it
Assessment of any residue after pomace utilisation and its
Residues
potential secondary use or destination
2Table 2. Technology readiness levels. Adapted from Wrap Cider Report (Wrap Cymru UK 2017).
Technology Readiness Level Basis for score
TRL1 Basic principles observed and reported
TRL2 Technology concept and /or application formulated
Analytical and experimental critical function and /or characteristic proof
TRL3
of concept
TRL4 Analytical basic validation in a laboratory environment
TRL5 Technology basic validation in a relevant environment
Technology model or prototype demonstration in a relevant
TRL6
environment
TRL7 Technology prototype demonstration in an operational environment
Actual technology completed and qualified through test and
TRL8
demonstration
TRL 9 Actual technology qualified through successful mission operations
33. RESULTS AND DISCUSSION
3.1 Global Apple and Pear Production
Australian apple and pear production accounts for less than 0.5% of the global production. In 2018,
Australian apple production in 2018 was approximately 268,000 tonnes compared to global apple
production of around 86 million tonnes (FAO 2019). The limited scale of apple and pear production
in Australia is apparent by reviewing in Figure 1 and Figure 2, respectively.
China, 46%
United States of
America, 5%
Poland, 5%
Other Countries, 37%
Turkey, 4%
Iran, 3%
Australia, 0.3%
Figure 1. Apple production from top five countries plus Australia; values reported as percent of global
production in 2018. Adapted from FAO (2019).
United States of
China, 68% America, 3%
Italy, 3%
Argentina, 2%
Turkey, 2%
Other Countries, 21%
Australia, 0.4%
Figure 2. Pear production from top five countries plus Australia; values reported as percent of global
production in 2018. Adapted from FAO (2019).
43.2 Production and Juicing Statistics in Australia
Australia apple and pear production and juicing data for the past seven years is shown in Figure 3
and Figure 4, respectively. This data demonstrates that production and juicing levels have been
relatively steady over this timeframe.
350
300
250
'000 Tonnes
200
150
100
50
0
2012-13 2013-14 2014-15 2015-16 2016-17 2017-18 2018-19
Years
Apple Juice Apple Production
Figure 3. Total Australian apple production and juicing tonnage since 2012/13. Data sources:
Department of Agriculture and Water Resources (2018), Department of Agriculture, Water and the
Environment (2020).
140
120
100
'000 Tonnes
80
60
40
20
0
2012-13 2013-14 2014-15 2015-16 2016-17 2017-18 2018-19
Years
Pear Juice Pear Production
Figure 4. Total Australian pear production and juicing tonnage since 2012/13. Data sources:
Department of Agriculture and Water Resources (2018), Department of Agriculture, Water and the
Environment (2020).
5It is noted that the production data from different sources (including Apple and Pear Australia
Limited (APAL), Food and Agriculture Organisation of the United Nations (FAO) and the Australian
Bureau of Agricultural and Resource Economics (ABARES)) have some discrepancies in absolute
values. For example, in 2018/19 the Australian apple production was approximately 287,000 tonnes
(Department of Agriculture, Water and the Environment (2020); see Figure 3), whereas Hort
Innovation (2020) reported that approximately 310,000 tonnes were produced, valued at $513M
farm-gate. Descrepancies in volume and value are due to how the information is obtained by the
respective bodies.
In Australia, most of the apples and pears are consumed domestically as fresh produce.
Approximately 30% of the Australian apple and 34% of Australian pear production is processed into
juice and ciders and other processing outlets such as jams, jellies and other confectionary-based
products, and a small proportion (approximately 1% apples and 8% of pear production) is exported
(APAL 2019).
3.3 Geographical Distribution of Apple and Pear Production in Australia
There are approximately 563 commercial apple and pear growers in Australia (Hort Innovation
2017). Different varieties of apples and pears are grown in different states of Australia. The ripening
times for different varieties grown in different parts of the country and use of cold-storage and other
controlled atmosphere technologies facilities enables the supply of fresh apples and pears
throughout the year. The major apple and pear growing regions in Australia are shown in Figure 5.
Apples are harvested typically between the months of February and May.
6Figure 5. Major apple and pear growing areas in Australia. Reproduced from APAL (2019).
73.4 Statewide Production Statistics for Apples and Pears in Australia
There are many apple varieties grown across Australia, but Pink Lady, Gala and Granny Smith
dominate the fresh market. The national breakdown in apple production for 2018/19 is shown in
Figure 6. Victoria is the largest producer, accounting for nearly 50% of the nation’s apple production,
followed by NSW at 14%.
Tasmania
10% New South Wales
14%
South Australia
10%
Western Australia
10%
Queensland Victoria
10% 46%
Apple production
Figure 6. Apple production in Australia 2018/19 by each state. Data source: Hort Innovation (2020).
Pear production (excluding nashi) was 114,446 tonnes in 2018/19, with Victoria producing 90% of
the total Australian production. The Australian Nashi Growers Association reports that around 4,500
tonnes of Nashi are produced in Australia (ANGA, 2000). The national breakdown for 2018/19 is
shown in Figure 7.
Queensland
0.3%
Western Australia
4%
Victoria South Australia
90% 5%
Tasmania
1%
New South Wales
0.2%
Pear Production
Figure 7. Pear production (excluding Nashi) in Australia 2018/19 by each state. Data source: Hort
Innovation (2020).
83.5 Proximate Composition of Apple and Pear Pomace
The pomace is heterogeneous as it contains
peel, core, seed, calyx, stem, residual juice
and soft tissues (see Figure 8). Whilst there
is limited information available regarding
the composition of apple and pear pomace
from Australian grown produce, the
composition and characteristics of apple
pomace has been reported in numerous
overseas studies.
Even though global pear production is of
the same order of magnitude as apple
production, very few published studies Figure 8. Typical image of apple pomace showing the
were readily available that report on the heterogeneous nature. Reproduced from Orchard
composition of pear pomace. Groundcare (2019).
Numerous studies have been conducted on the chemical composition of whole apples across the
globe which point to a difference in the composition for different varieties and cultivars (Carbone,
Giannini et al. 2011, Kalkisim, Ozdes et al. 2016, Zivkovic, Savikin et al. 2016, Oszmiański, Lachowicz
et al. 2018, Tarko, Kostrz et al. 2018, Kim, Ku et al. 2019). Aside from varietal differences the
composition of apple pomace is also influenced by the juicing process and technology (Kapoor,
Panwar et al. 2016). An 'average’ composition of apple pomace collated from various studies is
shown in Figure 9. The composition of apple pomace from several other studies is reported in Table
3 and Table 4. Apple pomace is generally rich in carbohydrates, minerals, vitamins, dietary fibre and
contains polyphenols which have antioxidant properties.
Dry material
Crude protein Carbohydrate Simple
Polyphenols Vitamins Fat (4.9%) Wax (1.7%) Ash (2.6%)
(4.5%) polymers carbohydrates
Tannin Vitamin C Xylose
Pectin (12.7%)
(0.25%) (0.054%) (0.06%)
Sucrose
Lignin (12.8%)
(5.4%)
Hemicellulose Fructose
(5.0%) (22.8%)
Cellulose Glucose
(17.6%) (16.8%)
Starch (17.9%)
Figure 9. Summary of average composition of apple pomace. Summation of all components equate
to 125%1. Adapted from Kennedy, List et al. (1999).
1“The most likely source of error is the starch, fructose and glucose contents which vary widely depending on
apple ripeness and cultivar. Another potential source of error is confusion related to reporting data on an "as
dried” basis (24% water) or a "bone dry" basis (0% water). The data above is, however, a useful proximate
summary of apple pomace” (Kennedy, List et al. 1999)
9Table 3. Composition of apple pomace on wet weight basis. Adapted from Jewell and Cummings
(1984).
Water Dry Matter Carbohydrates Proteins Pectin Fat Fibre
66.4-78.2% 21.1% 9.5-22% 1.0-1.8% 1.5-2.5% 0.8-1.4% 3.7%
Table 4. Composition of apple pomace from Spain. Data reported on dry weight basis. Adapted from
Hijosa-Valsero, Paniagua-Garcia et al. (2017).
Carbohydrates Cellulose Klason lignin Fats Moisture Protein Ash Phenolic compounds
55.9% 21.2% 18.5% 1.4% 6.6% 4.9% 1.3% 3.5mg/g
Table 5. Chemical and nutritional composition of apple and pear pomaces from Korea. Reproduced
from Rebetika, Bachir, Aguedo, et al. (2014).
Apple pomace Pear pomace
Chemical composition
Moisture (%) 8.1±0.2 8.3±0.1
Ash (g/100 g DM) 1.4±0.1 0.9±0.1
Protein (g/100 g DM) 6.0±0.3 5.7±0.2
Fat (g/100 g DM) 2.5±0.1 3.7±0.1
Free sugar (g/100 g DM) 1.1±0.1 0.3±0.1
Nutritional composition
Fibre, total (g/100 g DM) 82.0±0.5 90.7±1.1
Insoluble fibre, total (g/100 g DM) 77.8±0.5 89.2±0.5
Hemicelluloses 16.4±0.5 28.5±1.2
Cellulose 42.4±1.2 38.8±1.1
Lignin 19.0±0.2 21.9±0.5
Soluble fibre, pectens (g/100 g DM) 4.2±0.1 1.5±0.1
The composition of apple and pear pomaces are similar; however, pear pomace generally contains
more insoluble fibre and less soluble fibre. An alternative study found that total dietary fibre of pear
pomace on dry weight basis was 43.9% and it was mainly contributed by pectin (7% DW) and lignin
(5.2% DW), and protein content was found to be 3.8% and 5.4% ash (Martin- Cabrejas, Esteban et al.
1995).
Dietary fibres are often categorised as either soluble or insoluble fibres. Soluble fibres, such as
hemicellulose, dissolve in water forming a gel that slows down movement of food in the digestive
tract, helping the digestion process. Insoluble fibres, including cellulose, pectin and lignin, do not
dissolve in water and rather provide physical bulk which helps speed up the removal of wastes from
the bowel (Bhushan, Kalia et al. 2008, Varney 2016).
Apples are a rich source of polyphenolic compounds and phenolic compounds in apples are more
concentrated in the skin (epidermal and subepidermal layers) than the whole fruit (Candrawinata,
Golding et al. 2013).
9The total phenolic content and antioxidant capacities of fat and water soluble extracts from apple,
pear and grape marc (as a comparison) are reported in Table 6 and Table 7, respectively. These
values from apple and pears are relatively low compared to some other commodities.
REFRESH is an EU led research program that is aiming to halve per capita food waste at retail and
customer level and reducing food losses along production and supply chain by 2030 (REFRESH 2020).
The research program has developed an online database to explore food waste streams including
those from apple and pear production and processing. The database (available from
www.foodwasteexplorer.eu) lists possible side streams with proximate and specific compositional
data, and in some cases levels of undesirable components (i.e. pesticide residues, microbiological
organisms, toxins, and other contaminants) and the original data sources.
Table 6. Total phenolic content of peel and seeds from various fruits (wet basis). Adapted from Deng,
Shen et al. (2012).
Total phenolic content of peel Total phenolic content of seeds
(mg gallic acid equivalent/g) (mg gallic acid equivalent/g)
Fat-soluble Water-soluble Fat-soluble Water-soluble
Total Total
fraction fraction fraction fraction
Apple, green 2.8 ± 0.1 1.1 ± 0.0 3.9 ± 0.1 3.1 ± 0.4 0.5 ± 0.1 3.6 ± 0.5
Apple, red 3.0 ± 0.2 1.3 ± 0.2 4.4 ± 0.4 3.4 ± 0.2 1.1 ± 0.1 4.5 ± 0.2
Pear, fragrant 2.8 ±0.1 0.9 ± 0.1 3.7 ± 0.1 2.8 ± 0.2 0.6 ± 0.0 3.4 ± 0.2
Pear, crystal 3.0 ± 0.2 0.6 ± 0.0 3.6 ± 0.2 4.2 ± 0.1 1.0 ± 0.1 5.2 ± 0.2
Grape, USA 5.9 ± 0.3 2.3 ± 0.1 8.2 ± 0.4 12.1 ± 0.1 10.8 ± 0.9 23.0 ± 1.0
Table 7. Antioxidant capacity of peel and seeds from various fruits (wet basis). Adapted from Deng,
Shen et al. (2012).
Antioxidant capacity of peel Antioxidant capacity of seeds
(ferric-reducing antioxidant power; µmol Fe (ferric-reducing antioxidant power; µmol Fe
(II)/g) (II)/g)
Fat-soluble Water-soluble Fat-soluble Water-soluble
Total Total
fraction fraction fraction fraction
Apple-green 4.3 ± 0.2 6.2 ± 0.3 10.5 ± 0.4 3.2 ± 0.1 2.3 ± 0.2 5.5 ± 0.3
Apple-red 4.5 ± 0.4 6.9 ± 0.7 11.3 ± 1.1 4.1 ± 0.6 3.9 ± 0.2 8.0 ± 0.7
Pear -fragrant 8.1 ± 0.2 7.1 ± 0.2 15.2 ± 0.5 4.4 ± 0.2 4.5 ± 0.4 8.9 ± 0.6
Pear -crystal 5.0 ± 0.2 4.7 ± 0.4 9.6 ± 0.6 16.3 ± 0.6 6.9 ± 0.7 23.2 ± 1.3
Grape -USA 21.3 ± 2.2 13.7 ± 0.5 35.0 ± 2.7 85.4 ± 2.1 96.0 ± 4.9 181.4 ± 6.9
Apple seeds constitute 2-3% of pomace weight (Kennedy, List et al. 1999). Whilst there is no
information readily available on the fraction of pear seeds in pear pomace, it is expected to be of a
similar magnitude to apple pomace (Kennedy, List et al. 1999, Seberry, McCaffery et al. 2017, Yukui,
Wenya et al. 2009).
103.6 Potential Uses
Globally, apple pomace has traditionally been fed to farm animals or used in composting as way of
ridding this waste. After juicing the pomace is moist and is prone to rapid spoilage (Shalini and Gupta
2010). Pomace is often considered to be a poor animal feed supplement because of its relative low
protein and vitamin levels and high carbohydrate content (Vendruscolo, Albuquerque et al. 2008,
Ajila, Sarma et al. 2015).
Numerous studies (see Kosseva 2013, Dedenaro, Costa et al. 2016, Perussello, Zhang et al. 2017,
Yates, Gomez et al. 2017, Kumar, Bhardwaj et al. 2020) have been published on the potential
valorisation and utilisation of apple pomace, however, very few application have been
commercialised, and many of those are limited in scale. Functional properties such as pectin gel
encapsulation (Miceli-Garcia 2014), antioxidant properties of phenolic compounds (Candrawinata,
Golding et al. 2014) etc. have led to the development of many nutraceutical and value-added
products worldwide.
In 2017, WRAP (the Waste and Resources Action Programme in the UK) reviewed the opportunities
to get more value from apple pomace and cider lees. WRAP research suggested that no pomace
from the UK was sent to landfill, with the majority (31,000 tonnes) sent for animal feed and
anaerobic digestion (Wrap Cymru UK 2017). WRAP subsequently identified five high priority
opportunities for apple pomace, namely ciderkin (a weak alcoholic cider), flavour/aroma
compounds, pet food ingredients, fruit tea ingredients and high valued chemicals (pectin). No direct
comparison can be made with Australian pomace due to lack of data. Apple and pear pomace can be
used for various products and applications as shown in Table 8.
High levels of moisture (approximately 80%) in fresh pomace make it prone to microbial and
enzymatic deterioration, demanding either onsite operations, stabilisation (such as dehydration)
and/or refrigerated storage and transport, or rapidly transported from its origin for further
processing. For small scale juicing operators, processing the pomace for some value-added products
may not be a viable option. A cooperative type approach within regions or a larger-scale resource
recovery and processing facility may be an alternative option where the small- to large-scale juicing
operators can manage their pomace more economically. Due to long distances between regions (see
Figure 5) the transport of pomace between regions is unlikely to be economically viable.
11Table 8. Summary of potential use assessment for apple and/or pear pomace products.
Level of
Technology Economic investment to
State of Product Product Residue remaining and potential
Potential use Readiness Process complexity value of the commercialise and
market differentiation yield secondary use
Level end-product manufacture and
product
Biofuels
Bio-alcohols TRL4 High Growing Unlikely Low Low Medium to high Yes, compost or landfill
Biomethane TRL9 Medium Growing Unlikely Low Low Medium to high Yes, compost or landfill
Compost and solid
TRL9 Low Growing Unlikely Low Low Low to medium None
growth substrate
Food industry applications
Aroma
compounds/Flavour Low to
TRL9 High Likely High Low Low to high Yes, compost or landfill
compounds/Seed medium
oil
Low to
Pectin TRL9 Medium Likely High Medium Medium Yes, compost or landfill
medium
None for flour
Flours (including Low to Medium to
TRL9 Low to medium Likely High Low to high Yes, compost or landfill for
fermented flour) medium high
fermented flours
Pet food and animal feed
Animal feed TRL9 Low Steady Unlikely Low High Low None
Pet feed and diet Medium to
TRL9 Medium to high Growing Unlikely Variable Low to medium No residue in most cases
formulations high
Nutraceutical and
Yes, compost, animal feed or
cosmetic TRL9 High Growing Yes High Low Medium to high
landfill
applications
12Level of
Technology Economic investment to
State of Product Product Residue remaining and potential
Potential use Readiness Process complexity value of the commercialise and
market differentiation yield secondary use
Level end-product manufacture and
product
Substrate for Variable
Variable
enzyme and depending Low to Yes, compost, animal feed or
TRL3&4 Low to high Growing Unlikely depending upon
fermentation upon the medium landfill
the product
products product
Textile, biodegradable consumer products and other biomaterials
Biodegradable and Low to Low to
TRL6 Medium to high Growing Likely Medium No
biomaterials medium medium
Textile based Low to Yes, compost, animal feed or
TRL9 High Growing Yes High Medium -High
products medium landfill
133.6.1 Biofuels
Apple pomace contains simple sugars that can be fermented to produce various alcohols such as
ethanol (Hang, Lee et al. 1981, Vendruscolo, Albuquerque et al. 2008). Ethanol is considered a
renewable and sustainable biofuel that is usually blended with petrol (United Petroleum 2020).
Manildra Group (uses livestock grains (Manildra Group 2020), CSR Limited (uses sugarcane
production biomass (CSR Limited 2020) and Dalby Bio refinery of United Petroleum (uses grains-
sorghum (United Petroleum 2020) are the major ethanol producers in Australia.
The Australian Renewable Energy Agency recently funded a pilot project with New South Wales
based Ethanol Technologies Ltd to demonstrate ethanol production using waste or low value
products including sugarcane bagasse, forestry residues and cotton gin trash (Australian Renewable
Energy Agency 2017, Ethtec 2019). The largest challenge for the refining sector that is intending to
use waste materials is often logistics. Most juicing operations in Australia are relativity small and will
be unlikely to sustain refinery operations on their own. Wet pomace will need to be either dried,
pelleted, cold stored and/or transported to a centralised facility (Hang, Lee et al. 1981, Joshi and
Devrajan 2008, Edwards and Doran-Peterson 2012, Magyar, Costa Sousa et al. 2016, Bioenergy
Insight 2020).
Biobutanol is another biofuel that can be produced from apple pomace. However, biobutanol
production processes are complex, and yields are low compared to petrochemical-based processes
(Voget, Mignone et al. 1985, Hijosa-Valsero, Paniagua-Garcia et al. 2017, Maiti, Gallastegui et al.
2018).
High moisture and sugar levels in the apple pomace also make it a suitable feedstock for anaerobic
digestion to produce methane gas (Jewell and Cummings 1984, Kalia, Kumar et al. 1992). Whilst this
methane can be captured and sold as a commodity, for smaller processors it is often used on-site to
reduce other energy costs. Biomethane is recognised as a renewable energy source and can be used
for the same end consumer applications as natural gas. It is possible to also combine domestic and
agricultural wastes (including waste from various fruit industries) as feedstock for anaerobic
digestion systems (Bhatia, Ramadoss et al. 2020).
Some of the current biofuel prices are reported in Table 9 and the potential use assessment of bio-
alcohols and biomethane are reported in Table 10 and Table 11, respectively.
Table 9. Examples of bioethanol and butanol available in markets and prices.
Product Company Product format Price Link
Biolume, Denatured
Bioethanol 20.0 AUD/L https://www.biolume.com.au/
Australia ethanol
Fuel for ‘vent-
Bioethanol e-NRG, Australia 4.75 AUD/L https://e-nrg.com.au/
less’ fireplaces
https://www.echemi.com/products
Echemi.com,
Butanol Industrial grade 0.79 USD/L Information/pid_Seven2824-
USA
butanol.html
14Table 10. Potential use assessment of bio-alcohols (i.e. ethanol and butanol) from apple and/or pear
pomace.
Criteria Assessment
TRL-4. Apple pomace has been demonstrated as a feedstock for
Technology Readiness Level
raw materials required for biofuel production
High complexity – requires optimization of fermentation/enzyme
Process complexity
and often used in a mix with other feedstocks
Bioenergy is trending globally to reduce environmental footprint
State of market
from fossil fuels but needs to be economically competitive
Product differentiation Unlikely to exhibit any differentiation in the marketplace
Medium value and low production volumes from apple pomace
Economic value of end-product
when compared to other available feedstocks
Product yield Low
Level of investment to manufacture and
Medium to high
commercialise a product
Residue Residues most likely only suitable for compost or landfill
Table 11. Potential use assessment of biomethane from apple and/or pear pomace.
Criteria Assessment
TRL-9. Apple pomace combined with other feedstocks is currently
Technology Readiness Level
used to produce methane through anaerobic digestion processes.
Medium complexity – pomace can be used without pre-treatment
Process complexity but needs to be combined with other feedstocks to achieve a
suitable C/N ratio.
Bioenergy is trending globally to reduce environmental footprint
State of market
from fossil fuels but needs to be economically competitive
Product differentiation Unlikely to exhibit any differentiation in the marketplace
Low value and low production volumes from apple pomace when
Economic value of end-product
compared to other available feedstocks
Product yield Low
Level of investment to manufacture and
Medium to high
commercialise a product
Residue Some biosolids for compost or landfill
3.6.2 Compost and solid growth substrates
Apple pomace is organic material and has been used in composting as way of ridding this waste
(Vendruscolo, Albuquerque et al. 2008, Ajila, Sarma et al. 2015). Compost is a low valued product
that often retails for between $0.10-$0.36/kg. Apple pomace is also considered to be a suitable
feedstock for earthworms (Hanc and Chadimova 2014). Soil amendments using apple pomace have
shown positive impact on soil fertility by improving the total organic matter, total nitrogen and some
minerals in the soil (Yilmaz and Alagoz 2009). The utilisation of apple pomace as a key substrate for
the growth of Shitake and oyster mushroom has also received some attention (Worrall and Yang
1992). The production of mushrooms through this solid substrate fermentation can enhance the
nutritional value of the spent materials by improving lignocellulose digestibility (Mahesh and Mohini
152013). The potential use assessment of compost and solid growth substrates are reported in Table
12.
Table 12. Potential use assessment of compost and solid growth substrates from apple and/or pear
pomace.
Criteria Assessment
TRL 9. Composting is well established technology and uses mixed
Technology Readiness Level
feedstocks
Process complexity Low
Demand for compost products is dominated by urban amenities/
State of market
home gardeners. Expected to grow.
Product differentiation Nil - Compost is made from a mixture of organic materials
Economic value of end-product Low
Low production volumes from apple pomace when compared to
Product yield
other available feedstocks
Level of investment to manufacture and Low – apple pomace could be directed to existing facilities.
commercialise a product Requires transport and logistics.
Residue None
3.6.3 Food industry applications
Apple pomace is a potential source of dietary fibres consisting approximately 45-60 % of wet weight
including 5.5-11.7 % pectin (Bhushan and Gupta 2013). Apple fibre can have several functional
properties including enhancing water and oil retention, to improve emulsion or oxidative stabilities,
improve the viscosity, texture, sensory characteristics and shelf-life of the food product (Elleuch,
Bedigian et al. 2011). Fibres from cooked apple pomace can be used as textural ingredients due to
enhanced physicochemical properties such as water holding capacity or as functional foods
(Rabetafika, Bchir et al. 2014). Besides food technological properties increasing the fibre content in
foods can also improve their healthiness (Wu, Sanguansri et al. 2014).
Pomace can be dried and used as a crude ingredient or undergo further processing to improve its
physical and textural properties. The extraction of fibre generally involves a leaching step to remove
soluble sugars. The fibre can undergo additional processing to decolourise, however, unbleached
pomace fibre can also be utilised as a food ingredient. A study has shown that apple pomace fibre
can be used to reduce fat content from 30 to 20 % in uncured chicken sausages providing healthier
alternative to fat (Choi, Kim et al. 2016).
Main manufacturers of apple fibre ingredients include:
• EZ Organic Shop (Australia)
• J. Rettenmaier Söhne (Germany)
• Herbafood Ingredients GmbH (Germany)
• Tree Top Ingredients (USA)
• Hawkins Watts Australia Ltd (Mulgrave, Vic) are the national distributors for Herbafood
Ingredients GmbH (www.herbafood.de). The range of ingredients includes:
o The Herbasweet range of Apple sweeteners (high fructose)
o The Herbarom range of apple (high polyphenol content)
o The Herbacel range of fibre-rich apple extracts
16Pectin is a family of complex variable polysaccharides extracted from the primary cell wall of higher
plants and traditionally used in jam, jelly and confectionary making (Canteri-Schemin, Fertonani et
al. 2005). It is widely used in yogurts, bakery products, mayonnaise, salad dressings, tomato
ketchups, protein foams, and beverages. Using apple pomace for pectin extraction is considered the
most practical and economical solution to utilise this by product (Bhushan, Kalia et al. 2008, Miceli-
Garcia 2014).
Botanical Innovations based in Orange, NSW Australia, has developed several value-added products
including an Apple Sweetener from whole apples (see Figure 10), an apple cider vinegar and apple
peel extract (Botanical Innovations 2020).
Figure 10. Award winning apple extract sweetener from Botanical Innovations.
Ethanol can be produced from the apple pomace and used in beverages (Magyar, Costa Sousa et al.
2016). Processing of one tonne of dry pomace will produce about 135kg of ethanol (Magyar, Costa
Sousa et al. 2016).
A recent study by Juodeikiene et al (2019) investigated gel encapsulation properties in food and
found that apple pomace-pectin hydrogels can be used as a carrier of probiotic bacterial cells as a
functional ingredient for food (Catana, Catana et al. 2018, Juodeikiene, Zadeike et al. 2020).
Sensory Mill from Forbidden Foods collaborated with Bellevue Orchards, Victoria and Australian
Dehydrated Food to initiate production of apple fibre from pomace in a patented process to
promote and introduce Australia’s first apple flour in Jan 2020 (Figure 11) to the market (Foodmag
2020, Forbidden Foods 2020, Sensory Mill 2020). It is anticipated that 800,000 kg waste produced
each year will be converted into premium product for market instead of costly redistribution to
farmers for feed or move to landfill. There is very limited information available regarding the retail
cost of apple flour, however a gourmet retail supplier in the United States sells it for US$40/kg and
Sensory Mill sells it for AUD$43/kg.
17Apple flour can be blended with wheat flour and used for cookie, cake and muffin formulations
(Sudha, V. et al. 2007, Zlatanovic, Kalusevic et al. 2019). Addition of 5-10% of apple pomace in raw
noodles resulted in acceptable sensory qualities with high fibre content (Xu, Bock et al. 2020). Blends
of apple and wheat flour have been shown to have poor bread baking quality whereas incorporation
of fresh fibre concentrate from apple, pear and date pomaces enhanced the bread quality (Bchir,
Rabetafika et al. 2014). A Danish apple juicing company produces dried apple granules from its
residual pomace. These granules are sold commercially and can be used in various applications
including baking, cereals and yogurts (Vesterhavsmost 2020).
Researchers at the University of Auckland, New Zealand have developed a low-calorie apple flour
prototype by fermenting apple pomace (The University of Auckland 2015). The product, Ample
Apple, is reportedly nutrient rich; high in protein, vitamins, dietary fibre, gluten free and low in
cholesterol, fat and sugar and has the potential to replace wheat. The incorporation of an apple
powder from pre-harvest dropped apples has also been shown to reduce the oil absorption index of
apple/wheat flour blends (Kim, Kim et al. 2013).
A team of New Zealand scientists have successfully demonstrated a prototype hydrothermal
treatment system to produce a creamed apple pomace that can then be used in various applications
including a source of fibre, or as a spray-drying encapsulant. The hydrothermal treatment was
demonstrated to kill microorganisms and deactivated enzymes, as well as solubilises pectins and
soften cell walls. This process was recently showcased at the 13th International Congress of
Engineering and Food in Melbourne in
2019. An international engineering
company (Aurecon) has been engaged
to help commercialise the concept
(Yedro, Eblaghi et al. 2018, Archer,
Eblaghi et al. 2019).
Extrusion is high temperature and short
time cooking technology which is
widely used in grain-based food and
feed products. Inclusion of apple
pomace in grain-based cereals has also
been successfully demonstrated as an
option to utilise this nutritious waste
(Singha and Muthukumarappan 2018,
O’Shea, Arendt et al. 2013).
Apple and pear seeds can be separated
from pomace by flotation or sieving and
the oil recovered through traditional
extraction techniques. A recent patent
(Bhushan, Gupta et al. 2013) reports an
apparatus for the separation of seeds
from pomace through agitation and
sedimentation techniques. The fatty
acid content of apple and pear seed is
higher than in soybean and can be used
as edible oil (Yu, Li et al. 2005). The free
radical scavenging activity and
antimicrobial properties of apple seed
Figure 11. Apple flour produced in Australian apple oil can be used in pharmaceutical and
orchard by Sensory Mill. food industry (Tian, Zhan et al. 2010).
18You can also read