A search for stellar tidal streams around Milky Way analogues from the SAGA sample
←
→
Page content transcription
If your browser does not render page correctly, please read the page content below
A&A 669, L13 (2023)
https://doi.org/10.1051/0004-6361/202245003                                                                                                                Astronomy
c The Authors 2023                                                                                                                                          &
                                                                                                                                                           Astrophysics

                                                                           LETTER TO THE EDITOR

A search for stellar tidal streams around Milky Way analogues from
                           the SAGA sample
       Juan Miró-Carretero1, David Martínez-Delgado3 , Sílvia Farràs-Aloy2,9 , Maria A. Gómez-Flechoso1,10 ,
  Andrew Cooper4,5,11 , Santi Roca-Fàbrega1,6 , Konrad Kuijken9 , Mohammad Akhlaghi7 , and Giuseppe Donatiello8

       1
           Departamento de Física de la Tierra y Astrofísica, Universidad Complutense de Madrid, Plaza de las Ciencias, 28040 Madrid,
           Spain
           e-mail: juamiro@ucm.es
       2
           Universidad Internacional de Valencia (VIU), C. del Pintor Sorolla 21, 46002 Valencia, Spain
       3
           Instituto de Astrofísica de Andalucía, CSIC, Glorieta de la Astronomía, 18080 Granada, Spain
       4
           Institute of Astronomy and Department of Physics, National Tsing Hua University, Kuang Fu Rd. Sec. 2, Hsinchu 30013, Taiwan
       5
           Center for Informatics and Computation in Astronomy, National Tsing Hua University, Kuang Fu Rd. Sec. 2, Hsinchu 30013,
           Taiwan
       6
           Instituto de Astronomía, Universidad Nacional Autónoma de México, Apartado Postal 106, C. P. 22800, Ensenada, BC, Mexico
       7
           Centro de Estudios de Física del Cosmos de Aragón (CEFCA), Plaza San Juan 1, 44001 Teruel, Spain
       8
           UAI – Unione Astrofili Italiani /P.I. Sezione Nazionale di Ricerca Profondo Cielo, 72024 Oria, Italy
       9
           Leiden Observatory, Leiden University, PO Box 9513, 2300, RA Leiden, The Netherlands
      10
           Instituto de Física de Partículas y del Cosmos (IPARCOS), Fac. CC. Físicas, Universidad Complutense de Madrid,
           Plaza de las Ciencias, 1, 28040 Madrid, Spain
      11
           Physics Division, National Center for Theoretical Sciences, Taipei 10617, Taiwan
     Received 16 September 2022 / Accepted 29 December 2022

                                                                                      ABSTRACT

     Context. Stellar tidal streams are the result of tidal interactions between a central galaxy and lower mass systems such as satellite
     galaxies or globular clusters. For the Local Group, many diffuse substructures have been identified and their link to the galaxy
     evolution has been traced. However, it cannot simply be assumed that the Milky Way or M 31 are representative of their galaxy class.
     Thus, a larger sample of analogue galaxies beyond the Local Group is required to bolster a broader generalisation of the underlying
     theory.
     Aims. We want to detect and photometrically characterise stellar streams around Milky Way (MW-) analogues in the local Universe
     in order to extend the observational evidence of interactions between this class of host galaxies and their satellites. This information
     will be applicable in a more general context around future studies on galaxy formation and evolution processes.
     Methods. In the present work, we identified and analysed stellar tidal streams around MW-analogue galaxies from the SAGA sample,
     using deep images of the DESI Legacy Imaging Surveys. For this sample, we obtained a range of r-band surface brightness limit
     between 27.8 and 29 mag arcsec−2 . We measured the surface brightness and colours of the detected streams using GNU Astronomy
     Utilities software.
     Results. We identified 16 new stellar tidal streams around MW-analogue galaxies at distances between 25 and 40 Mpc. In applying a
     statistical analysis to our findings for the SAGA II galaxy sample, we obtained a frequency of 12.2% ± 2.4% for these stellar streams.
     We measured the surface brightness and colours of the detected streams and carried out a comparison to the dwarf satellite galaxies
     population around galaxies belonging to the same SAGA sample. We show that the mean colour of the streams is 0.20 mag redder
     than that of the SAGA satellites; in addition, the streams are, on average, 0.057 ± 0.021 mag redder that their progenitor (for cases
     where a likely progenitor could be identified).
     Conclusions. The frequency of streams detected around MW-analogues in the Local Universe is in agreement with previous studies.
     The difference in colour between detected streams and satellites within the SAGA host galaxy sample could be explained by a
     combination of both selection biases in the SAGA study and physical processes.
     Key words. galaxies: interactions – galaxies: dwarf – Galaxy: evolution – galaxies: photometry

1. Introduction                                                                                   Ibata et al. 2007, 2019; McConnachie et al. 2009; Shipp et al.
                                                                                                  2018) and revealed the existence of large stellar sub-structures in
Over the last two decades, studies focused on the formation and                                   the halo, which have been interpreted as observational evidence
evolution of our Galaxy have been significantly advanced by the                                   of our home Galaxy’s hierarchical formation. Furthermore, the
first generation of wide-field, digital imaging surveys and the                                   PAndAS survey (McConnachie et al. 2009) has revealed a
Gaia astrometric mission. The resulting extensive photometric                                     panoramic view of the Andromeda halo with a multitude of
databases have provided, for the first time, spectacular panoramic                                tidal streams, arcs, shells, and other irregular structures that are
views of Milky Way tidal streams (Belokurov et al. 2006;                                          possibly related to ancient merger events. These observations

                                                                                                                                                                              L13, page 1 of 8
                 Open Access article, published by EDP Sciences, under the terms of the Creative Commons Attribution License (https://creativecommons.org/licenses/by/4.0),
                                  which permits unrestricted use, distribution, and reproduction in any medium, provided the original work is properly cited.
                             This article is published in open access under the Subscribe-to-Open model. Subscribe to A&A to support open access publication.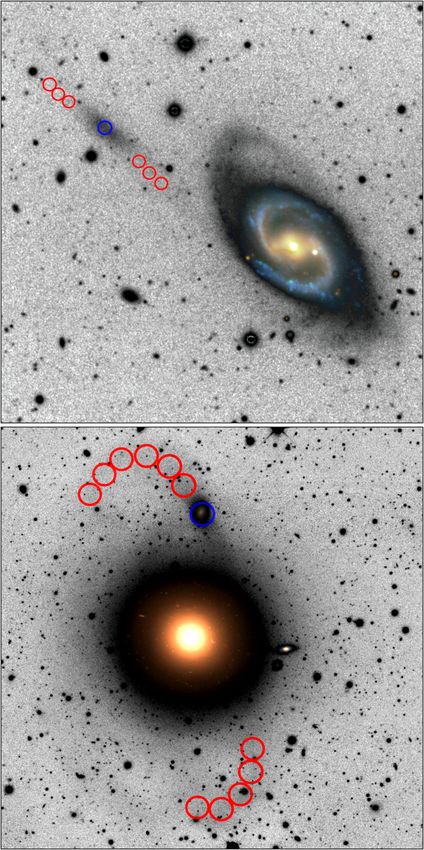
A&A 669, L13 (2023)
confirm the ΛCDM prediction that tidally disrupted dwarf
galaxies are important contributors to the formation of Galactic
stellar halos. The next generation of Galactic and extragalactic
surveys (e.g., LSST) will dissect the stellar halo structure of these
Local Group spirals with unprecedented detail, promising further
improvements in our understanding of the early formation and
merger history of the Milky Way.
While some of the known stellar streams in the Milky Way
and M 31 can be well characterised in a wide parameter space,
also when including observations of their individual stars, the
results for individual systems are not easily compared with
numerical simulations due to the stochastic nature of galaxy
assembly histories in the ΛCDM model. Although the statisti-
cal distributions, for example, of halo assembly times or satellite
luminosities, are well defined for galaxies selected within a nar-
row range of stellar mass and/or halo mass, individual systems
may show large deviations from the mean (Sotillo-Ramos et al.
2022). To overcome this limitation, a search for streams and
other merger debris in a larger sample of Milky Way-like
galaxies is required. This is a daunting task, as due to their
extremely faint surface brightness, the observed frequency of
stellar streams is very low, even in ultra-deep imaging surveys.
For further details, we refer to Hood et al. (2018) for a modern
review.
In this paper, we set our focus only on stellar tidal streams,
arising from the tidal disruption of dwarf galaxies by more mas-
sive systems. We exploit the deep, wide-field imaging from
the DESI Legacy Surveys (Dey et al. 2019) to systematically
explore the frequency and photometric properties of streams in
the stellar halos of 181 Milky Way analogue (MW-analogue)
targets previously selected for the Satellites Around Galactic
Analogs (SAGA) survey (Geha et al. 2017; Mao et al. 2021).
2. Methodology
2.1. Image sample
The SAGA survey’s Stage I (Geha et al. 2017) and Stage II
(Mao et al. 2021) define a parent sample of Milky Way-like
host galaxies with absolute K-band magnitude in the range
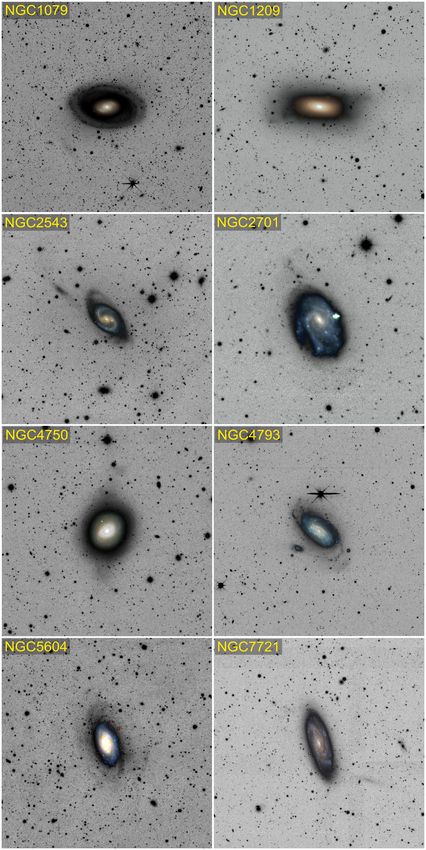
−23 < MK < −24.6 mag, approximately equivalent to the Fig. 1. Sample of images showing stellar streams around the galaxies
stellar mass range 1010 < M? < 1011 M . The sample is listed in Table A.1. For the purposes of illustration, shallower colour
subject to environmental constrains by excluding close pairs images (also from the DESI Legacy Imaging Surveys) have been super-
of hosts, defined by a host-satellite K-band magnitude differ- imposed on the saturated central region of each host galaxy.
ence of ∆K < 1.6 mag. The SAGA Stage I survey reports
on 27 satellites around 8 MW-analogue hosts and Stage II,
with an increased sample size, provides follow-up spectroscopy pipeline uses a flexible spline sky model which can over-
results for 127 satellites around 36 MW-analogue hosts. Here, subtract the outskirts of large galaxies. Instead, we subtracted
we base our study on the SAGA II parent sample, includ- the sky background from each CCD using a custom algo-
ing galaxies at distances 25 < d < 40.75 Mpc. Further rithm, which preserves the low-surface-brightness galactic fea-
details of the SAGA Stage II parent sample can be found in tures of interest. We first minimized the relative background
Mao et al. (2021). levels between the overlapping CCDs in each band, and
We inspected the images of the resulting sample of then, after detecting and masking sources as well as Gaia
181 galaxies using the Legacy Survey Sky Viewer1 and selected stars, we subtracted the sigma-clipped median in the outer
a subset of targets for which stellar tidal streams could be half of the image cutout (see Martinez-Delgado et al. 2021
identified by eye for further analysis. From this visual inspec- for details). In Appendix B, we describe the further pro-
tion, a total of 22 galaxies with detected streams were selected. cessing of the images in order to measure the photometry
Image cutouts of these selected targets were then computed parameters.
from the raw data from the DESI Legacy Imaging Surveys The resulting wide-field images reach surface brightness lim-
(Dey et al. 2019; LS), using a modified version of the LS its as faint as 29 mag arcsec−2 in the r band (see Sect. 2.2),
reduction pipeline Legacypipe. This alters the way the image ensuring a sufficient image depth to be able to measure
backgrounds (“sky models”) are computed. By default, this very faint tidal structures. The images analysed in this work
are listed in Table A.1. Examples of them are shown in
1
https://www.legacysurvey.org/viewer Fig. 1.
L13, page 2 of 8The Authors: A search for stellar tidal streams around Milky Way analogues from the SAGA sample
surface brightness limit of the images for the g and r passbands
following the approach of Román et al. (2020), that is, we report
the value corresponding to +3σ of the sky background in an area
of 100 arcsec2 . Table A.1 reports the surface brightness limit
for the r band. The images in this band are generally the ones
with the largest detection area and are mostly free of stacking
or reduction artifacts; they also provide a conservative, brighter
limit value with regard to the g band.
We measured the surface brightness and colours on apertures
placed manually on the stream, closely following the detection
map of the stream generated by NoiseChisel, once all fore-
ground and background sources were masked. Regions where
the stream surface brightness was judged to be significantly
blended with light from the host galaxy were avoided. As an
illustration of the method, Fig. 2 shows an example of a stream
and the apertures on which the measurement of surface bright-
ness and colour (g − r)0 was performed. We obtained a represen-
tative surface brightness and colour for each stream by taking
the mean of the individual aperture measurements. The method
we followed to carry out the photometric analysis and estimat-
ing the errors, along with some important features of Gnuastro
in the context of such an analysis, is explained in more detail in
Appendix B.
3. Results
Table A.1 shows the results of our photometric analysis. We
identified tidal streams around 22 galaxies from the sample of
181 MW-analogues. This suggests that 12.2% ± 2.4% of the
SAGA II galaxies have a stellar stream in the halo, for a r-band
surface brightness limit range of our images between 27.8 and
29 mag arcsec−2 (see Table A.1). This implies that (with a 95%
confidence level) the percentage of typical SAGA sample halos
that have readily observable stellar streams is between 7.4% and
16.9%. These values correspond to the limits of the confidence
interval for the proportion of a binomial distribution with a 95%
confidence level. This result is similar to what was reported by
Morales et al. (2018) for their systematic assessment of the fre-
Fig. 2. Examples of our photometry measurement method, showing quency of tidal streams around a different sample of MW-like
the apertures placed on the stellar streams around NGC 5812 and galaxies in the Local Universe. They reported a total of 28 tidal
NGC 2543, along with the suspected progenitors, to measure their sur-
face brightness and colours.
streams from a sample of 297 galaxies, providing a conservative
estimate that only ∼10% of galaxies show evidence of diffuse
features that may be linked to satellite accretion events.
2.2. Data analysis The measured ranges of stream surface brightness are
25.66 < µg < 28.71 and 25.23 < µr < 27.98 mag arcsec−2 .
We carried out the photometric analysis with GNU Astron- The detection significance index (DSI), as defined in
omy Utilities (Gnuastro)2 . We made all the measurements Martinez-Delgado et al. (2021), is calculated by comparing
by applying Gnuastro’s MakeCatalog subroutine on the the measurements for a given aperture with the median and
sky-subtracted images generated by Gnuastro’s NoiseChisel standard deviation of N random measurements in pixels with
(Akhlaghi & Ichikawa 2015; Akhlaghi 2019). no source detection3 . The ‘reference’ column in Table A.1
Our photometric analysis includes measurements of surface indicates whether each stream has been previously reported in
brightness in the LS r and g passbands for each stream, as well as the literature or whether it is reported for the first time in this
for their candidate progenitor satellite (when identified). Taking work.
advantage of the depth and photometric quality of the LS sur- Figure 3 compares the (g − r)0 colour distribution of the
vey images, we also measured the (g − r)0 colour of the streams. stellar streams identified in Table A.1 (shown in red) to that
The progenitors are first tentatively identified by visual inspec- of the 127 spectroscopically confirmed satellite galaxies from
tion, tracing apparent overdensities within the stream, and are the 36 SAGA systems presented in Mao et al. (2021) (shown in
then confirmed by measuring their colour (g − r)0 and compar- blue). The hypothesis contrast of normality shows that the null
ing it with the corresponding colour of the stream. This compar- hypothesis (which is that the colour distributions come from a
ison, applied over many images in this and other works of the Gaussian distribution) cannot be rejected with a 99% confidence
authors, has proven reliable in discriminating between stream- level. We therefore fit Gaussian functions to each distribution,
related overdensities and those that are not. We measured the
3
https://www.gnu.org/software/gnuastro/manual/html_
2
http://www.gnu.org/software/gnuastro node/Upper-limit-magnitude-of-each-detection.html
L13, page 3 of 8A&A 669, L13 (2023)
ing Survey grz images with Gnuastro, a novel tool developed
with emphasis on the detection of faint structures. The mea-
sured ranges of stream surface brightness are 25.66 < µg <
28.71 and 25.23 < µr < 27.98 mag arcsec−2 .
– We suggest the frequency of streams for the SAGA sample to
be 12.2% ± 2.4%, for a r-band surface brightness limit range
of our images between 27.8 and 29 mag arcsec−2 , in line with
previous studies.
– We carried out a statistical comparison of (g − r)0 colours for
the detectable stream and satellite populations in our sample,
finding that the typical colours of the streams we detected are
significantly redder, on average.
– In those systems where a progenitor of the stream could be
identified by visual inspection and photometric analysis of
the images, we find the stream is on average slightly redder
than the progenitor.
Fig. 3. Histogram showing the distribution of the average (g − r)0
colour of stellar streams around 22 galaxies from our sample (listed in We suggest that the differences we find between the stream and
Table A.1), together with the same colour of the 127 satellite galaxies satellite colour distributions may be explained by a combination
from the 36 SAGA systems sample.
of selection bias and physical effects. Here, we provide a brief
summary of possible explanations. We defer a more detailed dis-
finding means and standard deviations of 0.59 ± 0.12 mag for the cussion that is outside of the scope of this Letter to follow-up
streams and 0.39 ± 0.13 mag for the SAGA satellites. The mean works.
colour of the streams is therefore 0.20 mag redder than that of The SAGA survey offers a sample of candidate satellites
the SAGA satellites. An equality of means hypothesis test shows based on catalogue photometry and follows up on a subset
that the null hypothesis can be rejected with a statistical confi- of these with multi-object fibre spectrographs to obtain red-
dence level larger than 99.999% (p-value < 10−10 ) and the alter- shifts. Extremely compact (M 32-like) candidates did not receive
native hypothesis that mean colour of the streams is redder than such a follow-up (Geha et al. 2017) and, although such objects
the mean colour of satellites can be accepted. The (g−r)0 colours tend to be red, relatively few are known. More significantly, as
we find are similar to those obtained for the streams described reported in Mao et al. (2021), following from Fig. 6, redshifts
in the proof-of-concept study of Martinez-Delgado et al. (2021), are more difficult to obtain for candidates with a low mean-
who reported a mean and standard deviation of 0.66 ± 0.12 mag. surface-brightness, which also tend to be redder. More generally,
In approximately 36% of the streams in our sample, we have in the regime of satellite dwarf galaxies, both surface bright-
identified a highly likely progenitor by visual inspection. This ness and colour are (broadly) correlated with total luminosity.
allows us to explore similarities and differences in the stellar At a fixed size, the most luminous objects (and hence those
populations of satellites and their streams, including the presence with a higher surface brightness) tend to be those that are star-
of population gradients along the streams. As shown in Fig. 2 forming, or at least relatively younger. This naturally makes
for the cases of NGC 2543 and NGC 5812, we placed aper- them bluer. Mao et al. (2021) argue that this redshift incom-
tures on the likely progenitors as well as along the tidal features. pleteness is a weak effect that does not significantly bias the
Table A.2 compares the (g − r)0 colour of the stream (averaged distribution of star formation rates (i.e., colours) in the spec-
over the apertures as described in Sect. 2.2) with that measured troscopic sample. However, the completeness of the initial tar-
in an aperture placed on the suspected progenitor. We see a sig- get catalogue may also be important. Font et al. (2022) explore
nificant difference in colour for the streams around NGC 2543, this issue in detail through comparison to the RTEMIS suite
NGC 4793, and NGC 5812, with the stream redder than its likely of cosmological simulations. They suggest that the photomet-
progenitor by 0.21, 0.16, and 0.14 mag, respectively. For the rest ric SAGA candidate sample may have a significant bias against
of streams where a progenitor is suspected, the colour differ- low-surface-brightness satellites and that this bias has a much
ence is within the uncertainties of our colour measurement – stronger effect on the resulting colour distribution. Font et al.
and therefore is not significant. To test whether the differences (2022) speculate that this bias arises from the effect mentioned
observed in our sample are statistically significant or not, we above: recently-accreted star-forming satellites have a higher
performed a hypothesis test of the difference between the stream surface brightness than their redder counterparts at fixed lumi-
and the progenitor colours. Thus, we have obtained that streams nosity, and are therefore more likely to be targeted by SAGA
are, on average, 0.057 ± 0.021 mag redder that their progenitor, (and more likely to have a successful redshift if observed). For
with a confidence level of >99.99%. example, we refer to Fig. 2 in Font et al. (2022), which shows
the separation between star forming satellites with high surface
brightness and quenched satellites at similar magnitudes with
4. Conclusions lower surface brightness. In making a comparison to a separate
survey of satellites in the Local Volume (Exploration of Local
The main conclusions of this study are as follows: VolumE Satellites, ELVES, see Carlsten et al. 2021), they find
– We detected 16 previously unreported streams in MW-like evidence that fainter galaxies in SAGA are biased towards bluer
host galaxies from the SAGA sample at distances between colours.
25 and 40 Mpc (see Table A.1, column labelled ‘reference’). However, even with the small sample of stream colours
– We measured the surface brightness and colours of presently available, we find at least two reasons to consider
22 streams (including the new discoveries) in MW-like hosts physical explanations for the colour differences in addition
of the same SAGA sample by analysing DESI Legacy Imag- to selection effects. First, Font et al. (2022) find the potential
L13, page 4 of 8The Authors: A search for stellar tidal streams around Milky Way analogues from the SAGA sample
selection bias in SAGA mostly affects the fainter satellite mag- modified Legacypipe code to produce the images used here. DMD acknowl-
nitudes (MV > −12), and that the colours of brighter (systemat- edges financial support from the Talentia Senior Program (through the incentive
ically bluer) satellites are not strongly biased. Although we can- ASE-136) from Secretaría General de Universidades, Investigación y Tec-
nología, de la Junta de Andalucía. DMD acknowledges funding from the State
not yet quantify the total luminosity of the streams in our sample, Agency for Research of the Spanish MCIU through the “Center of Excellence
it is likely that readily detectable streams have some bias towards Severo Ochoa” award to the Instituto de Astrofísica de Andalucía (SEV-2017-
the brighter end of the luminosity function of disrupted progen- 0709) and project (PDI2020-114581GB-C21/ AEI / 10.13039/501100011033).
itors (albeit with large uncertainty due to the wide variety of MAGF acknowledges financial support from the Spanish Ministry of Science and
Innovation through the project PID2020-114581GB-C22. SRF acknowledges
stream morphology and viewing angle). If we were to compare financial support from the Spanish Ministry of Economy and Competitive-
the streams only to the brighter SAGA satellites, rather than the ness (MINECO) under grant number AYA2016-75808-R, AYA2017-90589-
full sample, the discrepancy in colour would be reinforced. Put REDT and S2018/NMT-429, and from the CAM-UCM under grant number
another way, we detect no streams as blue as the bluest SAGA PR65/19-22462. SRF acknowledges support from a Spanish postdoctoral fel-
satellites. lowship, under grant number 2017-T2/TIC-5592. APC is supported by the
Taiwan Ministry of Education Yushan Fellowship and Taiwan National Sci-
Secondly, the difference in colour seen in the small num- ence and Technology Council grant 109-2112-M-007-011-MY3. The photom-
ber of stream-progenitor pairs in our sample suggests colour etry analysis in this work was partly done using GNU Astronomy Utilities (Gnu-
gradients may contribute alongside selection-driven differences astro, ascl.net/1801.009) version 0.17. Work on Gnuastro has been funded by
between the stream and satellite samples (and other population- the Japanese MEXT scholarship and its Grant-in-Aid for Scientific Research
(21244012, 24253003), the European Research Council (ERC) advanced grant
level effects, such as different average ages). Such gradients 339659-MUSICOS, and from the Spanish Ministry of Economy and Competi-
may be established either before disruption or during the dis- tiveness (MINECO) under grant number AYA2016-76219-P. The Leiden Obser-
ruption process. A wide variety of physical processes could vatory has provided facilities and computer infrastructure for carrying out part
create gradients through their effects on the relative timescales of this work. MA acknowledges the financial support from the Spanish Ministry
of gas removal (due to ejection and ram pressure stripping), of Science and Innovation and the European Union - NextGenerationEU through
the Recovery and Resilience Facility project ICTS-MRR-2021-03-CEFCA.
star formation in residual cold gas, and tidal stripping. At the
most basic level, complete tidal disruption will prevent fur-
ther star formation, leading to the systematic reddening of References
dynamically older streams. Cosmological simulations are nec-
Akhlaghi, M. 2019, ASP Conf. Ser., 521, 299A
essary to make quantitative predictions for colour distribu- Akhlaghi, M., & Ichikawa, T. 2015, ApJS, 220, 1
tions, accounting for the range of satellite star formation his- Belokurov, V., Zucker, D. B., Evans, N. W., et al. 2006, ApJ, 642, L137
tories, gas fractions and orbits, and variations in the satellite Carlsten, S. G., Greene, J. E., Greco, J. P., et al. 2021, ApJ, 922, 267
accretion rate and disruption efficiency over the range of Dey, A., Schlegel, D. J., Lang, D., et al. 2019, AJ, 157, 168
dark matter halo masses that may correspond to the SAGA Font, A. S., McCarthy, I. G., Belokurov, V., et al. 2022, MNRAS, 511, 1544
Geha, M., Wechsler, R. H., Mao, Y.-Y., et al. 2017, ApJ, 847, 4
sample. Hood, C. E., Kannappan, S. J., Stark, D. V., et al. 2018, ApJ, 857, 144
To make further progress, we are currently constructing a Ibata, R., Martin, N. F., Irwin, M., et al. 2007, ApJ, 671, 1591
larger sample of galaxies within the Stellar Streams Legacy Sur- Ibata, R., Malhan, K., & Martin, N. 2019, ApJ, 872, 152
vey (Martinez-Delgado et al. 2021). This sample will comprise Knierman, K. A., Scowen, P., Veach, T., et al. 2013, ApJ, 774, 125
Ludwig, J. 2014, PhD Thesis, Universität Heidelberg, Germany
more than 800 Milky Way-like galaxies. By analysing this sam- Mao, Y.-Y., Geha, M., Wechsler, R. H., et al. 2021, ApJ, 907, 85
ple using the techniques presented in this paper, we will be able Martinez-Delgado, D., Cooper, A. P., Roman, J., et al. 2021, A&A, in press
to more robustly test our conclusions and carry out meaning- https://doi.org/10.1051/0004-6361/202245011
ful comparisons to physical models of satellite star formation, McConnachie, A. W., Irwin, M. J., Ibata, R. A., et al. 2009, Nature, 461, 66
accretion and disruption. Miskolczi, A., Bomans, D. J., & Dettmar, R.-J. 2011, A&A, 536, A66
Morales, G., Martínez-Delgado, D., Grebel, E. K., et al. 2018, A&A, 614,
A143
Acknowledgements. We want to thank to Yao-Yuan Mao, Marla Geha and Risa Román, J., Trujillo, I., & Montes, M. 2020, A&A, 644, A42
Wechsler for providing the original SAGA sample for this paper and useful Shipp, N., Drlica-Wagner, A., Balbinot, E., et al. 2018, ApJ, 862, 114
comments. We also thank Dustin Lang and John Moustakas for running the Sotillo-Ramos, D., Pillepich, A., Donnari, M., et al. 2022, MNRAS, 516, 5404
L13, page 5 of 8A&A 669, L13 (2023)
Appendix A: Tables
Table A.1. Photometry of stellar streams around MW analogue galaxies.
Host D µr,limit DSIstream hµg istream hµr istream h(g − r)0 istream Reference
maximum average
Mpc [mag arcsec−2 ] σ σ [mag arcsec−2 ] [mag arcsec−2 ] [mag]
NGC 0636 29.2 28.88 45.58 31.86 26.66 ± 0.03 25.86 ± 0.02 0.75 ± 0.04 (∗)
NGC 1079 31.4 28.78 15.24 11.31 27.51 ± 0.05 27.00 ± 0.05 0.48 ± 0.07 (∗)
NGC 1209 38.3 28.91 8.85 4.71 28.71 ± 0.05 27.98 ± 0.03 0.68 ± 0.07 (∗)
NGC 1309 34.3 28.76 24.42 23.02 26.26 ± 0.02 25.66 ± 0.02 0.56 ± 0.02 (1)
NGC 2460 34.8 28.81 10.39 8.06 27.50 ± 0.05 26.57 ± 0.04 0.85 ± 0.06 (3)
NGC 2543 37.6 28.55 10.18 9.00 26.66 ± 0.06 25.86 ± 0.06 0.72 ± 0.08 (∗)
NGC 2648 32.7 28.19 22.70 16.62 26.49 ± 0.03 25.96 ± 0.04 0.49 ± 0.05 (∗)
NGC 2701 36.5 28.58 6.63 5.55 26.85 ± 0.07 26.47 ± 0.08 0.37 ± 0.10 (∗)
NGC 2782 39.9 28.51 28.69 20.55 26.14 ± 0.01 25.63 ± 0.02 0.48 ± 0.02 (4)
NGC 3614 36.1 28.57 9.79 6.64 27.78 ± 0.06 27.07 ± 0.05 0.68 ± 0.08 (∗)
NGC 3689 39.8 28.00 10.75 6.45 27.55 ± 0.05 26.82 ± 0.05 0.56 ± 0.07 (1)
NGC 4378 37.2 28.21 24.06 22.17 27.24 ± 0.03 26.53 ± 0.03 0.68 ± 0.04 (∗)
NGC 4750 27.7 28.57 54.58 35.07 26.81 ± 0.02 26.30 ± 0.03 0.48 ± 0.03 (∗)
NGC 4793 36.3 28.11 20.02 18.04 26.16 ± 0.04 25.60 ± 0.06 0.55 ± 0.07 (∗)
NGC 4799 40.1 27.93 8.49 6.98 26.65 ± 0.04 26.20 ± 0.07 0.41 ± 0.08 (∗)
NGC 5297 35.5 28.55 28.00 18.58 26.35 ± 0.04 25.70 ± 0.04 0.63 ± 0.05 (∗)
NGC 5493 40.05 28.30 32.96 28.06 26.38 ± 0.02 25.69 ± 0.02 0.63 ± 0.003 (∗)
NGC 5604 39.0 28.18 12.29 9.93 26.35 ± 0.05 25.81 ± 0.05 0.46 ± 0.07 (∗)
NGC 5631 31.7 28.54 12.88 10.01 27.60 ± 0.04 26.98 ± 0.04 0.59 ± 0.06 (∗)
NGC 5750 25.3 28.23 29.41 27.37 27.38 ± 0.05 26.69 ± 0.04 0.63 ± 0.06 (2)
NGC 5812 27.2 28.38 55.09 30.73 26.54 ± 0.03 25.67 ± 0.02 0.77 ± 0.04 (∗)
NGC 7721 31.8 27.87 19.44 13.24 25.79 ± 0.03 25.23 ± 0.04 0.53 ± 0.05 (3)
Notes. Column 1 gives the name of the host galaxy and Col. 2 its distance. Column 3 shows the surface brightness limit in the r band calculated
in this work. Note: the image surface brightness limit is in itself the 3σ value of the sky surface brightness measured in the non-detection zone
of the image and extrapolated to an aperture of 100 arcsec2 ; the standard deviation of the sky background value across the image is within
0.1 mag arcsec−2 for most of the images, in a few cases being between 0.1 and 0.2 mag arcsec−2 . Columns 4 and 5 show the detection significance
index, as defined in Martinez-Delgado et al. (2021). Cols. 6–8 show the surface brightness in the g passband, in the r passband, and the (g − r)0
colour of the streams, averaged over all the apertures placed on the stream; Col. 9 indicates whether the stream has been reported for the first time
in this work, indicated by (∗), or in one of the following previous works: (1) Martinez-Delgado et al. (2021); (2) Morales et al. (2018); (3) Ludwig
(2014); (4) Knierman et al. (2013).
Table A.2. Comparison between the average (g − r)0 colour of each stream and the corresponding colour of its visually identified progenitor.
Host h(g − r)0 istream h(g − r)0 iprogenitor ∆
[mag] [mag] [mag]
NGC 2543 0.72 ± 0.08 0.51 ± 0.02 0.21 ± 0.08
NGC 2648 0.49 ± 0.05 0.56 ± 0.003 −0.07 ± 0.05
NGC 3614 0.68 ± 0.08 0.65 ± 0.08 0.03 ± 0.11
NGC 3689 0.56 ± 0.07 0.59 ± 0.02 −0.03 ± 0.07
NGC 4793 0.55 ± 0.07 0.39 ± 0.01 0.16 ± 0.07
NGC 5297 0.63 ± 0.05 0.64 ± 0.004 −0.01 ± 0.05
NGC 5750 0.63 ± 0.06 0.57 ± 0.02 0.06 ± 0.06
NGC 5812 0.77 ± 0.04 0.63 ± 0.005 0.14 ± 0.04
L13, page 6 of 8The Authors: A search for stellar tidal streams around Milky Way analogues from the SAGA sample
Appendix B: Photometry Measurement Method We measured the surface brightness and colours on aper-
tures, placed manually following closely the detection map of
For the detection of the streams (and all other sources of the stream generated by NoiseChisel, once all foreground
the images), we use NoiseChisel, part of the state-of-the- and background sources were masked. A succession of cir-
art Gnuastro software, designed specifically to detect low- cular apertures allows to measure colour gradients and can
surface-brightness structures. NoiseChisel also calculates the easily adapt to the stream contour; however, in a few cases
background sky and subtracts it from the input image. The sub- where the stream shape allowed, larger polygonal apertures were
tracted background sky level is not a constant value over the used to reduce the measurement error. Table B.1 shows the
image; the sky is assumed to be constant only on tiles of a
dimensions of the apertures for each stream. The diameter of
configurable number of pixels (typically 40x40), which form a
the circular apertures is as close as possible to the perceived
tessellation of many tiles over the image. In this way, the envi-
width of the stream. Regions where the stream surface bright-
ronment of the stream is taken into consideration for the cal-
ness was judged to be significantly blended with light from
culation of the sky background to be subtracted locally. For
the host galaxy or were significantly obscured by clumps were
a complete introduction to the robustness of this method, we
avoided.
refer to the corresponding chapter of the Gnuastro book 4 .
Then, segmentation is carried out by Gnuastro’s Segment Within each (circular or polygonal) aperture, the flux is
package, which labels all the sources detected. The fore- measured over every pixel and then integrated. The inte-
ground and background sources are identified as clumps and are grated magnitude and the surface brightness measurements
masked before the photometry measurements are carried out by over the area of the aperture, are derived from the flux mea-
MakeCatalog, another package belonging to Gnuastro. surement. Table B.1 shows the average over all the aper-
Regarding the modelling and subtraction of the host galaxy tures placed on the stream of the galactic extinction-corrected
halo, this approach was applied earlier in this study by modelling integrated magnitude for the bands g and r. The magnitude
the host halo with a Sersic profile. However, due to the irreg- error is calculated with Merror = 2.5 / S /N ln(10) 5 ; as the
ular shape of the spiral host galaxies analysed, this technique aperture area increases, the signal-to-noise ratio (S/N) also
was difficult to apply, particularly for hosts that are not face-on, increases, so the magnitude error decreases. This is differ-
and had the effect of over-subtracting the diffuse area around the ent from the flux error in each pixel (which increase with
host; this negatively impacted the photometry measurement of the square root of the area). However, signal increases lin-
the stream. Instead, we actually estimated the zone of influence early with area, so overall, the S/N increases as the area grows
for every host by measuring the gradient of the surface bright- larger.
ness in its faint surroundings and masking the host to the point The colour (g − r)0 is given for each aperture by the differ-
of transition to a flat gradient, making sure the apertures where ence between the galactic extinction-corrected magnitudes in the
the stream photometry is measured lie outside of such a zone. respective bands g and r in that aperture. Then the colour (g − r)0
This is only relevant for those streams that are close to the out- of a stream (as given in Table A.1) is the average of that colour
skirts of the host galaxy. in all the apertures placed on the stream.
4 5
https://www.gnu.org/software/gnuastro/manual/html_ https://www.gnu.org/software/gnuastro/manual/html_
node/Skewness-caused-by-signal-and-its-measurement. node/Magnitude-measurement-error-of-each-detection.
html html
L13, page 7 of 8A&A 669, L13 (2023)
Table B.1. Names of stream hosts and their coordinates are shown in columns 1-3. Columns 4 and 5 show the average over all the apertures placed
on the stream of the galactic extinction-corrected integrated magnitude for the bands g and r. Column 6 shows the number and the size of the
apertures used to measure the photometric parameters.
Host RA DEC hg0 iaperture hr0 iaperture Area
deg deg [mag] [mag] arcsec2
NGC0636 24.777227 -7.512649 20.53 ± 0.03 19.76 ± 0.02 18 × 304
NGC1079 40.934733 -29.003346 20.93 ± 0.05 20.44 ± 0.05 4 × 447
NGC1209 46.512529 -15.611249 19.55 ± 0.05 18.86 ± 0.03 3 × 4229
NGC1309 50.527313 -15.400056 19.66 ± 0.02 19.09 ± 0.02 3 × 461
NGC2460 119.21775 60.349361 21.26 ± 0.05 20.41 ± 0.04 5 × 333
NGC2543 123.241359 36.25462 22.10 ± 0.06 21.37 ± 0.06 4 × 59
NGC2648 130.665883 14.285559 20.07 ± 0.03 19.57 ± 0.04 2 × 372
NGC2701 134.773869 53.771657 22.03 ± 0.07 21.65 ± 0.08 6 × 75
NGC2782 138.521169 40.113726 19.22 ± 0.01 18.73 ± 0.02 15 × 609
NGC3614 169.588899 45.748213 21.15 ± 0.06 20.46 ± 0.05 6 × 470
NGC3689 172.046015 25.66108 19.93 ± 0.05 19.37 ± 0.05 1 × 877
NGC4378 186.325235 4.924945 19.45 ± 0.03 18.75 ± 0.03 2 × 1246
NGC4750 192.530041 72.874472 19.82 ± 0.02 19.34 ± 0.03 4 × 750
NGC4793 193.669165 28.938744 21.38 ± 0.04 20.82 ± 0.05 6 × 83
NGC4799 193.814721 2.896617 20.90 ± 0.04 20.48 ± 0.07 3 × 180
NGC5297 206.598645 43.872219 20.87 ± 0.04 20.23 ± 0.03 2 × 150
NGC5493 212.872404 -5.043581 19.95 ± 0.02 19.30 ± 0.02 7 × 379
NGC5604 216.178326 -3.212203 21.12 ± 0.05 20.65 ± 0.05 3 × 111
NGC5631 216.638694 56.582627 20.48 ± 0.04 19.88 ± 0.04 3 × 707
NGC5750 221.546359 -0.222971 19.97 ± 0.05 19.33 ± 0.04 3 × 849
NGC5812 225.232043 -7.457279 19.91 ± 0.03 19.13 ± 0.02 15 × 475
NGC7721 354.702194 -6.51799 20.27 ± 0.03 19.74 ± 0.04 1 × 146
L13, page 8 of 8You can also read