Surface water extent dynamics from three periods of continuous Landsat time series; subregional differences across Argentine plains - PoliPapers
←
→
Page content transcription
If your browser does not render page correctly, please read the page content below
Recibido: 31/08/2020                                                                                   REVISTA DE TELEDETECCIÓN
Aceptado: 09/06/2021                                                                             Asociación Española de Teledetección
                                                                                                                         (2021) 58, 131-145
                                                                                                                            ISSN 1133-0953
                                                                                                                           EISSN 1988-8740
                                                                                                   https://doi.org/10.4995/raet.2021.14263

CASO PRÁCTICO

Surface water extent dynamics from three periods of
continuous Landsat time series; subregional differences
across Argentine plains
Vanina S. Aliaga             1*
                                  , Maria C. Piccolo1,2, Gerardo M.E. Perillo1,3
1
    Instituto Argentino de Oceanografía - Consejo Nacional de Investigaciones Científicas y Técnicas (IADO-CONICET),
    Florida 8000 (Camino La Carrindanga km 7,5), (804) Bahía Blanca, Argentina.
2
    Departamento de Geografía y Turismo, Universidad Nacional del Sur (UNS), 12 de octubre y San Juan (4to. Piso), (8000)
    Bahía Blanca, Argentina.
3
    Departamento de Geología. Universidad Nacional del Sur (UNS). Av. Alem 1253, (cuerpo B´ - 2º Piso), (8000) Bahía
    Blanca, Argentina.

Abstract: The Pampean region in Argentina is an extensive plain characterized by abundant shallow lakes that
fulfill many environmental, ecological, and social functions. This study aims to detect the multiannual lake area
changes in this region during 2001-2009 using remote sensing, including lakes as small as ≥10,000 m2 or 1 ha.
Landsat scenes of the wet (2008-2009), normal (2006), and dry (2008-2009) seasons were obtained, and using
remote sensing techniques, the number and area of shallow lakes were calculated. The spatiotemporal variation
of shallow lakes was studied in different climate periods in eight singular subregions. Spatial associations
between annual precipitation and lake number and area were analyzed through the development of a Geographic
Information System (GIS) at a subregional scale. During the study period the total lake area in the Pampean region
decreased by 5257.39 km2 (62 %), but each subregion showed different responses to climatic events. In seven
of them, the differences between climate periods prove to be statistically significant (P>0.01). The relationship
between precipitation and lake number and area revealed the domain of positive association. We conclude that
climate factors play a dominant role in lake changes across the Pampean plains. However, other factors such as
origin, topographic and edaphic characteristics intensify or mitigate changes in surface hydrology.
Key words: Landsat, surface water dynamic, climate variability, Pampean lakes, Argentina.

Dinámica de aguas superficiales de tres períodos continuos de Landsat; diferencias subregionales
en llanunas argentinas
Resumen: La Región Pampeana en Argentina es una extensa planicie caracterizada por abundantes lagunas que
cumplen numerosas funciones ambientales, ecológicas y sociales. Este estudio tiene como objetivo detectar los
cambios plurianuales del área lagunar en esta región durante el período 2001-2009 utilizando la teledetección,
incluidos lagos tan pequeños como ≥ 10.000 m2 o 1 ha. Se obtuvieron escenas Landsat de las estaciones húmeda
(2008-2009), normal (2006) y seca (2008-2009) y, mediante técnicas de teledetección, se calculó el número
y el área de las lagunas. Se estudió su variación espacio-temporal en diferentes períodos climáticos en ocho

To cite this article: Aliaga, V.S., Piccolo, M.C., Perillo G.M.E. 2021. Surface water extent dynamics from three periods of continuous Landsat time
series; subregional differences across Argentine plains. Revista de Teledetección, 58, 131-145. https://doi.org/10.4995/raet.2021.14263
*
  Corresponding author: valiaga@iado-conicet.gob.ar
Attribution-NonCommercial-ShareAlike 4.0 International (CC BY-NC-SA 4.0)                                                                              131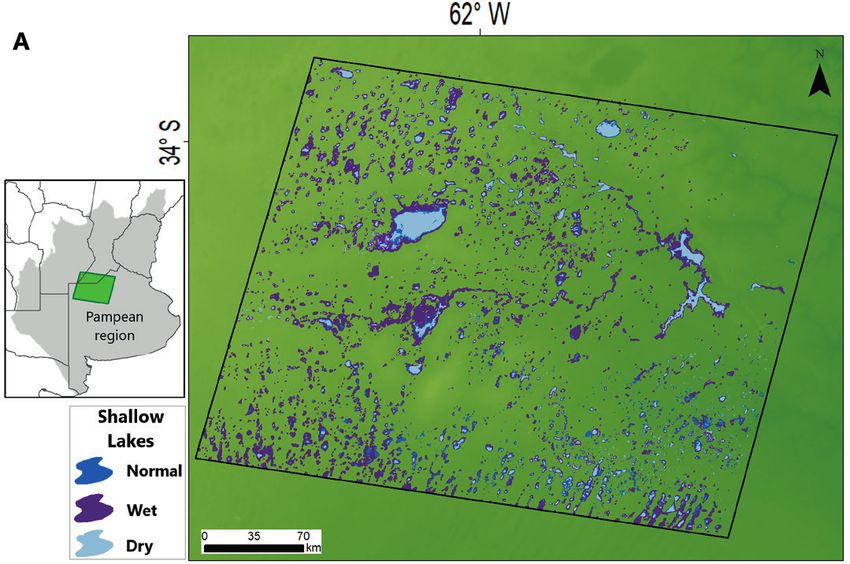
Aliaga et al.

      subregiones singulares. Se analizaron las correlaciones espaciales entre la precipitación anual y el número y el
      área de los lagos mediante el desarrollo de un Sistema de Información Geográfica (SIG). Durante el período de
      estudio el área total de lagos en la región pampeana disminuyó en 5.257,39 km2 (62 %), pero cada subregión
      mostró diferentes respuestas a los eventos climáticos. En siete de ellos, las diferencias entre periodos climáticos
      resultan estadísticamente significativas (P>0,01). La relación entre la precipitación con el número y área de las
      lagunas reveló el dominio de asociaciones positivas. Si bien el clima juega un papel dominante en los cambios en
      las lagunas de planicie, otros factores, como el origen, las características topográficas y edáficas, intensifican o
      mitigan los cambios en la hidrología superficial.
      Palabras clave: dinámica de aguas superficiales, variabilidad climática, lagunas Pampeanas, Argentina.

      1. Introduction                                             Tibetan Plateau during the last four decades
                                                                  due to increased precipitation and cryosphere
      Surface water dynamics have an essential role in            contributions to water balance. This contrasts
      physical, geochemical and biological processes              with disappearing lakes and drastic shrinkage of
      that affect biota, water supply, transport, and             lake areas on the adjacent Mongolian Plateau.
      energy balance (Pricope, 2013; Vincent et al.,              It showed that two adjacent plateaus have been
      2013). Small fluctuations in weather patterns               changing in opposite directions in response to
      affect the behavior of inland waters, although the          climate change, which suggests that there would
      specific effects vary according to their ecosystem          be other factors affecting the dynamics of lakes.
      and morphology. Hydrological processes on                   These studies show the multiple roles of regional
      extensive plains differ considerably from those that        climate and water cycles and provide useful
      characterize the mountain areas, mainly due to the          information for planning water resources in these
      low morphological energy (Zhang et al., 2017; Deng          fragile landscapes (Zhang et al., 2017).
      et al., 2018). In plain areas, water moves as a stratum
      or slightly channeled, mobilized by the local slope,        In the Pampean region, Argentina, shallow lakes
      rain, and wind direction. Temporary floods allow the        are a prominent feature of the landscape and
      superficial accumulation of salt and the development        primary areas of the ecosystem balance. Deflation
      of swamps or puddles (Hu et al., 2017; Kumar et al.,        basins and eolian depression harbor permanent
      2017).                                                      and temporary lakes that function as recharge or
                                                                  discharge points for groundwater (Gerten and
      Remote sensing is widely used for mapping surface           Adrian, 2000, 2001; Quirós et al., 2002). This
      water extent, because of data scarcity and access           region is characterized by the occurrence of long
      limitations in large regions (Jones et al., 2011; Rover     periods of drought and floods, which affects water
      et al., 2012; Roach et al., 2013). Spatial variations       availability. Size distribution studies of shallow
      studies of shallow lakes are highlighted in large           lakes considering a wide range of physical
      surfaces such as Sweden, Siberia, United States,            variables over large areas are not very frequent
      Canada, among others; related to their resources and        (Kling et al., 2000). Obtaining data on lake size
      physical processes (Hein et al., 2012; McDonald             and distribution is a necessary step for modeling
      et al., 2012; Karlsson et al., 2014, Mohsen et al.,         regional ecosystem processes during different
      2018). Landsat imagery is one of the most common            climate periods. Previous studies showed the
      types of data employed for mapping surface water            influence of climate events on specific lakes,
      (Tulbure et al., 2016). Spatial dynamics of shallow         mainly explained by the annual precipitation in
      lakes on the Canadian plains were studied using             situ, although the response was not the same in
      Landsat images with different classification methods        all cases (Aliaga et al., 2016; Bohn et al., 2016;
      and periods. These results showed an increasing             Brendel et al., 2020). In such an extensive region,
      trend in their areas for 26 years (Olthof et al., 2015).    the different lake responses may or may not be
                                                                  related to climate variability. Therefore, other
      In the Tibetan plateau, Zhang et al. (2017) found           factors or processes could explain the different
      new lakes and extensive lake expansion on the               spatiotemporal dynamics of the Pampean lakes.

132    REVISTA DE TELEDETECCIÓN (2021) 58, 131-145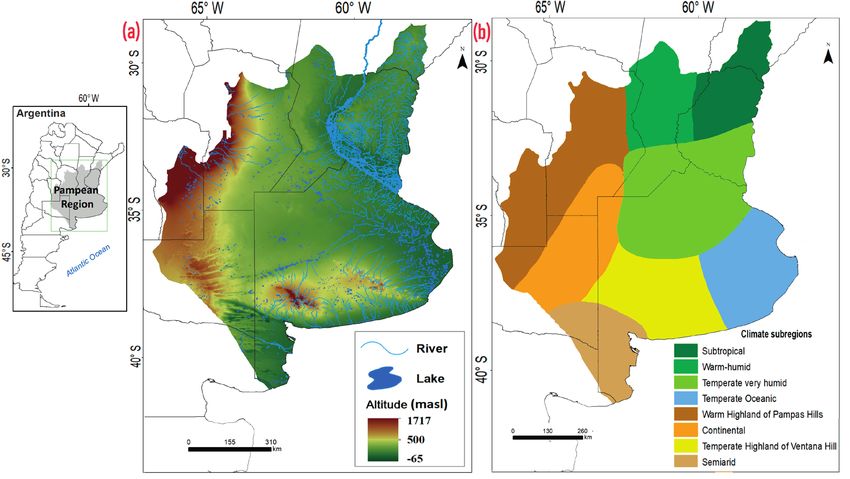
Surface water extent dynamics from three periods of continuous Landsat time series; subregional differences across
Argentine plains

Studies regarding the spatiotemporal variability            613,532 km2 and includes various provinces
of lakes in this region were usually at the local           (Figure 1). Precipitation decreases from northeast
scale in a specific lake or at basin level (Canziani        (1500 mm/year) to southwest (400 mm/year) and
et al., 2019; Maestri et al., 2019; Zunino et al.,          determines the passage from a warm and humid
2019; Pisano et al., 2020; Solana et al., 2021).            climate to a semi-arid one. A marked seasonal
Few works study the evolution of the physical               rainfall predominates in all Pampean regions
characteristics of the lagoons concerning climate           with the highest precipitation in the spring and
variability at the regional level. A satellite              summer months (September to March in the
application could be useful to obtain knowledge of          southern hemisphere). Annual and seasonal
the spatiotemporal variations of the lakes in large         rainfall amplitude decreased from northeast to the
and heterogeneous extensions. This study was                southwest (Aliaga et al., 2017).
addressed to evaluate whether the influence of the
                                                            Shallow lakes with a surface between 500 and
different climate periods on the spatiotemporal
                                                            100,000 m2 predominate (Geraldi et al., 2011);
fluctuations of shallow lakes is similar in the entire
                                                            they are highly fluctuating in salinity and water
Pampean region. Furthermore, to understand the
                                                            restoration time in function of the characteristic
processes that could explain the dynamics of the
                                                            cycles of drought and flood. They consist of
region, other factors such as topography and soil
                                                            swamped areas with vegetation, wetlands, and
condition were considered, using remote sensing
                                                            the main shallow lake. Some of the lakes are
data and Geographical Information System (GIS)
                                                            connected during rainy periods forming up linear
techniques.
                                                            flow networks, whereas in dry periods they are
                                                            disconnected from each other. The precipitation
2. Methodology                                              variability is qualitatively significant and can
                                                            alter these ecosystems. Early works define the
2.1. Study area
                                                            climate of the Pampean region as temperate
The Pampean region is a large plain in the                  humid-subhumid (Aliaga et al., 2016), but recent
center-east of Argentina with abundant water                studies show the climatic heterogeneity in the area
resources (Figure 1a). It has an extension of               defining climatic subregions (Aliaga et al., 2017).

Figure 1. Location of (a) Pampean region, Argentina and (b) Pampean climatic subregions (Modified from Aliaga et al.,
2017).

                                                                         ASOCIACIÓN ESPAÑOLA DE TELEDETECCIÓN           133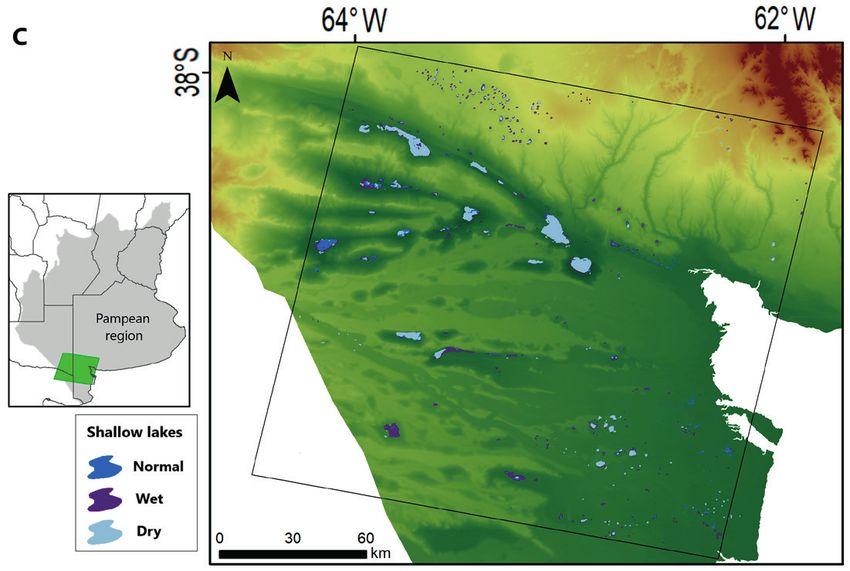
Aliaga et al.

      The Pampean region has eight climate subregions              of rivers, streams and coastal lakes linked to
      (Figure 1b) named: Subtropical (S), Warm humid               saturated and temporarily flooded areas. The
      (WH), Temperate very humid (TH), Temperate                   south and west show the prevalence of eolian
      Oceanic (TO), Warm Highland of Pampas Hills                  depressions (Table 1). Four taxonomic orders of
      (WPH), Continental (C), Temperate Highland of                great predominance were identified but Mollisols
      Ventana Hill (TVH) and Semiarid (SA).                        dominant with a significant presence of organic
                                                                   matter in temperate-humid to semi-arid climates
      In this region there are two important highland
                                                                   (Geraldi et al., 2011). The amount and size of the
      areas, the Pampean (north-east) and the Ventania
                                                                   present inorganic substances affect infiltration,
      (center-south) systems, which coincide with
                                                                   soil aeration, and permeability, among others. In
      subregions WPH and TVH, respectively
                                                                   the Pampean region, limitations by water erosion
      (Figure 1). The north, northeast and east of the
                                                                   and poor drainage have been reported in the
      Pampean region contain an abundant development

      Table 1. Topographic and hydrographic characterization, soil taxonomy, texture, surficial drainage capacity, and main
      limiting factors in soils in the eight studied zones (Figure 1) in the Pampean region.

                                                                            Soil      Soil        Surficial Main limiting
      Zone     Climate       Topography              Hydrographic           Taxonomy Texture      Drainage  Soil
      S        Subtropical   Great flatness and      Alluvial plains and    Mollisols Clayey      Moderate  Water erosion,
                             plains                  dense hydrographic     Alfisols              to poor   poor drainage,
                                                     network                Entisols                        shallow
                                                                                                            effective
                                                                                                            depth.
      WH       Warm          Plains with wavy        Dominance of           Mollisols   Silty -   Moderate Low
               humid         relief                  stream dynamics        Alfisols    sandy     to good   slope and
                                                                            Entisols                        permeability,
                                                                                                            poor drainage.
      TH       Temperate     Plains to slightly     Arheic basin;           Mollisols   Sandy -   Excessive Water
               very humid    wavy topography        permanent and           Alfisols    clayey              erosion, poor
                                                    intermittent shallow                                    drainage, and
                                                    lakes                                                   alkalization.
      TO       Temperate     Wide and asymmetric Deflation basin            Mollisols   Sandy -   Good      Surface
               oceanic       eolian depression      along the coast;        Alfisols    clayey              alkalization,
                             surrounded by wavy     shallow lakes on        Entisols                        poor drainage.
                             plains and hills       previous tidal
                                                    channels
      WHP      Warm          Environment and        Fluvial valleys;        Mollisols   Sandy -   Good to     Climate, wind
               highland of   landscape of the       permanent and           Alfisols    clayey.   excessive   erosion, poor
               the Pampas    Pampean hills.         intermittent shallow    Entisols                          drainage.
               Hills                                lakes on aeolian
                                                    depressions
      C        Continental   Flat to slightly       Small shallow           Mollisols   Sandy -   Excessive Climate, wind
                             undulating relief near lakes over eolian       Alfisols    Silty               erosion.
                             large rivers           depressions between     Entisols
                                                    dunes
      TVH      Temperate     Concave topography. Tectonic, fluvial,         Mollisols   Sandy     Excessive Shallow
               highland of   Great radial           and eolian processes    Alfisols              to        effective
               the Ventana   depression in the      originating lakes;      Entisols              moderate depth, wind
               Hillsl        east of Buenos Aires chained and aligned                                       erosion,
                             province               distribution along                                      climate.
                                                    structural faults
      SA       Semiarid      A predominant          Lakes and salt pans     Mollisols   Sandy     Excessive Climate,
                             slightly wavy plain.   related to dunes with   Aridisols                       wind erosion,
                             Tectonic faults in     structural control      Entisols                        alkalization.
                             the east-west. Strong (east-west
                             eolian and water       orientation)
                             modeling

134    REVISTA DE TELEDETECCIÓN (2021) 58, 131-145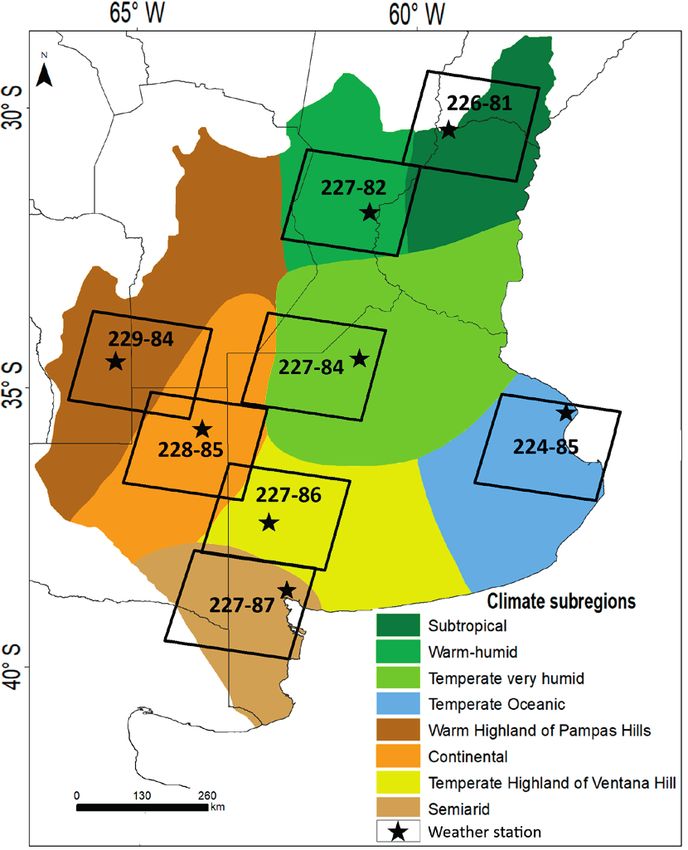
Surface water extent dynamics from three periods of continuous Landsat time series; subregional differences across
Argentine plains

north, northeast, and east. To the west and south,
limitations are related to wind erosion and extreme
climate conditions (Table 1).

2.2. Water classification and
spatiotemporal variation of shallow
lakes

Landsat 5 TM were used to analyze spatiotemporal
fluctuations of lake surface. These images are
freely available (USGS, https://glovis.usgs.
gov) and have a spatial resolution of 30×30 m.
Five images were digitally processed for each
of the eight studied areas (Table 2). These
images correspond to periods characterized
pluviometrically as wet, normal, and dry, during
2001-2002, 2006, and 2008-2009, respectively
(Table 2), determined from in situ data of 33
meteorological stations (period 1960-2010) by
Aliaga et al. (2016). Different rainfall periods
resulted using the Standardized Precipitation
Index (SPI) for each station during the mentioned          Figure 2. Landsat 5 scenes used in each subregion and re-
study period (Aliaga et al., 2016).                        ference weather stations.

Table 2. Landsat 5 TM satellite images used in this study, mean rainfall for 1960-2010, and anomalies (annual mean)
compared to dry, humid and normal periods for each pampean subregion.

                                                                           Mean annual Mean precipitation anomaly
                                                                           precipitation       (mm/year)
                                                                              (mm)
Subregion Path-Row Landsat 5 TM                                             1960-2010 2001 2002 2006 2008 2009
S         226-081 LT52260812002034COA00; LT52260812003007COA00                 1458      408 677 -32 -547 -228
                   LT522608120060424L1TP; LT52260812008013COA02
                   LT52260812009013COA02
WH        227-082 LT52270822002328CUB00; LT52270822003006COA00                1034      247 306     -31 -417 -236
                   LT522708220060415 L1TP; LT52270822008047COA01
                   LT52270822009047COA01
TH        227-084 LT52270842002336XXX02; LT52270842003014COA00                1012      775 309     94   -266 -166
                   LT5227084_20060821 L1TP; LT52270842008047CUB00
                   LT52270842009047CUB00
TO        224-085 LT52240852002363XXX02; LT52240852003051CUB00                 951      375 320     89   -271 -150
                   LT0522908420060819L1TP; LT52240852008036COA00
                   LT52240852009036COA00
WPH       229-084 LT52290842002002CUB00; LT52290842003007COA00                 780      503 340     52   -138 -281
                   LT0522708620060311L1TP; LT52290842008024CUB00
                   LT52290842009024CUB00
C         228-085 LT52280812002002CUB00; LT52280812003024CUB00                 862      336 229     -36 -276 -239
                   LT0522408520060205 L1TP; LT52280812008007COA00
                   LT52280812009007COA00
TVH       227-086 LT52270862002002CUB00; LT52270862003024CUB00                 775      420 225     22   -145 -305
                   LT0522708720061211 L1TP; LT52270862008007COA00
                   LT52270862009007COA00
SA        227-087 LT52270872002002CUB00; LT52270872003024CUB00                 650      210 248     -95 -322 -290
                   LT0522808520061015 L1TP; LT52270872008007COA00
                   LT52270872009007COA00

                                                                        ASOCIACIÓN ESPAÑOLA DE TELEDETECCIÓN           135
Aliaga et al.
All images have low cloud cover (Surface water extent dynamics from three periods of continuous Landsat time series; subregional differences across
Argentine plains
Table 3. Changes in lake number and area between 2001 and 2009 in each subregion and all areas. A nonparametric analysis
of variance (Friedman test) is used to detect the statistical significance of lake area changes.
Change Change Change Change Change Change
Subregion 2001 2006 2009 (2001-2006) (%) (2006-2009) (%) (2001-2009) (%)
Lake area S 367.67 457.60 555.16 89.92 *24 97.55 *21 187.48 *50
(km2) ±0.62 ±1.42 ±1.45 ±1.29 ±1.67 ±1.42
WH 510.28 562.86 479.08 52.58 10 ̶ 83.78 15 ̶ 31.19 6
±4.23 ±7.20 ±5.20 ±7.54 ±7.57 ±6.06
TH 2313.01 1336.28 447.56 ̶ 979.40 *42 ̶ 887.49 *66 ̶ 1865.45 *80
±4.88 ±4.85 ±5.93 ±6.08 ±4.06 ±5.23
TO 1111.44 578.37 653.92 ̶ 533.06 *47 ̶ 75.55 13 ̶ 457.51 *41
±10.02 ±2.05 ±1.08 ±8.83 ±1.70 ±8.91
WPH 441.91 100.43 84.57 ̶ 341.48 *77 ̶ 15.86 *16 ̶ 357.34 *80
±0.52 ±0.39 ±0.24 ±0.56 ±0.20 ±0.54
C 1838.33 399.40 46.42 ̶ 1433.33 *77 ̶ 352.97 *88 ̶ 1786.30 *97
±1.71 ±0.56 ±1.36 ±1.74 ±0.38 ±1.72
TVH 1502.07 1093.57 622.66 ̶ 408.50 *27 ̶ 470.90 *43 ̶ 879.40 *58
±3.63 ±6.27 ±7.52 ±4.78 ±3.88 ±4.32
SA 331.98 325.62 264.30 ̶ 6.36 2 ̶ 61.31 *19 ̶ 67.68 *20
±5.51 ±4.12 ±7.09 ±6.24 ±6.02 ±6.57
All 8447.81 5392.8 3604.7 ̶ 3559.63 *42 ̶ 1850.31 *34 ̶ 5257.39 *62
±7.93 ±4.46 ±3.57 ±7.20 ±3.85 ±7.12
Lake S 2421 1452 1841 ̶ 969 40 389 27 ̶ 580 24
number WH 915 678 620 ̶ 237 26 ̶ 58 9 ̶ 295 32
TH 3955 2172 895 ̶ 1783 45 ̶ 1277 59 ̶ 3060 77
TO 2152 1145 761 ̶ 1007 47 ̶ 384 34 ̶ 1391 65
WPH 2923 786 691 ̶ 3419 81 ̶ 95 12 ̶ 3514 84
C 6293 2132 93 ̶ 4161 66 ̶ 2039 96 ̶ 6200 99
TVH 6314 1530 600 ̶ 4784 76 ̶ 930 61 ̶ 5714 90
SA 333 441 168 108 32 ̶ 273 62 ̶ 165 50
All 25306 10336 5669 ̶ 14970 59 ̶ 4667 45 ̶ 19637 78
*P>0.01.
in Figure 3, there is an association between the number variability, from 3000 to 6200 lakes
number and the area, although they do not do (Figures 3 and 4). The variation between wet
it in the same proportion. This can be seen by and normal periods was 59 %, whereas the one
relating them individually to in situ precipitation. between normal and dry periods was 45 %. For
Although the precipitation in both dry periods example, in subregions C and TVH the number of
was lower than the normal period, the anomalies shallow lakes varied in 4000 lakes between wet
were notably different between the two dry and normal periods, but the number oscillated
periods, since in 2009 the average precipitation between 2000 and 900 lakes between regular and
was higher than in 2008 (Tabla 2). In addition, dry events, respectively (Figures 3 and 4).
this subregion is characterized by large basins
The variation in water coverage did not respond
with rivers and streams, poor surface drainage,
directly to the increase or decrease in lake number.
and extensive underground inputs (Figure 1a,
Different responses of the total area covered by
Table 1), so the dynamics of its water resources
water were recorded (Table 3; Figures 3 and 4). The
are highly conditioned by the phenomena that
relationship between annual precipitation and the
occur upstream.
total area covered by water was direct in subregions
During the study period, subregions TH, WPH, C, WH to TVH, but opposite trends were observed
and TVH were the ones with the most significant in the other two subregions. In subregion S, there
ASOCIACIÓN ESPAÑOLA DE TELEDETECCIÓN 137Aliaga et al.
3000
number area
1500
number area
1000
1000
S WH
2500
750
750
Surface lake area (km2)
Surface lake area (km2)
1000 1500 2000
1000
Lake number
Lake number
500
500
500
250
250
500
0
0
0
0
wet wet normal dry dry wet wet normal dry dry
(2001) (2002) (2006) (2008) (2009) (2001) (2002) (2006) (2008) (2009)
number area 3000 number area
1500
3000
5000
TH TO
2500
4000
Surface lake area (km2)
Surface lake area (km2)
1000 1500 2000
1000
2000
3000
Lake number
Lake number
2000
1000
500
1000
500
0
0
0
0
wet wet normal dry dry wet wet normal dry dry
(2001) (2002) (2006) (2008) (2009) (2001) (2002) (2006) (2008) (2009)
5000
number area
8000
2000
750
number area
WPH C
4000
Surface lake area (km2)
6000
1500
Surface lake area (km2)
500
Lake number
3000
Lake number
4000
1000
2000
250
2000
500
1000
0
0
0
0
wet wet normal dry dry wet wet normal dry dry
(2001) (2002) (2006) (2008) (2009) (2001) (2002) (2006) (2008) (2009)
Figure 3. Total number and surface lake area in subregions S, WH, TH, TO, WPH, and C for a wet (2001-2002), dry (2008-
2009) and normal (2006) pluviometric period.
138 REVISTA DE TELEDETECCIÓN (2021) 58, 131-145Surface water extent dynamics from three periods of continuous Landsat time series; subregional differences across
Argentine plains
8000 number area number area
2000
600
400
TVH SA
6000
1500
Surface lake area (km2)
Surface lake area (km2)
400
Lake number
Lake number
4000
1000
200
200
2000
500
0
0
0
0
wet wet normal dry dry wet wet normal dry dry
(2001) (2002) (2006) (2008) (2009) (2001) (2002) (2006) (2008) (2009)
5000 10000 15000 20000 25000 30000
10000
number area
Total subregions
8000
Surface lake area (km2)
Lake number
6000
4000
2000
0
0
wet wet normal dry dry
Figure 4. Total number and surface lake area in subregions TVH, SA and all of them for a wet (2001-2002), dry (2008-2009)
and normal (2006) pluviometric period.
was an opposite relationship between water area period (Table 3; Figures 3 and 4). Subregions C
and rainfall, whereas in subregion SA there was no and SA were highlighted as those with the greatest
response from shallow lakes regarding an increase and least spatiotemporal variation of water bodies,
in their surface area in the wet period. The variation respectively (Figure 5). The variation exceeded
of the total water area between normal and wet 5000 shallow lakes in the first case and 400 lakes
periods (42%) was not as high as the number of in the second case (Figures 3 and 4).
shallow lakes (59%). These results indicate that a
smaller lake number did not imply a decrease in 3.2. Analysis of the lake areas
lake area in the same proportion during the study
period (Table 3; Figures 3 and 4). According to the range of values in the areas studied
and described by various authors, the following
Subregions TH, WPH, and C revealed the most
lake sizes were established: Very small from 1 ha
significant water losses, 80 %, 80 %, and 97 %,
to 10 ha; Small from 10 ha to 1 km2; Medium from
respectively (Table 3). In the WH, TH, C and
1 km2 to 10 km2; Large from 10 km2 to 100 km2 and
TVH subregions, a direct association is observed
Very large, greater than 100 km2. The Pampean
between precipitation and the number and area
lakes have an average size of 1.72 km2. Our results
of shallow lakes. The lowest relationships were
show that the distribution of the surface area of
found in subregions S, TO, and SA during the same
ASOCIACIÓN ESPAÑOLA DE TELEDETECCIÓN 139Aliaga et al.
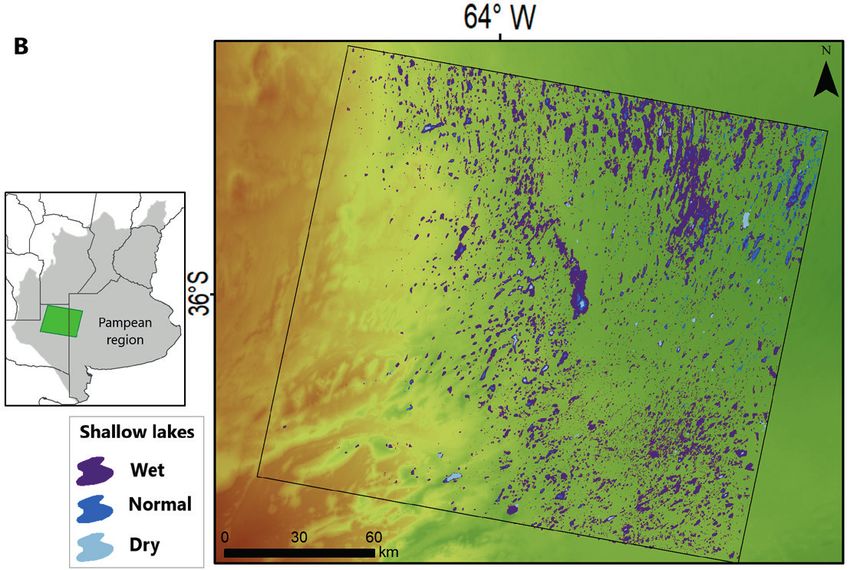
Figure 5. Shallow lakes in subregions A) TH, B) C, and C) SA during normal, dry, and wet periods.
shallow lakes responded to a balance between a Considering the Pareto statement, the two
decrease in the area represented by large shallow smallest categories (from 1 ha to 1 km2) exceeded
lakes in dry periods and an increase in the abundance 80 % of the total number of shallow lakes in each
of smaller lakes in wet periods. studied area (Figure 6). In all subregions, Very
140 REVISTA DE TELEDETECCIÓN (2021) 58, 131-145Surface water extent dynamics from three periods of continuous Landsat time series; subregional differences across
Argentine plains
80% S Wet Normal Dry 80% WH Wet Normal Dry
100% 100%
70% 70%
60% 80% 60% 80%
Accumulated frequency
Accumulated frequency
50% 50%
Frequency
60% 60%
Frequency
40% 40%
30% 40% 30% 40%
20% 20%
20% 20%
10% 10%
0% 0% 0% 0%
0.01 - 0.1 0.1 - 1 1 - 10 10 - 100 > 100 0.01 - 0.1 0.1 - 1 1 - 10 10 - 100 > 100
Lake area (km2) Lake area (km2)
80% TH Wet Normal Dry 80% TO Wet Normal Dry
100% 100%
70% 70%
60% 80% 60% 80%
Accumulated frequency
Accumulated frequency
50% 50%
Frequency
Frequency
60% 60%
40% 40%
30% 40% 30% 40%
20% 20%
20% 20%
10% 10%
0% 0% 0% 0%
0.01 - 0.1 0.1 - 1 1 - 10 10 - 100 > 100 0.01 - 0.1 0.1 - 1 1 - 10 102- 100 > 100
Lake area (km2) Lake area (km )
80% WPH Wet Normal Dry 80% C Wet Normal Dry
100% 100%
70% 70%
60% 80% 60% 80%
Accumulated frequency
Accumulated frequency
50% 50%
Frequency
Frequency
60% 60%
40% 40%
30% 40% 30% 40%
20% 20%
20% 20%
10% 10%
0% 0% 0% 0%
0.01 - 0.1 0.1 - 1 1 - 10 10 - 100 > 100 0.01 - 0.1 0.1 - 1 1 - 10 10 - 100 > 100
Lake area (km2) Lake area (km2)
80% TVH Wet Normal Dry SA Wet Normal Dry
80%
100%
70% 100%
70%
60%
Accumulated frequency
80% 60%
Accumulated frequency
80%
50% 50%
Frequency
Frequency
60% 60%
40% 40%
30% 40% 30% 40%
20% 20%
20% 20%
10% 10%
0% 0% 0% 0%
0.01 - 0.1 0.1 - 1 1 - 10 10 - 100 > 100 0.01 - 0.1 0.1 - 1 1 - 10 10 - 100 > 100
Lake area (km2) Lake area (km2)
Figure 6. Shallow lake size-abundance ratio according to the Pareto distribution in different climate periods for each subre-
gion. The accumulated frequency (right axis) is represented by solid lines.
ASOCIACIÓN ESPAÑOLA DE TELEDETECCIÓN 141Aliaga et al.
Small shallow lakes were dominant, although this such as water erosion are potentially important
dominance was more noticeable in subregions (Table 1). In this subregion, the main limitations
TO, C, and SA. The composition also highlighted of the soil are related to the scarce slopes, poor
that Small shallow lakes were more significant in drainage, and low permeability. Some lakes
subregions S, WH, and TH in the northern center are considered artificial (Tricart, 1973) under
of the Pampean region. Medium lakes reached anthropic control. In most cases, they constitute
their maximum presence in subregions WH reservoirs located at the headwaters of the rivers.
and TH (Figure 6). Finally, Large shallow lakes
Subregion TH is one of the few zones in which
occupied the lowest surface percentage, mainly
significant variations were observed in the
in subregions TO and SA. In subregions S and
number of Very small shallow lakes but also in
TH to C, there was an increase in the presence
Medium and Large shallow lakes. In the wet
of Very small shallow lakes during wet periods.
period, the effect of the maximum precipitations
There were only Very large shallow lakes of more
kept increasing; this increase could be related
than 100 km2 in subregions WH, TH, TO, and
to the predominance of an arheic drain, a low
TVH, but with minimum values (less than 1 % of
slope, and the permeability of soils (Table 1).
the total set of shallow lakes). On the other hand,
This subregion represented the maximum water
a greater contribution of larger shallow lakes was
coverage of 2800 km2 although it did not contain
observed in subregions TVH and SA during the
the maximum number of shallow lakes. This area
dry period, which could be in detriment of the
has been mainly studied because of the frequent
smaller shallow lakes during the period of scarce
and extensive floods during wet periods, which
rains (Figure 6).
have been reported as the most prolonged and
intense ones of the Pampean region (Aliaga et al.,
3.3. Subregional assessment 2017). Therefore, the effect of rainfall on lake
of determining factors in lake dynamics is intensified, favored by the low slope
spatiotemporal variation and permeability of soils (Table 1). In subregion
TO, the number and area of shallow lakes
The spatiotemporal response of lakes in the responded to the development of wet and dry
Pampean subregions allowed their possible periods. In this area, the hydrological system is
relationship with the climate periods. In most of the conditioned by its structural and geomorphologic
subregions, this relationship was clear, although characteristics and the proximity to the coast
in some cases the low direct incidence could (Table 1). The eolian depressions explain the
be explained by their topographic and edaphic considerable presence of areas covered by
characteristics. In the north, subregions S and WH wetlands. The shallow depth of the groundwater
had a robust fluvial control, where shallow lakes level of the drainage could be the driving force
were concentrated along rivers, responding not of the system, so that precipitation acts as a
only to local rainfall but also to the contributions determining factor (Bohn et al., 2016).
upstream of their basins. These contributions
Subregions WPH, C, and TV, located in the
could explain why there were no decreases in
center-west of the Pampean region, presented the
the number of shallow lakes during the periods
maximum number of lakes during wet periods,
considered as dry in S subregion (Figure 3). In
with 4200, 6200 and 6300 lakes, respectively.
addition, the surface hydrological system was
However, the predominance of the Very small
conditioned by the predominance of clay soils in
category did not indicate the greatest water
both zones, which led to water retention and the
coverage in surface. These maximums in the
development of flooded areas with low slopes and
number of lakes decreased considerably during
poor drainage (Table 1).
the dry periods to 690, 93, and 600 lakes,
In WH the relationship is positive between the respectively, which represented an important
number and area of lagoons (Figure 3), responding proportion of ephemeral water coverage in
to the behavior of the anomalies for that subregion the Pampean region. Subregion WPH has a
(Table 2). As the S subregion, the landscape is landscape of hills and the lakes are in valleys and
mainly low relief where soil degradation processes deflation basins or depressions. The dominance
142 REVISTA DE TELEDETECCIÓN (2021) 58, 131-145Surface water extent dynamics from three periods of continuous Landsat time series; subregional differences across
Argentine plains
of sandy loam to silty textures indicates that the these results are limited by the small number of
soils do not flood easily and, although there were samples for each subregion. The discussion and
abundant lakes in wet periods, no significant conclusion regarding the subject represent an
floods took place. In subregion C, the formation approximation to the spatiotemporal behavior of
of Very small ephemeral shallow lakes was the lakes in this region. These results could be
considerable, although it was the second least improved by increasing the temporal frequency
rainy area (Aliaga et al., 2017); they were mainly in each subregion, thus these implications should
located in eolian depressions with sandy soils be considered in the scope of the conclusions
that are saturated with little water (Table 1). presented.
In subregion TVH, the spatiotemporal dynamics
of the shallow lakes responded to wet and dry 4. Conclusions
periods. The wet period affected them more
The spatiotemporal variation of shallow lakes
than the dry events since this area behaves
in the Pampean region is affected by climate
hydrologically as an accumulation zone (Geraldi
variability, although it does not fully explain
et al., 2011). This subregion is located between
this variation. Their extensions and temporary
the Ventana Hills to the southwest and a zone
space arrangements are linked to the origin of the
of dunes to the northwest. Several authors
shallow lakes, their current topography, hydrology,
have addressed the risk of flooding and the
and geomorphology (i.e., their environmental
reception of most of the local contributions
conditions). The temporary space transitions of the
of groundwater in this system. The main lakes
Pampean shallow lakes in the face of the distinct
are connected to each other according to the
climate periods are remarkable, and they can
direction of the structural faults of the area. To
be explained by the amplitude in the number of
the south, subregion SA showed its condition of
shallow lakes and the total water coverage. These
extreme aridity in some periods. The presence of
variations fluctuate between 6200 shallow lakes
Aridisol textures and the scarce rainfall allowed
in subregion C and up to 270 in subregion SA
the formation of large saltpeter. This subregion is
between the wet and dry periods studied. These
the least affected by wet periods concerning the
fluctuations show the heterogeneity of the Pampean
number of water bodies. According to Bohn et al.
region in many aspects that should be considered
(2016), the hydrological balance of previous
in regional studies. Our study shows a simple and
years contributes to regulate the effects of the
effective way to use remote sensing and GIS for
dry event, which is very relevant in a semiarid
monitoring water resource dynamics and studying
environment.
these ecosystems to mitigate the effects of floods
Understanding the changes in lake number and droughts in regions that appear to be relatively
and extent as well as lake abundance and size homogeneous. This new lake evolution dataset
distribution is essential for the evaluation of water provides foundations to support evidence-based
resources at regional and subregional levels, decisions for water resource management and
biogeochemical cycles, and climatic changes environmental protection in different Pampean
(Zhang et al., 2014). Our results highlight the subregions.
importance of using multi-temporal remote sensing
data to reveal complex temporal space variations, Acknowledgements
in the face of climate variability in these fragile
landscapes. The impact of climate variability on Authors would like to thank the Consejo Nacional
lake water balance is complex and can be sharply de Investigaciones Científicas y Técnicas for sup-
different across regions. This impact, together porting this study. Besides, to the United States
with the diverse lake ecosystem properties, calls Geological Survey for supplying the information
for management strategies that explicitly identify analyzed in this study. This work was carried out
environmental changes and potential risks with the aid of a grant from the Inter-American
associated with region-specific hydrological and Institute for Global Change Research (IAI)
ecosystem dynamical processes (Zhang et al., CRN3038, which is supported by the US National
2017). However, it is necessary to highlight that Science Foundation (Grant GEO-1128040).
ASOCIACIÓN ESPAÑOLA DE TELEDETECCIÓN 143Aliaga et al.
References Hein, C.L., Öhlund, G., Englund, G. 2012. Future
distribution of Arctic char Salvelinus alpinus in
Aliaga, V.S., Ferrelli, F., Piccolo, M.C. 2017. Sweden under climate change: effects of temperature,
Regionalization of climate over the Argentine lake size and species interactions. Ambio, 41(3), 303-
Pampas. International Journal of Climatology, 312. https://doi.org/10.1007/s13280-012-0308-z
37(S1), 1237-1247. https://doi.org/10.1002/joc.5079
Hu, Z.J., Wang, L.L., Tang, H.W., Qi, X.M. 2017.
Aliaga, V.S., Ferrelli, F., Alberdi-Algarañaz, E.D., Prediction of the future flood severity in plain river
Bohn, V.Y. Piccolo, M.C. 2016. Distribution and network region based on numerical model: A case
variability of precipitation in the Pampean Region, study. Journal of Hydrodynamics, 29(4), 586-595.
Argentina. Cuadernos de Investigación Geográfica, https://doi.org/10.1016/S1001-6058(16)60771-0
42(1), 261-280. https://doi.org/10.18172/cig.2867
Instituto Geográfico Nacional de la República
Brendel, A.S. 2020. Estudio integral de los recursos Argentina. 2013. http://www.ign.gob.ar
hídricos y las coberturas del suelo de la cuenca media
y baja del Río Sauce Grande (Argentina). (Tesis de Jones, B.M., Grosse, G.D.A.C., Arp, C.D., Jones, M.C.,
Doctor en Geografía). Universidad Nacional del Sur, Anthony, K.W., Romanovsky, V.E. 2011. Modern
Bahía Blanca, Argentina. https://doi.org/10.19137/ thermokarst lake dynamics in the continuous
huellas-2020-2425 permafrost zone, northern Seward Peninsula, Alaska.
Journal of Geophysical Research: Biogeosciences,
Bohn, V.Y., Delgado, A.L., Piccolo, M.C. Perillo, G.M. 116(G2). https://doi.org/10.1029/2011JG001666
2016. Assessment of climate variability and land
use effect on shallow lakes in temperate plains of Karlsson, J.M., Lyon, S.W., Destouni, G. 2014.
Argentina. Environmental Earth Sciences, 75(9), Temporal behavior of lake size-distribution in a
818. https://doi.org/10.1007/s12665-016-5569-6 thawing permafrost landscape in northwestern
Siberia. Remote sensing, 6(1), 621-636.
Canziani, G., Castets, F., Maestri, M.L., Ferrati, R. https://doi.org/10.3390/rs6010621
2019. Uso de imágenes satelitales para el estudio de
las lagunas pampeanas. El caso de La Barrancosa. Kling, G.W., Kipphut, G.W., Miller, M.M., O’Brien,
Destino: La Barrancosa. Una invitación a conocer W.J. 2000. Integration of lakes and streams in a
lagunas pampeanas, 77. landscape perspective: the importance of material
processing on spatial patterns and temporal
Carmona, F., Rivas, R., Thomas, L. Marino, B. 2011. coherence. Freshwater Biology, 43(3), 477–497.
Spectral characterization of the estuary of the https://doi.org/10.1046/j.1365-2427.2000.00515.x
Quequén Grande River through Landsat images. In
Raúl Rivas, Facundo Carmona and Dora Ocampo Kumar, S., Sarkar, A., Thakur, S.K., Shekhar, S. 2017.
(Eds). Teledetección: Recientes aplicaciones en la Hydrogeological characterization of aquifer in palla
Región Pampeana. Tandil, Buenos Aires. 11-29. flood plain of Delhi using integrated approach.
Journal of the Geological Society of India, 90(4), 459-
Deng, X., Xu, Y., Han, L., Song, S., Xu, G., & Xiang, J. 466. https://doi.org/10.1007/s12594-017-0739-z
2018. Spatial-temporal changes in the longitudinal
functional connectivity of river systems in the Taihu Maestri, M.L., Castets, F., Bayala, M.I., Canziani, G.
Plain, China. Journal of Hydrology, 566, 846-859. 2019. Análisis comparativo de cinco métodos de
https://doi.org/10.1016/j.jhydrol.2018.09.060 procesamiento para calcular el área de lagunas
pampeanas a partir de imágenes satelitales
Gerten D., Adrian R. 2000. Climate-driven changes Landsat. Biología Acuática, (33), 3. https://doi.
in spring plankton dynamics and the sensitivity org/10.24215/16684869e003
of shallow polymictic lakes to the North Atlantic
Oscillation. Limnol. Oceanogr., 45, 1058–1066. McDonald, C.P., Rover, J.A., Stets, E.G., Striegl, R.G.
https://doi.org/10.4319/lo.2000.45.5.1058 2012. The regional abundance and size distribution
of lakes and reservoirs in the United States and
Gerten D., Adrian R. 2001. Differences in the implications for estimates of global lake extent.
persistency of the North Atlantic Oscillation signal Limnology and Oceanography, 57(2), 597–606.
among lakes. Limnol. Oceanogr., 46, 448–455. https://doi.org/10.4319/lo.2012.57.2.0597
https://doi.org/10.4319/lo.2001.46.2.0448
Mohsen, A., Elshemy, M., Zeidan, B.A. 2018. Change
Geraldi, A., Piccolo, M.C. Perillo, G.M.E. 2011. detection for Lake Burullus, Egypt using remote
The role of the Buenos Aires shallow lakes in the sensing and GIS approaches. Environmental Science
Pampean land scape. Ciencia Hoy, 22. and Pollution Research, 25(31), 30763-30771.
https://doi.org/10.1007/s11356-016-8167-y
144 REVISTA DE TELEDETECCIÓN (2021) 58, 131-145Surface water extent dynamics from three periods of continuous Landsat time series; subregional differences across
Argentine plains
Olthof, I., Fraser, R.H., Schmitt, C. 2015. Tulbure, M.G., Broich, M., Stehman, S.K., Kommareddy,
Landsat-based mapping of thermokarst lake A. 2016. Surface water extent dynamics from three
dynamics on the Tuktoyaktuk Coastal Plain, decades of seasonally continuous Landsat time series
Northwest Territories, Canada since 1985. at sub continental scale in a semiarid region. Remote
Remote Sensing of Environment, 168, 194-204. Sensing of Environment, 178, 142-157. https://doi.
https://doi.org/10.1016/j.rse.2015.07.001 org/10.1016/j.rse.2016.02.034
Pisano, M.F., D’Amico, G., Ramos, N., Pommarés, Tricart, J.L. 1973. Geomorfología de la Pampa
N., Fucks, E. 2020. Factors that control the Deprimida. INTA, Buenos Aires.
seasonal dynamics of the shallow lakes in the
Verpoorter, C., Kutser, T., Seekell, D.A., Tranvik,
Pampean region, Buenos Aires, Argentina. Journal
L.J. 2014. A global inventory of lakes based on
of South American Earth Sciences, 98, 102468.
high-resolution satellite imagery. Geophysical
https://doi.org/10.1016/j.jsames.2019.102468
Research Letters, 41(18), 6396-6402. https://doi.
Pricope, N. G. 2013. Variable-source flood pulsing in org/10.1002/2014GL060641
a semi-arid transboundary watershed: The Chobe
Vincent, W.F., Laurion, I., Pienitz, R., Walter
River, Botswana and Namibia. Environmental
Anthony, K.M. 2013. Climate impacts on
Monitoring and Assessment, 185, 1883–1906.
Arctic lake ecosystems. Climatic Change and
https://doi.org/10.1007/s10661-012-2675-0
Global Warming of Inland Waters: Impacts and
Quirós, R., Rennella, A.M., Boveri, M.A., Rosso, J.J., Mitigation for Ecosystems and Societies, 27-42.
Sosnovsky, A. 2002. Factors that affect the structure https://doi.org/10.1002/9781118470596.ch2
and functioning of the Pampean shallow lakes.
Winslow, L.A., Read, J.S., Hanson, P.C., Stanley, E.H.
Ecología austral, 12(2), 175-185.
2015. Does lake size matter? Combining morphology
Roach, J.K., Griffith, B., Verbyla, D. 2013. Landscape and process modeling to examine the contribution of
influences on climate-related lake shrinkage at high lake classes to population-scale processes. Inland
latitudes. Global change biology, 19(7), 2276-2284. Waters, 5(1), 7-14. https://doi: 10.5268/IW-5.1.740
https://doi.org/10.1111/gcb.12196
Zhang, G., Yao, T., Xie, H., Zhang, K., Zhu, F. 2014.
Rover, J., Ji, L., Wylie, B.K., Tieszen, L.L. 2012. Lakes state and abundance across the Tibetan
Establishing water body areal extent trends in Plateau. Chinese Science Bulletin, 59(24), 3010-
interior Alaska from multi-temporal Landsat 3021. https://doi.org/10.1007/s11434-014-0258-x
data. Remote Sensing Letters, 3(7), 595-604.
Zhang, G., Yao, T., Piao, S., Bolch, T., Xie, H., Chen,
https://doi.org/10.1080/01431161.2011.643507
D., Yi, S. 2017. Extensive and drastically different
Schroeder, T., Cohen, W., Song, C., Canty, M.J. alpine lake changes on Asia’s high plateaus during
Yang, Z. 2006. Radiometric correction of multi- the past four decades. Geophysical Research Letters,
temporal Landsat data for characterization of early 44(1), 252-260. https://doi:10.1002/2016GL072033
successional forest patterns in western Oregon.
Zhang, G., Yao, T., Chen, W., Zheng, G., Shum, C.K.,
Remote Sensing of Environment. 103(1),16-26.
Yang, K., O’Reilly, C.M. 2019. Regional differences
https://doi.org/10.1016/j.rse.2006.03.008
of lake evolution across China during 1960s–2015
Solana, M.X., Londoño, O.M.Q., Romanelli, A., and its natural and anthropogenic causes. Remote
Donna, F., Martínez, D.E., Weinzettel, P. 2021. sensing of environment, 221, 386-404. https://doi.
Connectivity of temperate shallow lakes to org/10.1016/j.rse.2018.11.038
groundwater in the Pampean Plain, Argentina:
Zunino, J., Ferrelli, F., Píccolo, M.C. 2019. Cambios
A remote sensing and multi-tracer approach.
morfometricos en una Laguna Pampeana
Groundwater for Sustainable Development, 13,
(Argentina) como consecuencia de la variabilidad
100556. https://doi.org/10.1016/j.gsd.2021.100556
pluviométrica (1960-2015) y sus posibles efectos
Subsecretaria de Recursos Hídricos e Instituto Nacional sobre la comunidad ictica. Geociências (São Paulo),
del Agua. 2002. Atlas digital de los Recursos 37(4), 835-847. https://doi.org/10.5016/geociencias.
Hídricos de la República Argentina. Subsecretaría v37i4.11980
de Recursos Hídricos de la Nación. Buenos Aires,
Argentina.
ASOCIACIÓN ESPAÑOLA DE TELEDETECCIÓN 145You can also read