A unified platform to manage, share, and archive morphological and functional data in insect neuroscience - eLife
←
→
Page content transcription
If your browser does not render page correctly, please read the page content below
TOOLS AND RESOURCES

                                   A unified platform to manage, share, and
                                   archive morphological and functional data
                                   in insect neuroscience
                                   Stanley Heinze1,2*, Basil el Jundi3, Bente G Berg4, Uwe Homberg5,
                                   Randolf Menzel6, Keram Pfeiffer3, Ronja Hensgen5, Frederick Zittrell5,
                                   Marie Dacke1, Eric Warrant7, Gerit Pfuhl4,8, Jürgen Rybak9, Kevin Tedore1
                                   1
                                    Department of Biology, Lund University, Lund, Sweden; 2NanoLund, Lund
                                   University, Lund, Sweden; 3Biocenter, Behavioral Physiology and Sociobiology,
                                   University of Würzburg, Würzburg, Germany; 4Department of Psychology,
                                   Chemosensory lab, Norwegian University of Science and Technology, Trondheim,
                                   Norway; 5Fachbereich Biologie, Tierphysiologie, and Center for Mind Brain and
                                   Behavior (CMBB), University of Marburg and Justus Liebig University Giessen,
                                   Marburg, Germany; 6Institut für Biologie - Neurobiologie, Free University, Berlin,
                                   Germany; 7Research School of Biology, Australian National University, Canberra,
                                   Australia; 8Department of Psychology, UiT The Arctic University of Norway, Tromso,
                                   Norway; 9Department of Evolutionary Neuroethology, Max Planck Institute for
                                   Chemical Ecology, Jena, Germany

                                   Abstract Insect neuroscience generates vast amounts of highly diverse data, of which only a
                                   small fraction are findable, accessible and reusable. To promote an open data culture, we have
                                   therefore developed the InsectBrainDatabase (IBdb), a free online platform for insect
                                   neuroanatomical and functional data. The IBdb facilitates biological insight by enabling effective
                                   cross-species comparisons, by linking neural structure with function, and by serving as general
                                   information hub for insect neuroscience. The IBdb allows users to not only effectively locate and
*For correspondence:               visualize data, but to make them widely available for easy, automated reuse via an application
stanley.heinze@biol.lu.se          programming interface. A unique private mode of the database expands the IBdb functionality
Competing interest: See            beyond public data deposition, additionally providing the means for managing, visualizing, and
page 22                            sharing of unpublished data. This dual function creates an incentive for data contribution early in
Funding: See page 22
                                   data management workflows and eliminates the additional effort normally associated with publicly
                                   depositing research data.
Preprinted: 01 December 2020
Received: 02 December 2020
Accepted: 21 August 2021
Published: 24 August 2021

Reviewing editor: Ronald L
                                   Introduction
Calabrese, Emory University,
                                   Data are the essence of what science delivers - to society, to researchers, to engineers, to entrepre-
United States                      neurs. These data enable progress, as they provide the basis on which new experiments are
                                   designed, new machines are developed, and from which new ideas emerge. Independent of the
   Copyright Heinze et al. This
                                   research field, many terabytes of data are produced every year, yet only a small fraction of these
article is distributed under the
                                   data become openly available to other researchers, with even less penetrating the invisible wall
terms of the Creative Commons
Attribution License, which         between the scientific community and the public (Mayernik, 2017). While research papers report
permits unrestricted use and       conclusions that are based on data and present summaries and analyses, the underlying data most
redistribution provided that the   often remain unavailable, despite their value beyond the original context. Whereas this is changing
original author and source are     in many fields and the use of open data repositories becomes increasingly mandatory upon publica-
credited.                          tion of a research paper, this is not ubiquitous and older data remain inaccessible in most instances.

Heinze et al. eLife 2021;10:e65376. DOI: https://doi.org/10.7554/eLife.65376                                                      1 of 25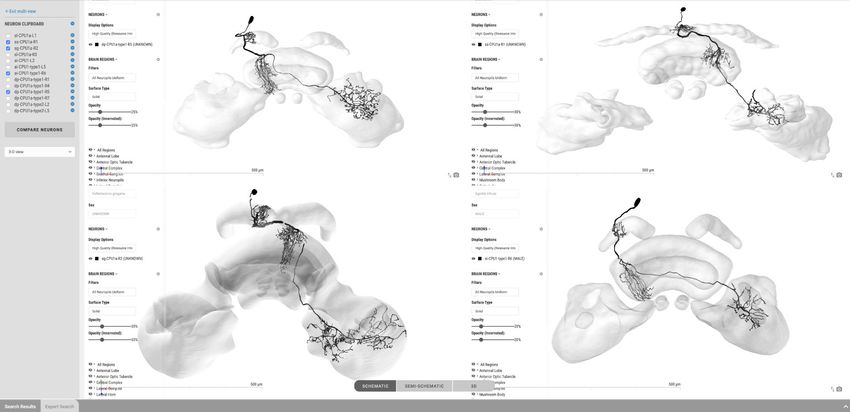
Tools and resources                                                                                                    Neuroscience

                                   eLife digest Insect neuroscience, like any field in the natural sciences, generates vast amounts
                                   of data. Currently, only a fraction are publicly available, and even less are reusable. This is because
                                   insect neuroscience data come in many formats and from many species. Some experiments focus on
                                   what insect brains look like (morphology), while others focus on how insect brains work (function).
                                   Some data come in the form of high-speed video, while other data contain voltage traces from
                                   individual neurons. Sharing is not as simple as uploading the raw files to the internet.
                                      To get a clear picture of how insect brains work, researchers need a way to cross-reference and
                                   connect different experiments. But, as it stands, there is no dedicated place for insect
                                   neuroscientists to share and explore such a diverse body of work. The community needs an open
                                   data repository that can link different types of data across many species, and can evolve as more
                                   data become available. Above all, this repository needs to be easy for researchers to use.
                                      To meet these specifications, Heinze et al. developed the Insect Brain Database. The database
                                   organizes data into three categories: species, brain structures, and neuron types. Within these
                                   categories, each entry has its own profile page. These pages bring different experiments together
                                   under one heading, allowing researchers to combine and compare data of different types. As
                                   researchers add more experiments, the profile pages will grow and evolve. To make the data easy
                                   to navigate, Heinze et al. developed a visual search tool. A combination of 2D and 3D images allow
                                   users to explore the data by anatomical location, without the need for expert knowledge.
                                   Researchers also have the option to upload their work in private mode, allowing them to securely
                                   share unpublished data.
                                      The Insect Brain Database brings data together in a way that is accessible not only to researchers,
                                   but also to students, and non-scientists. It will help researchers to find related work, to reuse
                                   existing data, and to build an open data culture. This has the potential to drive new discoveries
                                   combining research across the whole of the insect neuroscience field.

                                   Additionally, merely meeting the data deposition requirement by ’dumping’ poorly annotated raw
                                   files on an internet platform does not aid transparency or reuse of the data. To ensure common
                                   standards for data repositories and the datasets to be stored in them, the FAIR principles for data
                                   deposition (Findability, Accessibility, Interoperability, and Reusability) were developed
                                   (Wilkinson et al., 2016). It is clear from these principles that annotation and rich metadata are
                                   essential, if a dataset is supposed to be beneficial to others. While this is relatively easily achievable
                                   for data such as gene sequences, protein sequences, or numerical datasets, the challenges are much
                                   bigger for complex morphological data, physiological observations, or behavioral studies. The diffi-
                                   culties result not only from large file sizes of image stacks, high-speed videos, or recorded voltage
                                   traces, but also from the heterogeneous data structure often generated by custom designed soft-
                                   ware or equipment.
                                       Insect neuroscience is no stranger to these challenges. Particularly for research outside the genet-
                                   ically accessible fruit fly Drosophila, no universal data repository exists that allows retrieval of original
                                   observations that underlie published articles. Research groups worldwide investigate the nervous
                                   systems of a wide range of insect species, but mostly operate in isolation of each other. Data from
                                   these projects are often deposited in local backup facilities of individual institutions and thus remain
                                   inaccessible to the community. Combined with a lack of interoperability caused by independent
                                   choices of data formats this has the potential to severely hamper progress, given that interspecies
                                   comparison is one of the existential pillars on which insect neuroscience rests. The problem is ampli-
                                   fied by the fact that much of the data are both large and heterogeneous (e.g. 2D and 3D images,
                                   models of brain regions, digital neuron reconstructions, immunostaining patterns, electrophysiologi-
                                   cal recordings, functional imaging data).
                                       A final problem is that depositing well-annotated data takes time and effort, and little incentive is
                                   generally given to prioritize this work over acquiring new data or publishing research papers. While
                                   this is true for all research fields, the complex data in neuroscience requires an extra amount of effort
                                   to meet acceptable standards. This has made depositing data in a form that is useful to the commu-
                                   nity a relatively rare event. Early efforts were made to develop brain databases for various insect

Heinze et al. eLife 2021;10:e65376. DOI: https://doi.org/10.7554/eLife.65376                                                             2 of 25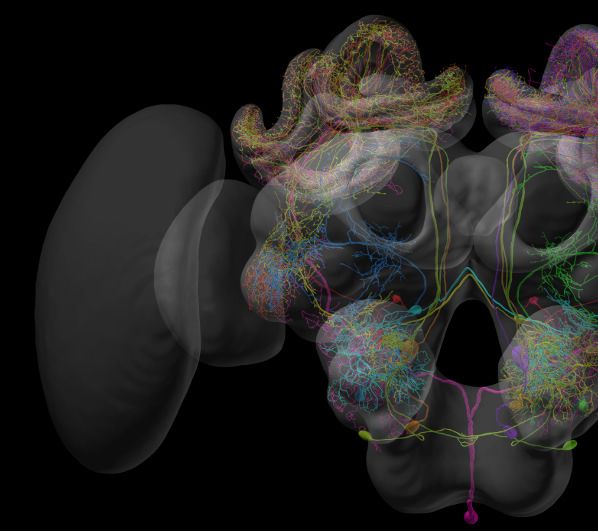
Tools and resources                                                                                                  Neuroscience

                                   species (e.g. honeybee [Brandt et al., 2005], Manduca sexta [El Jundi et al., 2009a], Tribolium cas-
                                   taneum [Dreyer et al., 2010], desert locust [Kurylas et al., 2008]), but in those cases, the antici-
                                   pated interactive platforms for exchange and deposition of anatomical data were short-lived and
                                   not used beyond the laboratories that hosted them. More recently, several successful databases for
                                   anatomical data from insects were developed. Most notably, Virtual Fly Brain (VFB) (Osumi-
                                   Sutherland et al., 2014) now bundles most efforts in the Drosophila community regarding the depo-
                                   sition of neuroanatomical data - including single-cell morphologies from light microscopy, data from
                                   recent connectomics projects (most notably from Scheffer et al., 2020), as well as catalogues of
                                   GAL4 driver lines, which enable access to specific neurons with genetic methods. VFB hosts most
                                   content of older independent databases, such as FlyCircuit (Chiang et al., 2011) and FlyBrain
                                   (Armstrong et al., 1995) and is dedicated to providing smart ways of utilizing and visualizing Dro-
                                   sophila neuroanatomy. Similarly, but more focused on data visualization and connectivity modeling,
                                   the FruitFlyBrainObservatory allows access to current datasets of single neuron morphologies from
                                   Drosophila. Another database, founded in 2007, has grown substantially over recent years: Neuro-
                                   Morpho.Org (Ascoli et al., 2007). It provides 3D reconstructed datasets of more than 100,000 neu-
                                   rons from across animal species and includes substantial numbers of single-cell data from insects.
                                   While the latter platform is comparative in nature, it does not offer dedicated tools for comparisons
                                   between species or much context for the deposited neuron skeletons. In contrast, the data on VFB
                                   are much richer and different datasets are tightly linked to each other, allowing, for example, corre-
                                   lation between GAL4 driver lines and electron microscopy based single neuron reconstructions. Yet,
                                   no comparison to other species is possible or intended via VFB. Additionally, no systematic informa-
                                   tion is provided about the function of the deposited neurons in either database, precluding insights
                                   into the structure-function relations that are critically important to understanding the insect brain.
                                       To address these shortcomings we have developed the Insect Brain Database (IBdb), a cross-spe-
                                   cies, web-based platform designed for depositing and sharing research data that consist of morpho-
                                   logical and functional information from insect brains. With an overall modular design, a concept for
                                   dual use as depository and data management tool, combined with widely useful visualization tools,
                                   this database yields a tool for increasing transparency, accessibility, and interoperability of insect
                                   neuroscience data. Moreover, the newly developed concepts are not only relevant to insect neuro-
                                   science, but to any scientific field that can be linked to a hierarchically organized framework. We
                                   thus hope that our conceptual design can be adopted by a range of users from across the sciences
                                   to simplify data handling and make scientific results in general more transparent.

                                   Results
                                   Database outline
                                   The ’Insect Brain Database’ (IBdb) can be found on the internet at insectbraindb.org and is freely
                                   available to everyone. It can be used with most modern web browsers with active Javascript (tested
                                   with Google Chrome, Safari, Firefox) on computers running any operating system, without the need
                                   for any additional plugins. A user account can be registered free of charge and is required for users
                                   who wish to download data and to contribute content.
                                      The IBdb is divided into three main hierarchical layers: Species, brain structures, and neuron
                                   types. Each level is additionally linked to ’experiments’, which is the fourth major organizational layer
                                   of the database (Figure 1A). At each level, a database entry is represented by profile pages, on
                                   which all relevant information is collected (Figure 1C). These profile pages are the core of the data-
                                   base. They can be reached directly by several search functions, as well as by entry lists. As profile
                                   pages are embedded in a hierarchical framework of species, brain regions, and cell types, they
                                   become automatically associated with metadata. For instance, an entry for a pontine neuron of the
                                   fan-shaped body (central body upper division) in the monarch butterfly would become linked to the
                                   brain regions ’fan-shaped body/central body upper division’ and its parent region ’central complex’,
                                   as well as to ’monarch butterfly’ as species. The neuron can then be found, for example, by querying
                                   the brain regions associated with it, or by exploring the species of interest.
                                      Species entries contain representative data of an insect species, with the aim of defining that spe-
                                   cies and the overall layout of its brain. Similarly, entries for brain regions and cell types contain rep-
                                   resentative examples of data that illustrate the respective entity and provide all information to

Heinze et al. eLife 2021;10:e65376. DOI: https://doi.org/10.7554/eLife.65376                                                          3 of 25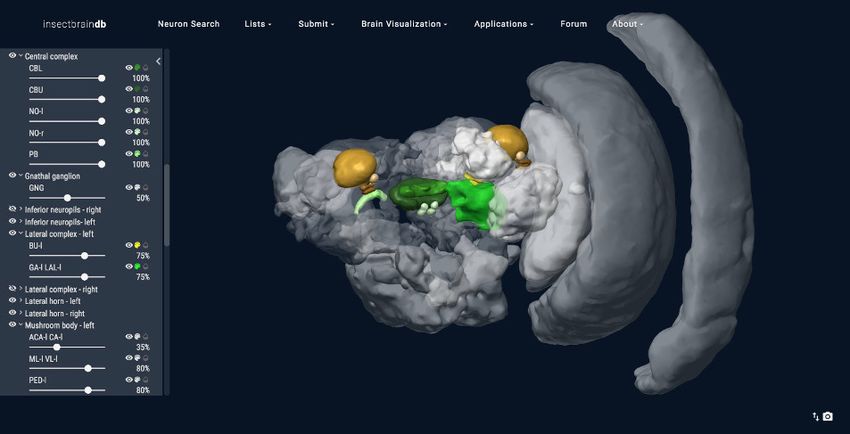
Tools and resources Neuroscience
Conceptual components Access points Findable through:
A
Species Species profile pages
contain
Lists
Brain regions Brain region profile pages
are linked to
contain
Cell types Neuron profile pages
are linked to
Search
(graphical and advanced)
are linked to
Experiments Experiment pages
B Honeybee
C Neuron Name - Species
Version
Antennal lobe Basic information
Profile image
are linked to
are linked to
Projection neuron
from glomerulus 53
Basic Morphology
are linked to
Reconstruction
Examples of possible data
3D
Whole-brain AL Calcium Intracellular reconstruction
µCT imaging video recording/dye-injection
Confocal Stack
TEM images of confocal
Behavioral Volumetric data
synaptic terminals of Function stack(s)
tracking data of AL development
identified neuron
Experiments
Whole-brain Local connectomics Single cell
IHC data transcriptome data Publications
Figure 1. Basic concepts behind the Insect Brain Database. (A) Organizational layers of the database. Elements in each layer are represented on their
respective profile pages, which can be located either through lists or search interfaces. (B) Examples for information that can be deposited on each
level of the database, illustrating how diverse data is automatically associated with hierarchical metadata. (C) Schematic illustration of a neuron profile
page. Detailed anatomical and functional data is available on this page, from where experiments associated with this cell type are also linked. Similar
pages exist for species and brain regions. Abbreviations: AL, antennal lobe; IHC, immunohistochemistry; TEM, transmission electron microscopy;
mCT, micro computed tomography.
The online version of this article includes the following figure supplement(s) for figure 1:
Figure supplement 1. Technical overview of database layout.
Figure supplement 2. Definition of cell types.
unambiguously define it, essentially providing type-specimen. While the definition of species and
brain regions are straight forward in the context of this database, neuron types can theoretically be
defined in many different ways, based on connectivity, function, developmental origin, morphology
or neurochemical identity. Given that the database is predominantly organized according to anatom-
ical principles, we have defined a cell type as a collection of individual neurons that are morphologi-
cally indistinguishable at the level of light microscopy. In many cases, a cell type comprises only a
Heinze et al. eLife 2021;10:e65376. DOI: https://doi.org/10.7554/eLife.65376 4 of 25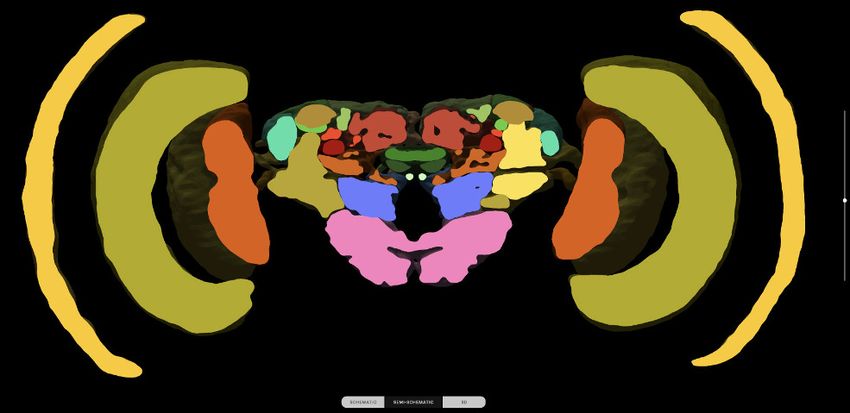
Tools and resources                                                                                                  Neuroscience

                                   single individual per brain hemisphere, but in cases where multiple identical neurons are present, a
                                   cell type is defined as the first level of similarity beyond the individual neuron. Higher levels of neu-
                                   ron categories group neurons according to anatomical similarities (Figure 1—figure supplement 2).
                                       Contrary to the first three levels, experiment entries contain specific data from individual, defined
                                   experiments (Figure 1B). As research data can be obtained at the levels of species, brain regions
                                   and cell types, experiment entries exist for all three levels and are accessible via the respective pro-
                                   file pages (Figure 1A). This distinction between representative and concrete data is important, as
                                   for example only one entry for a certain columnar neuron type of the central complex exists in the
                                   database, yet, if that single cell type was subject to 30 intracellular recordings, the profile page of
                                   that cell type would list 30 experiments, each containing a unique individual neuron with its associ-
                                   ated physiology. While an anatomical type specimen can easily be defined as the most complete
                                   example of any particular neuron’s morphology, the decision of what content to depict as represen-
                                   tative functional data is less straight forward. The functional information on the profile page should
                                   reflect the range of experimental results present in the experiment entries of any particular cell type.
                                   As those results potentially diverge, for example due to different experimental paradigms used in
                                   different research groups, the function section can contain as many entries as needed to capture the
                                   available information, without need for consensus. With new experiment entries added, this section
                                   can evolve over time.
                                       In the context of this evolving content, it is key to ensure that entries which are cited in published
                                   work remain findable in the exact form they existed when they were cited (Ito, 2010). Therefore
                                   each entry receives a persistent identifier. This identifier (a ’handle’) links to a version of the entry
                                   that was frozen at the time it was created (and cited). Once information is added or removed from
                                   that entry, a new handle must be generated, providing a new access link for future citations. This sys-
                                   tem is applied to multiple levels of the database (experiments, neurons, and species) and ensures
                                   that all information in the database, as well as the interrelations between entries, are truly persistent.

                                   Interactive search interfaces
                                   As locating specific datasets is one of the core functions of a database, we have developed a novel,
                                   more intuitive way to find specific neuron data. A graphical representation of the insect brain, resem-
                                   bling the overall anatomical outline of all brain regions and highlighting the regions containing neu-
                                   ron data (Figure 2A), makes it easy to search for neurons within single species and across species.
                                   This graphical interface is generated directly on the database website for each species and is
                                   adapted from a generic insect brain, that is a shared ground plan. This generic brain is the least
                                   detailed fall-back option for any cross-species search and was generated based on the insect brain
                                   nomenclature developed by Insect Brain Name Working Group et al., 2014. It resembles the
                                   shared anatomical hierarchy of all brain regions in insect brains. Within this hierarchy, the entire brain
                                   is divided into 13 super-regions, which consist of individual neuropils. The latter can be further
                                   divided into sub-regions. While all super-regions exist in all species, differences become more pro-
                                   nounced at lower levels of the hierarchy. The generic brain therefore largely contains super-regions
                                   as well as several highly conserved neuropils (Figure 2—figure supplement 1, Figure 2—figure
                                   supplement 2). As these categories are simply tags of brain region entries used to organize the
                                   database, the search interface does not differentiate between them, simplifying the user experience
                                   (Figure 2A).
                                      If more than one species is subject to a query, a schematic brain is generated that displays the
                                   commonly shared features of the species involved. For both single and multi-species search, when
                                   selecting a specific brain region, all neurons in the IBdb that connect to this region become visual-
                                   ized by a dynamically drawn wiring diagram (Figure 2B). Filters can be applied to narrow down
                                   search results according to neuron polarity, functional class, etc. Individual neurons in the wiring dia-
                                   gram can be selected to reveal the neuron’s profile page. Here, all available information for this cell
                                   type is displayed, including links to deposited experiment entries (Figure 2C). The schematic display
                                   of search results can visualize any neuron in the database, only requiring that a neuron is annotated
                                   with respect to the brain regions it innervates. A list of search results is additionally made available
                                   after each search and offers the possibility to also display experiment entries associated with the
                                   found neurons.
                                      For single species queries, two more modes for visualizing search results are available: the semi-
                                   schematic view and the 3D view. The semi-schematic view mode emphasizes the natural brain

Heinze et al. eLife 2021;10:e65376. DOI: https://doi.org/10.7554/eLife.65376                                                          5 of 25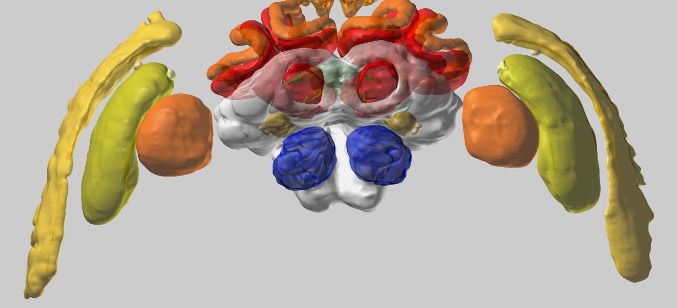
Tools and resources                                                                                         Neuroscience

                            A                                                  C
    Schematic search

                                                             select

                            B

                                                                      select

                            D
    Semi-schematic search

                            E
    3D result display

Figure 2. Neuron search in the IBdb. (A) Screenshot of the schematic brain search interface (Monarch butterfly) in single species mode. Selecting a
neuropil will reveal all neurons connected to that neuropil. (B) Schematic wiring diagram view of the search result; orange neuropil was queried.
Selecting an individual neuron will reveal the profile page of that cell type. (C) Example of a neuron profile page with anatomical information. Confocal
image stack and functional data are not listed in this example. (D) Semi-schematic search interface. The section view is scrollable and allows the user to
Figure 2 continued on next page

Heinze et al. eLife 2021;10:e65376. DOI: https://doi.org/10.7554/eLife.65376                                                                       6 of 25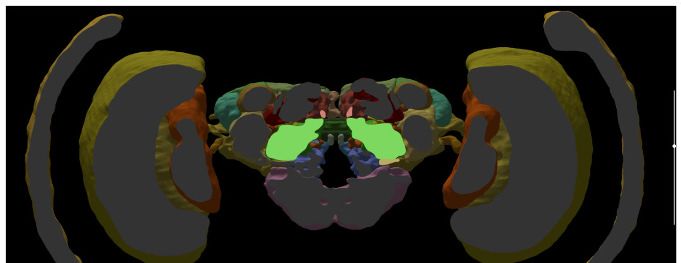
Tools and resources Neuroscience
Figure 2 continued
query individual neuropils for connected neurons by clicking the cross section. The inserts show the results view at three levels of the brain. Neuropils
connected to the queried neuropil are highlighted. Switching to the schematic view will then show the neurons as wiring diagram. Switching to the 3D
mode will show registered neurons in 3D. (E) The 3D results viewer allows one to view all neurons registered into a common reference frame; example
from Monarch butterfly (data from Heinze and Reppert, 2012) . The user can continuously switch between the three modes (schematic, semi-
schematic, 3D). All visualizations generated with Insectbraindb.org.
The online version of this article includes the following figure supplement(s) for figure 2:
Figure supplement 1. Schematic outline of generic brain and variations across species.
Figure supplement 2. Brain structures in the database and their hierarchical organization.
organization on the level of brain regions, while also serving as interface for launching search
queries. It comprises a full series of automatically generated sections through a segmented 3D brain
of a species. Each brain region present in that species’ 3D brain is shown as an interactive cross sec-
tion that can be used to query neural connections of that region (Figure 2D). If a region is selected,
all connected brain areas are highlighted and neurons resulting from this query can be visualized by
changing to either the schematic view, the 3D view, or a list view. The advantage of the anatomically
correct layout of this interface is that a brain region can be queried for a neuron, even if its name is
not known to the researcher. This is particularly useful for regions with uncommon names that have
only recently been introduced to the insect brain naming scheme (e.g. crepine, superior clamp, etc.,
see Insect Brain Name Working Group et al., 2014). Launching a search for neurons in regions
with unfamiliar names is made much easier when the search interface resembles the information a
researcher has obtained from, for example, confocal images or physical brain slices. The semi-sche-
matic mode of the database search function fulfills this demand and bridges the schematic wiring
diagram view and the full 3D view.
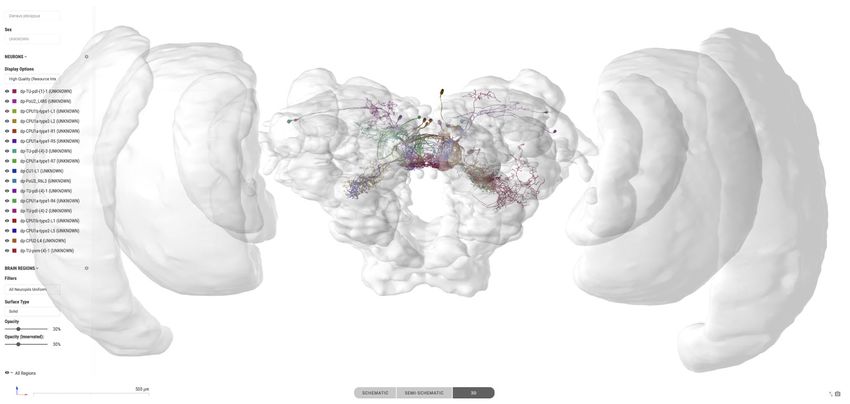
The 3D view visualizes search results in an anatomically correct way and shows queried neurons in
the context of a species’ reference brain (given that this information was added) (Figure 2E). It dis-
plays interactive surface models of that brain together with neuron skeletons obtained from the neu-
ron-type’s profile page.
In the graphical search interface the search parameters are limited to anatomical information
defining the neuron’s location in the brain (i.e. likely input and output areas). In contrast, an addi-
tional text-based search function (’Expert Search’) allows users to query all information deposited on
a neuron’s profile page. Individual search parameters can be logically combined to generate arbi-
trarily complex searches. The results are displayed as a list of neurons, which can be sent to populate
a schematic wiring diagram view by a single click. Thus, this tool effectively combines complex
search with the advantages of an intuitive display of results.
A different means of locating data on neurons and experiments is achieved via a publication
based search function. Each neuron and experiment that is associated with a publication becomes
automatically part of a dataset linked to this publication. By definition, experiments are only part of
one publication, while neuron entries can be referenced by many publications. In either case, users
can locate all data that has contributed to a specific piece of scientific literature.
Finally, whereas the emphasis of the database search lies on locating cell types, information on
brain regions can also be found using identical interfaces. The schematic search option allows users
to reveal brain region profile pages by selecting schematic neuropil representations. The same infor-
mation can also be obtained by selecting brain regions in the semi-schematic neuropil search
interface.
Online applications and tools
To maximize the usefulness of the database, we have implemented an integrated 3D viewer to
deliver platform independent, high-quality data visualization without any additional software
demands. Neuropil visibility can be independently switched on and off for each brain region, trans-
parency can be freely adjusted, and colors of neurons can be changed (Figure 3A). Neurons can be
shown either with diameter information or as simple backbones. The built-in screenshot function
enables the user to capture any scene displayed in the 3D viewer and produces a high-resolution,
publication-ready image with transparent background (Figure 3B,C).
Heinze et al. eLife 2021;10:e65376. DOI: https://doi.org/10.7554/eLife.65376 7 of 25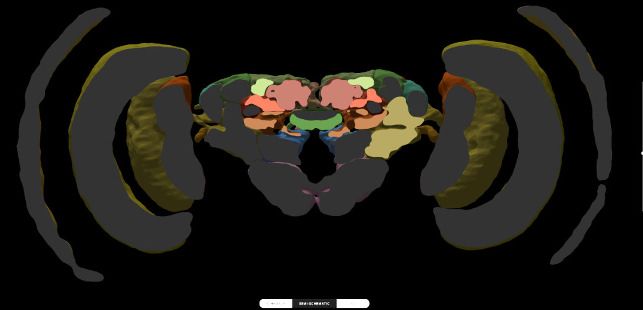
Tools and resources                                                                                                               Neuroscience

    A                                                                  B

                                                                            Monarch butterfly

    C
                                                                         Megalopta genalis (sweatbee)

                                                           Honeybee           Dung beetle

    D

                                                                                                AOTU-UU
                                                                           BU
                                                     FB/CBU
                                                                                                        AOTU-LU
                                   BU

                                                                                                  AOTU-NU
                                                          EB/CBL

    E

Figure 3. Visualization tools and applications. (A) Screenshot illustrating the functionality of the 3D viewer in the insect brain database. Cyan arrow:
Screenshot button. Cyan panel: Tools for adjusting appearance of neuropils. (B) Examples of neuropil images generated with the IBdb 3D viewer,
illustrating navigation relevant neuropils in three insect species (Monarch butterfly [Heinze and Reppert, 2012], sweat bee Megalopta genalis
[Stone et al., 2017], dung beetle [Immonen et al., 2017]). (C) Neurons associated with the antennal lobe of the honeybee, generated with the IBdb
Figure 3 continued on next page

Heinze et al. eLife 2021;10:e65376. DOI: https://doi.org/10.7554/eLife.65376                                                                        8 of 25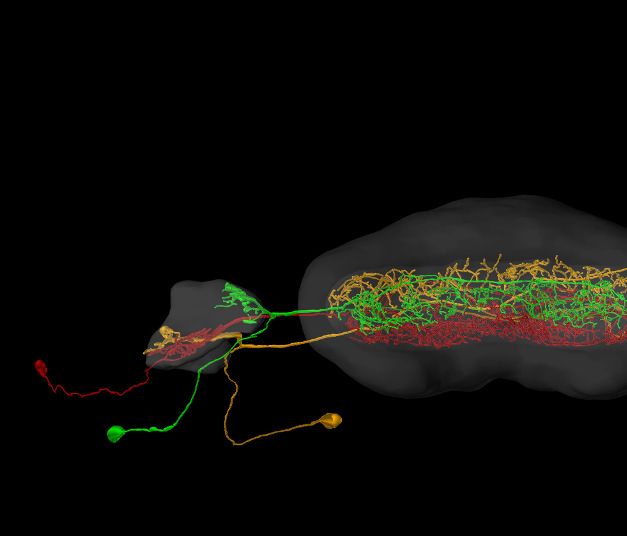
Tools and resources                                                                                                              Neuroscience

Figure 3 continued
3D neuron viewer (data from Rybak, 2012). (D) Elements in the neuron clipboard (left) can be arbitrarily combined and displayed in the 3D viewer to
highlight neural pathways and circuits. Shown are two parallel input pathways from the anterior optic tubercle to the ellipsoid body of the central
complex in the Monarch butterfly (data from Heinze et al., 2013). (E) Side-by-side neuron viewer. Screenshot showing comparison of 3D skeletons of
CPU1 (PFL) neurons from four species (top left: Monarch butterfly [Heinze et al., 2013]; bottom left: desert locust [El Jundi et al., 2009b]; top right:
Dung beetle [el Jundi et al., 2015]; bottom right: Bogong moth [de Vries et al., 2017]). All visualizations generated with Insectbraindb.org.

                                         The IBdb allows users to not only locate neuronal morphologies quickly, but also to combine arbi-
                                     trary neurons from any single species into a common visualization. To achieve this, we have gener-
                                     ated a neuron clipboard, in which individual neurons from search results can be stored temporarily
                                     (Figure 3D). Any subset of cells in the clipboard can be sent to the 3D viewer, as long as all neurons
                                     belong to the same species, that is can be displayed using the same reference brain. The desired
                                     configuration of neurons and neuropils can be generated using the interactive tools of the viewer
                                     and the screenshot function can be used to create a high-resolution image to be used for illustration
                                     purposes (e.g. reviews, conference talks, teaching).
                                         Additionally, we have embedded a function to directly compare up to four neurons side by side
                                     on screen. Any neuron located in the neuron clipboard can be chosen to be included in this compari-
                                     son. The comparison uses the 3D view, the profile image, or the confocal stack located on the
                                     respective neurons’ profile pages. This function is ideally suited to compare homologous neurons
                                     from across species to quickly assess differences and shared features of these cells. The four-window
                                     3D viewer retains all functions of the normal full screen 3D viewer and thus also allows the capture
                                     of high resolution screen shots of each of the neurons being compared (Figure 3E).
                                         The data in the database are suited for many applications, including more sophisticated ones. To
                                     provide direct access to all levels of the data in the IBdb we have created an API interface, specifying
                                     how to automatically draw data from the database via web-browser based apps. Applications pro-
                                     duced by third parties that use this function can be embedded directly on the IBdb website, once
                                     they are approved by the site administrators. Applications envisioned are, for example, quantitative
                                     comparisons of both single neuron morphologies and neuropils between species, direct online
                                     multi-compartment modeling of neurons deposited in the database, or virtual reality interfaces that
                                     allow exploration of anatomical data in a 3D virtual reality environment. Over time, we hope that our
                                     unified platform will stimulate the insect neuroscience community to generate a collection of online
                                     tools to analyze and explore neuroanatomical and physiological data deposited in the IBdb, thereby
                                     allowing straight-forward meta-analysis of all raw data deposited in the database. As an offline tool,
                                     the Natverse package in R already offers the possibility to explore IBdb data (Bates et al., 2020).

                                     Contribution of data
                                     All data on the internet is public. This also applies to any data publicly available in the IBdb. Driven
                                     by the requirement to obtain data persistency and implemented by the use of handles, no data can
                                     be removed from the database once it is public (and thus citable). For all data, the contributors
                                     retain ownership and hold the copyright to their data. The publishing is performed explicitly by the
                                     owners, not by the database administrators, and the license attached to each dataset is a Creative
                                     Commons Attribution Non Commercial 4.0 International (CC BY NC 4.0). Thus, when data in the
                                     IBdb are downloaded for reuse, the original work that underlies these data has to be credited
                                     together with the IBdb as the source. When data are used to generate images with the help of the
                                     IBdb, these images are licensed via Creative Commons Attribution 4.0 International (CC BY 4.0),
                                     that is they can be used in any publication as long as the original data owners and the IBdb are
                                     credited.
                                        Data can be contributed by registered users at all levels of the database, i.e. species, brain
                                     regions, neurons, and experiments. The process is similar on all levels but requires more expert
                                     knowledge the higher in the hierarchy the data reside. In the following sections we will briefly illus-
                                     trate the main principles of how to contribute data (for full instructions see the Online User Guide).

                                     Species
                                     To submit a new species, a profile page has to be created, which then has to be populated with
                                     data. While photographs, bibliography, and text descriptions of the species are desirable and

Heinze et al. eLife 2021;10:e65376. DOI: https://doi.org/10.7554/eLife.65376                                                                       9 of 25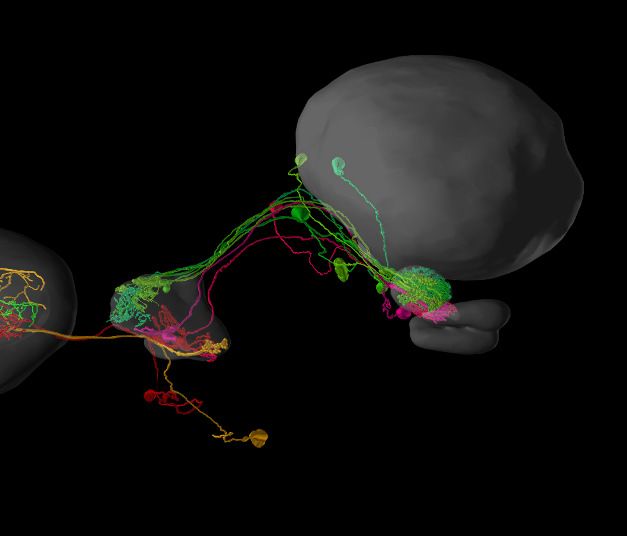
Tools and resources                                                                                                                    Neuroscience

                                              strongly encouraged, the most important next step is to generate a schematic brain (Figure 4A).
                                              This will ensure that brain structure entries are created in the database, a prerequisite for neuropil-
                                              based search and 3D brain region identity. To generate a schematic brain, we have created the
                                              ’Brain Builder’ tool on the IBdb website, which provides templates based on either the generic insect
                                              brain, or related species already deposited in the database. The user can simply copy an existing
                                              brain, associate it with the new species and modify it to match any unique features of the new spe-
                                              cies. Note that the ventral nerve cord (VNC), even though not part of the brain, was included as a
                                              single region as well, allowing to deposit information about VNC neurons as well and opening the
                                              possibility to expand the database beyond the actual brain in the future.
                                                 Once the profile page and the schematic brain is created, a 3D brain can be uploaded to illustrate
                                              the brain organization of the new species and to serve as reference brain for neuron display
                                              (Figure 4A). For all uploaded data, the database distinguishes between source files and display files.
                                              Source files contain the 3D reconstruction in a format that the researcher would like to make avail-
                                              able for others in the field. The second set of files, the display files, are required for automatic online
                                              display and must constitute the surface models of each neuropil (.obj-format). Each brain region
                                              model is tagged with a unique neuropil identity, so that the schematic brain regions and the 3D sur-
                                              face models will be linked to the identical brain-structure entry. Finally, following the same principles

    A                         Schematic Brain
                                                                                                                       Neuropil Profile Pages
      Owner tasks                                                                       User interaction        B

       Create online                                                                      Neuropil search
     with Brain Builder
                                                                                           Neuron search

                                                                                         Automatic generation
                                                                                             by database
                                   3D Brain                                                                         Owner task: Populate with images and text

                                                                                                                C     Semi-schematic Brain Display

                                                                                         Automatic generation
                                                                                             by database
      Upload individual                          Viewer files (.obj-files)
        neuropil files                                                                     Online display

        Upload original
                                                            +
                                       Source file link: labelfield_Megalopta.am             Download
          data file(s)

                                 Image Stack

                                                                                                                D       Species Profile Page

      Upload series of
    compressed images                            Viewer files (.jpeg-files)                Online display

         Upload original
                                                            +
        image stacks(s)              Source file link: confocal_stack_Megalopta.tif          Download               Owner task: Populate with images and text

Figure 4. Contributing a species to the IBdb. (A) Three main elements have to be created for each new species: the schematic brain, the 3D brain, and
an image stack. The schematic brain is generated directly on the IBdb website using the ’Brain Builder’, while the other two elements are uploaded. For
each, both source files and viewer files are needed. Viewer files are used for online display, while source files can be downloaded by users. (B) Neuropil
profile pages are automatically generated when creating the schematic brain. They have to be populated with images and texts by the user. (C) The
semi-schematic brain is automatically generated based on the provided 3D brain. (D) The species profile page must be populated with images, texts
and a bibliography to provide context for the species. Visualizations in A,B,c generated with Insectbraindb.org, Megalopta genalis data from
Stone et al., 2017.
Photograph in D reproduced with permission from Ajay Narendra.

Heinze et al. eLife 2021;10:e65376. DOI: https://doi.org/10.7554/eLife.65376                                                                                    10 of 25
Tools and resources Neuroscience
as for the 3D brain, an image stack can be uploaded to the profile page as well (Figure 4A). This
can be any representative dataset that illustrates the layout of the species’ brain (e.g. confocal stack,
mCT image series, serial sections with any other technique).
Brain structures
Brain structure entries are automatically generated when defining the schematic brain search inter-
face for a new species (Figure 4B). These profile pages are automatically populated by a 3D brain in
which the relevant region is highlighted, a brain structure tree that reveals the relative location of
the respective neuropil in the hierarchy of the species’ brain, and with links to neuron entries associ-
ated with each brain region. All remaining data have to be manually added. These are mostly
descriptive in nature and encompass images, text-based descriptions, and volumetric data.
Neurons
Contribution of neurons follows a similar procedure as the contribution of new species (Figure 5).
The user creates a profile page for the new cell type that subsequently has to be populated with
information. To make a neuron findable in the database, its arborization regions in the brain have to
be defined (Figure 5C). Within a graphical user interface, these regions are chosen from the brain
A Neuron Profile Page - Populate with Information
C Annotation of Arborizations
Annotate arborizations
Create neuron see C
by submitting Rich information
Define neuron path enables
basic information see D complex search
Add image (jpeg/png)
Add references
Add description Add keywords
Automatic generation
by database Add functional data Add credits
B 3D Skeleton
Define each arborization region
Specify as 'input', 'output' or 'unknown'
Makes neuron findable in graphical searches
Upload .swc
skeleton file(s) Viewer files (.swc-files) Online display Neuron Path Assistant
D
Upload original
+
Source file link: SkeletonTree_dpCPU1_R2.am Download
data file(s)
Image Stack
Upload series of Define order of innervations
compressed images Viewer files (.jpeg-files) Online display
Define branch-points
Upload original
+
image stacks(s) Source file link: confocal_stack_dpCPU1_R2.tif Download Enables automatic wiring diagram
Figure 5. Contributing a neuron type to the IBdb. (A) A new neuron type can be created by submitting a neuron form containing basic information.
This generates a neuron profile page that then has to be populated with information by the owner. Each entry is findable by the expanded search
function. (B) 3D-skeletons are added as swc-files (online display) and source files (download). Confocal image stacks are uploaded as jpeg series for
online display and as original data files for download. (C) All arborization regions of the neuron must be defined (at the level specified in the species’
schematic brain) and labeled as either input, output, or unknown polarity. (D) To enable automatic drawing of wiring diagrams in schematic search
results, the order of innervation of neuropils and the branch-points of the neuron must be defined using the path assistant. All visualizations generated
with Insectbraindb.org.
Heinze et al. eLife 2021;10:e65376. DOI: https://doi.org/10.7554/eLife.65376 11 of 25Tools and resources Neuroscience
structures available in the schematic brain of the respective species. One arborization entry has to
be created for each branching domain of the neuron, leaving no part of the neuron un-annotated.
To enable the automatic generation of a wiring diagram view of the new neuron for displaying sche-
matic search results, an outline of its branching structure has to be generated in an embedded tool
called the neuron-path assistant (Figure 5D). This branch tree defines which neuropils are innervated
in which order and where main branch points are located.
The remaining procedure for neuron contribution is largely identical to species contribution and
follows the dual approach towards source data and display data for 3D reconstruction and image
stacks (Figure 5B). All other information, that is images, bibliography, keywords, representative
functional data, transmitter content, and textual descriptions, can be added to the profile page at
any time prior to publication. To ensure common minimal standards and to avoid rudimentary data-
sets, several data fields have to contain valid information before a request for publication can be
made. These include an image of the neuron that allows to clearly identify the cell type, a complete
morphology section (including soma location, a description of the neuron’s morphology, and arbori-
zation regions), as well as a link to a publication (or preprint) that contains data on the cell type
depicted in the new entry. If no publication is available, a note in that section will state that the neu-
ron is not part of any publication.
Importantly, the IBdb can be used to house data that have been obtained by classical methods,
for example camera lucida drawings of Golgi impregnated neurons. While no 3D information is avail-
able in those cases, drawings can be uploaded as images after which annotation of the neuron’s
morphology (arborization regions) is performed as described. These neurons will therefore become
findable in the schematic search interface and will be added to the publicly available pool of neuro-
nal data. To allow these datasets to exist in the database, 3D reconstructions and image stacks are
not mandatory content. Similarly, 3D data that is not registered to a common reference frame can
be deposited in the database, with or without individual brain region reconstructions, but a shared
display in the context of a reference brain will not be available for these datasets.
Experiments
Experiment entries are created by adding them directly to the profile page to which they are linked
(species, brain structure, or neuron). The automatically generated experiment profile page must
then be filled with basic meta-information about the experiment (date, what was done, who did it),
after which a series of files can be uploaded. These files can be in any format and are made available
for download. This allows users to provide not only the raw data of any experiment, but also, for
example, analysis scripts, custom made equipment-control software, and analysis results. Image files
can be selected for direct online display on the experiment profile page to allow online examination
of the data. Importantly, experiment entries are independently published from neuron entries.
Curation and administration
The database is managed via a group of voluntary curators, a scientific administrator, and a technical
administrator. Importantly, no single person curates all data in the IBdb, but each species is man-
aged by a specialized curator, who is an expert for that species. This distributed curation system
ensures that no single person is responsible for too many datasets, and that no curator has to evalu-
ate data outside their area of expertise. To additionally reduce the workload for species with many
entries, more than one curator can be assigned to any given species. The scientific administrator
(the lead author of this publication) oversees the curators, while technical administration is carried
out by the technical administrator (last author of this publication). The technical administrator is the
only person who has potential access to all data in the database.
The responsibility of the scientific administrator is to approve new species and to train and sup-
port the curators for individual species. This training is carried out during a training period during
which actions of the curator have to be approved by the scientific administrator before they take
effect. Once a new curator is sufficiently trained to carry out all tasks independently, the scientific
administrator grants full curator privileges. The responsibility of each curator is to approve new neu-
ron-type datasets and to re-evaluate major updates of these (data re-approval). This process entails
checking for formal errors in the submitted data, ensuring that new data do not accidentally dupli-
cate already existing data, and that the quality of the data meets acceptable standards. To ensure
Heinze et al. eLife 2021;10:e65376. DOI: https://doi.org/10.7554/eLife.65376 12 of 25Tools and resources Neuroscience
swift correction of any issues, we have implemented a private communication channel between cura-
tor and data owner. This was realized through a commenting function that enables the curator to
post comments on a neuron page, which are only visible to the data owner. The owner can then
directly respond to the comments and any issues raised can be resolved.
While our distributed approach to curation has many advantages, it creates challenges towards
ensuring that curation of data across all species and levels is accurate, consistent and complete. We
have therefore designed multiple tools and features to facilitate effective and consistent data cura-
tion. Besides formalized training and approval for each new curator, we have provided checklists for
both data contributors and curators (found in the online help menu) that must be followed to ensure
that database entries fulfill predefined standards. Yearly meetings among all curators will ensure
that these standards are known and can evolve over time. If mandatory data is not provided by a
data contributor, request for approval of the dataset is automatically blocked, preventing rudimen-
tary datasets to enter the public section of the database. Finally, if an entry becomes obsolete,
for example when new research data provides conclusive evidence that cell types listed as separate
entries belong to the same type, existing entries can be archived. This process preserves the persis-
tent handle of the entry, but removes it from public lists and search results in the IBdb. This way,
references to these datasets remain resolvable, while, at the same time, obsolete data cannot clutter
the database. In the long run, this function provides the means to keep the database clean without
violating the principle of data persistence.
The definition of what constitutes minimal standards for a neuron or species entry reflects a scien-
tific consensus among curators. Rather than imposing these standards onto the field, the IBdb gen-
erates the means to develop a common set of rules by providing the platform for continued
discussions among curators as well as to reinforce an evolving consensus.
To enable all users to provide feedback and to discuss topics relevant to other database users,
we have added a discussion forum directly to the IBdb website. This forum is intended as a means
for reporting potential bugs, suggesting new IBdb features, or for discussing scientific content
(methods for data processing or acquisition, requests for literature, staining protocols etc.).
The IBdb as tool for data management and data deposition
Each database entry has to be explicitly published by the contributor. In the process, it is approved
by either the database administrator (species), or the species’ curator (neurons). While this proce-
dure was initially intended only as a quality control measure to prevent incomplete or inaccurate
data from compromising the database, we have developed it into a unique feature: the IBdb private
mode. Before a dataset is made public, it is invisible to all other users, curators and the scientific
database administrator. The dataset can thus be updated and even deleted. This creates the poten-
tial of using the IBdb to deposit data while they are being collected or prepared for publication in a
research paper, that is, for data management (Figure 6A). The API can be used to programmatically
integrate the IBdb into any individual data management workflow; a community driven MATLAB
implementation for automatic deposition of cell types and experiments is available on GitHub
(https://github.com/zifredder/IBdb-matlab).
To facilitate the use of the IBdb as a data management tool, we have enabled three operational
modes of the database site: private, public, and mixed. Any user logged in can thus choose to either
access only (own) private data, only public data, or both. The first mode turns the IBdb into a data
management site for ongoing research, the second mode is the default mode for viewing publicly
available data, and the third mode allows the user to compare their own unpublished data with pub-
lic data.
As efficient data management requires researchers from the same laboratory, as well as collabo-
rators, to have access to relevant unpublished data, each user can grant access to their own private
datasets (Figure 7). To this end, a user can create a user group and invite other database users to
join. Datasets can then be added and made visible or editable to all members of the group. These
data can either comprise individual entries at all levels of the database, or collections of entries
defined by common features.
Finally, users are often reluctant to make datasets available to the public before they are included
in a research paper, yet, these data should be available to editors and anonymous reviewers. We
have therefore created the possibility for ’pre-publishing’ database entries (Figure 6A). This function
allows a user to assign a persistent handle to a dataset (e.g. a neuron profile page) without approval
Heinze et al. eLife 2021;10:e65376. DOI: https://doi.org/10.7554/eLife.65376 13 of 25Tools and resources Neuroscience
A creates
/ deletes Owner
initiates invites
Private datasets User groups Selected Users
publish grants access
Pre-public datasets Reviewers/editors/selected users
Curator approval
Pre-publication handle
publish
Curator approval
Public datasets All users
Persistent handle
Creative Commons license
B
Public version 1
Current version (private) publish Persistent handle - Version 1
time 1
Public version 2
Owner re-publish
Evolving
Persistent handle - Version 2
Selected Users
...
Current version (private) re-publish Public version x
time x
Persistent handle - Version x
Figure 6. Dataset publication concept. (A) Interconnection of private, public, and pre-public datasets. Private datasets can be viewed and edited by
members of user groups with access granted to a particular dataset. Pre-public datasets can be viewed by anyone in possession of the pre-publication
handle (distributed by the data owner, e.g. within a manuscript). Public datasets can be accessed by all users. Publication of data cannot be undone as
persistent handles are generated. Gray arrows indicate control actions employed by the dataset owner. (B) Re-publication strategy of evolving datasets.
A current version of each public dataset remains present in the owner’s private database mode and can be edited at wish. Once sufficient updates have
accumulated, the dataset can be re-published. A new version of the persistent handle is assigned and the now public dataset (version 2) becomes
locked. Datasets can be edited by the owner and anyone who has been granted permission to edit by the owner.
by the curator and without making the dataset findable through search or lists in the IBdb. Editors
and reviewers of the research paper (anyone in possession of the handle) then have direct access to
the linked pages. Once the manuscript is accepted for publication, the user can submit the respec-
tive datasets for publication, obtain curator approval, and thus make them findable in the IBdb pub-
lic mode.
Heinze et al. eLife 2021;10:e65376. DOI: https://doi.org/10.7554/eLife.65376 14 of 25Tools and resources Neuroscience
App 1 Scientific Peers
Team members IBdb
Public section
Collaborators App 2
API
Pri
Private
Students
sec
section
App 3 General public
control
Contributor 1 Journalists
API
Funding bodies
Contributor 2
Arch
Archiving Datasets Educators
Curator
Journal Editors
Peer Reviewers Data Utilization
Data Management and Sharing Public Deposition
locked and public
locked and private (accessible with link)
Publication
private (can be deleted)
Figure 7. The Insect Brain Database and the possible interactions between users and deposited data. The private sections of the database are
accessible to only the owner of the data, and datasets within this section can be shared with team members and collaborators. Up- and download of
these data are possible either directly or via an application programming interface (API). As these datasets are unlocked, they can continuously be
updated and also be deleted. Upon publication and curator approval, datasets become locked (persistent) and are deposited in the public section of
the database. As an intermediate step, datasets can be pre-published (locked but private) and made available to journal editors and peer reviewers
when including datasets in manuscripts of journal articles. Data in the public section of the database are accessible directly for all interested users
(relevant user groups are shown on the right). Additionally, an API also allows automated access of public data, which can therefore be used by third
party applications (illustrated as ’App 1–3’) for generating specific user experiences with additional capabilities, for instance in the context of teaching.
To remove obsolete datasets from the public domain, they can be archived, a process that preserves persistence but prevents datasets from being
findable without the explicit handle.
The online version of this article includes the following figure supplement(s) for figure 7:
Figure supplement 1. Database usage statistics.
To avoid having to separately provide numerous independent handles when sharing data, individ-
ual entries can be grouped into datasets. These receive a unique link that grants access to the entire
collection. Only public or pre-public data can be included in datasets.
Public entries of the IBdb are maintained in a dual way; the persistent version is locked and can-
not be changed, whereas a second, current version remains visible to the owner and to all members
of user groups with appropriate access rights (Figure 6B). This current version is fully private and
can be freely edited or expanded. Importantly, no data that is already part of a public version can
be deleted. Rather, when for instance a confocal image stack should be replaced by a better one,
the old stack can be archived, so that it will not be visible in new versions of the dataset, but will
remain present in the database for display of earlier versions. Once all required updates of a dataset
have been made, the edited version can be re-published and will be assigned a new version of the
persistent identifier after re-approval by the assigned curator. This new version is now also locked
and any further edits will again have to be done in the current version of the dataset. This ensures
that all data that have been assigned a persistent identifier will remain valid and accessible, while at
the same time allowing each entry to evolve. The described strategy of publishing and re-publishing
Heinze et al. eLife 2021;10:e65376. DOI: https://doi.org/10.7554/eLife.65376 15 of 25Tools and resources Neuroscience
and the associated duality of persistent and current versions are implemented at the levels of spe-
cies, neurons and experiments.
Drosophila and interoperability with Virtual Fly Brain
The IBdb does intentionally not include Drosophila melanogaster as a species. This is because huge
efforts have been spent developing highly efficient resources for this widely used model system and,
as a result, the Virtual Fly Brain (VFB) resource has been created (Osumi-Sutherland et al., 2014). It
bundles data from several older Drosophila databases (e.g. FlyCircuit) to the most recent connec-
tomics datasets (Scheffer et al., 2020). Serving as the main repository for anatomical data from the
Drosophila brain it has become the main site to locate GAL4 driver lines, single-cell morphologies,
and synaptic connectivity data. It contains tens of thousands of datasets and is designed to specifi-
cally meet the needs of the Drosophila research community. By being less specialized, the IBdb has
a wider scope. We are hosting many species and include both functional and anatomical data. We
also do not require neuronal anatomies to be registered to a reference brain, if this is not possible
for some reason. This opens the IBdb up to more diverse data, but as a result cannot provide most
of the specialized services that VFB can deliver (e.g. automatic bridging registrations of 3D data
between different reference brains). Cross-linking the two databases to effectively enable comparing
neurons from the insect species deposited in the IBdb with Drosophila, nevertheless, was highly
desirable. Importantly, both databases have converged on highly similar hierarchical frameworks. As
the brain nomenclature used by the IBdb and VFB is identical, neuropil identities were mapped
across both databases. In cases were homology between corresponding neuropils is unclear, regions
map to the next higher order brain region (e.g. Monarch butterfly dorsal bulb maps to the entire
Drosophila bulb). For some neuropils, there are no known counterparts in the fly (e.g. the posterior
optic tubercle).
We use the APIs of both databases to allow direct communication between the IBdb and VFB. In
principle, when searching the IBdb for neurons, an API mediated query can be automatically sent to
VFB and search results are displayed as a list of single neuron entries. Each item on the list contains
information obtained from VFB and is directly linked to the corresponding entry at VFB. This feature
is available for the graphic, brain region based search. This includes complex multi-neuropil
searches, aimed at identifying neurons connecting several brain regions. Effectively, this enables a
user to launch a query in the IBdb and directly view corresponding neuron data in VFB, including
data from recent connectomics efforts (Scheffer et al., 2020). This seamless interoperability makes
maximal use of both complementary resources, without duplicating functionality.
Discussion
Specific problems solved by the IBdb
Previous and current online databases hosting insect neuroscience data have suffered from several
shortcomings: Most severely for old databases, a lack of maintenance often quickly led to outdated
file formats, rendering the deposited information no longer compatible for viewing with current web
browsers (anticipated by Ito, 2010). Second, while some databases originally allowed interactive
viewing of the data, no possibility for contribution of one’s own data existed and data download
was limited to very few files, for example Brandt et al., 2005, Kurylas et al., 2008. Usability of
larger databases was generally impaired by a layout that often required expert knowledge to be
able to launch meaningful database queries or to understand search results (e.g. FlyCircuit, Inverte-
brate Brain Platform [now: Comparative Neuroscience Platform]). This not only applies to old data-
bases, but the restriction to individual species and often highly complex interfaces limit the potential
user base to specialists even in cutting edge databases such as VFB or visualization tools such as
FruitFlyBrainObservatory. Finally, the limitation to purely anatomical data, including in the major cur-
rent cross-species database NeuroMorpho.org, does not account for one of the key advantages of
insect neuroscience: the high level of tractable structure-function relations.
The IBdb addresses each of these issues. Firstly, we have developed the database software to be
independent of the operating system and type of web browser used, as well as to not rely on any
third party plugins. Additionally, we implemented the database as a classic, relational database with-
out experimental data structures (e.g. intelligent, adaptive search), aiming at maximal robustness.
Heinze et al. eLife 2021;10:e65376. DOI: https://doi.org/10.7554/eLife.65376 16 of 25You can also read