A visual assessment scale for rapid evaluation of mangrove degradation, using examples from Myanmar and Madagascar subm. to IntechOpen as a book ...
←
→
Page content transcription
If your browser does not render page correctly, please read the page content below
A visual assessment scale for rapid evaluation of mangrove degradation, using examples from Myanmar
and Madagascar (subm. to IntechOpen as a book chapter in ‘Restoration of Mangroves’)
Christoph Zöckler*, Dominic Wodehouse** & Matthias Markolf***

*Manfred-Hermsen Foundation, Bremen, Germany

**Mangrove Action Project (MAP), Thailand

*** German Primate Center (DPZ) & University of Göttingen

Summary

Mangroves are globally threatened, disappearing and degraded. They are lost due to land use changes, mostly
agricultural expansion and aquaculture, but also degraded by cutting by villagers and logging and timber extraction
for domestic and economic purposes. Extent and conversion of mangroves can usually be estimated by applying
remote sensing and modern drone technology, but the scale of degradation of mangrove habitats is not easily detected
by such methods. In this paper we propose an assessment tool for a rapid evaluation on the degradation, using
examples from different regions in Myanmar and Madagascar. We propose a visual and practical guide listing a range
of 1-6 to identify and quantify the level of degradation. We demonstrate the application by displaying various examples
from Myanmar and Madagascar and how this tool can be used for wider applications, discussing advantages scope
and limitations.

Introduction

Globally mangroves are one of the most threatened ecosystems. In 1980 there were globally 198,000 km2 of
mangroves (FAO, 2003), but by 2003 this had reduced to 154,000km2 (FAO, 2007). By 2010, 38% of the global
mangrove cover had been lost and for Asia the figure is over 50% (Thomas et al. 2017) and the trend is still continuing
(Bryan-Brown et al. 2020). The main driver are agricultural expansion and aquaculture, while a growing rural
population increasingly encroaching remaining areas (Richards & Fries 2016). Moreover, the remaining mangroves are
widely subjected to degradation, threatened by legal and illegal logging for domestic and commercial use,
consequently reducing the ecosystem services that they provide as summarised for Myanmar (Zöckler & Aung 2019).

In 2000, Myanmar still had the seventh highest mangrove forest cover in the world, but between 2000 and 2012 had
lost mangroves at a much faster rate than almost any other country (Richards & Fries 2016, Hamilton & Casey, 2016,
Zöckler & Aung 2019). Myanmar continues to have a relatively high rate of loss of 0.8% per annum (p.a.) in the 21 st
century (Hamilton and Casey 2016). Specifically, 1924 – 1999, 83% of the mangroves in the Ayeyarwady delta in
Myanmar were cleared (Ohn, n.d. Webb et al. 2014). While this central delta area has suffered most of the losses,
the southern region of Taninthary still holds vast swathes of pristine mangrove.

Madagascar still holds large areas of mangrove forests, but many of them are also subjected to pressures from a
growing local population. In 2013 the total area of mangroves for the country, situated almost exclusively on the West
coast, was estimated at 303,000 ha. From 1990 to 2010 Madagascar experienced a net loss of about 21% of its
mangroves, a total of 2,868 ha per year (Razakanirina & Roger 2013, Jones et al. 2016). These losses are mainly due to
the massive exploitation of mangroves for firewood, charcoal and timber (housing and fencing), the development of
aquaculture, cyclones and others (Razakanirina & Roger 2013, Scales & Fries 2019).

But the rate of loss declined in recent years and globally mangroves have become prime conservation targets (Fries et
al 2020). While in the period from 1990-2000 there was a net loss of almost 12% (or 34,418 ha) of Madagascar's
mangroves, the net loss in the period of 2000-2010 was estimated at 22,941 ha or 8.6%), the most significant of which
are in the Tsiribihina Delta (4,177 ha/25.5%) (Razakanirina & Roger 2013). The mangroves of the area, however, are
still one of the largest remaining dense mangroves in Madagascar (Jones et al. 2016).

Restoration and rehabilitation efforts have largely focused on areas previously covered by mangroves (e.g. Lewis et
al., Ellison et al. 2020), but little attention has been paid to rehabilitating degraded mangrove areas. It is important to
be able to describe degraded mangrove areas that would benefit from improvement activity such as the enhancement
of hydrological connectivity and protection measures. Rehabilitation will increase their ability to provide the full range
of ecosystem services as well as preserve the whole ecosystem integrity. Therefore, the proposed degradation scale
can also provide a reliable and cost-effective methodology to accurately describe mangrove conditions, also in recently
restored conditions.

Despite constantly improving technologies, remote sensing and more recently drone-based surveys, have struggled to
depict accurately the condition of mangroves (Hamilton & Casey 2016, Yong 2016). Although mangrove conversion
and deforestation can reliably monitored using such techniques, mangrove loss is only one indicator of mangrove
status and the importance of mangrove degradation has gained considerably less attention (Worthington et al. 2020).
Modern technologies still fail to reveal the scale and the extent of forest degradation and hence poorly describe the
state of the remaining forest (Giri et al., 2011, Jones et al. 2016). While it is acknowledged that there have been great
strides in the development of remote sensing and drone/LIDAR capability, this technology will not be available to local
NGOs, government mangrove agency field offices and village conservation groups until it becomes much cheaper and
simpler.

Therefore, we propose here a rapid assessment tool that is ground- or boat-based, which uses visible features of the
mangrove forest structure. This is a simple tool to describe and categorise mangrove forest degradation for Indo-west
Pacific non-arid areas, using photographic examples from Myanmar and Madagascar. Comments and suggestions from
the mangrove community are welcomed to improve this degradation scale.

There is an increasing need in identifying the real status of mangroves, its ecosystem health and the scale of
degradation. Degraded mangroves can give a false impression of superficially healthy appearing mangroves but might
no longer fully provide the full range of expected ecosystem services, such as the buffering the storm surges, benthic
biomass production and others (Carugati et al. 2018).

Methodology

The authors visited several different sites between 2013 and 2019 in SE Asia and Africa to assess their conservation
status and degree of degradation. The mangroves of Taninthary in southern Myanmar were visited eight times
between Dec 2013 and Nov 2019. Mangroves further north on the west coast of Myanmar in the Ayeyarwady Division
were surveyed in January and February 2016, (Zöckler & Moses 2016, Zöckler 2016). Most of the surveys were
conducted using small boats, but many mostly non-estuarine mangroves were surveyed on foot and some even
accessed by motorbike. These ground surveys were essential to access the interior of mangrove areas.

Georeferenced point assessments were conducted using a specifically designed KOBO smart phone app that uses our
proposed mangrove degradation scale from 1 (very poor) - 6 (excellent), see Table 1. Inevitably the GPS point taken
with the smart phone app is likely several meters up to 200m distant from the actual observed mangrove stand
providing inaccuracies that can be ignored as they give a rough first assessment of the mangrove near by. However
the GPS points do not allow accurate anaylsis using remote sensing tools. Where possible, visible additional
information on the causes of mangrove loss were noted. The app is designed to be simple and user friendly.
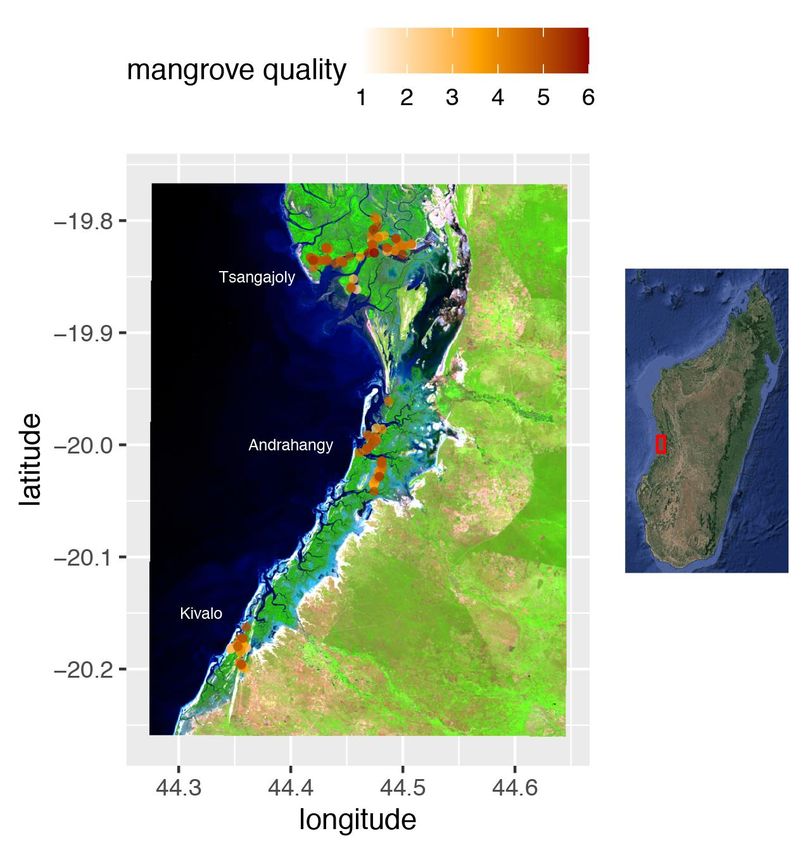
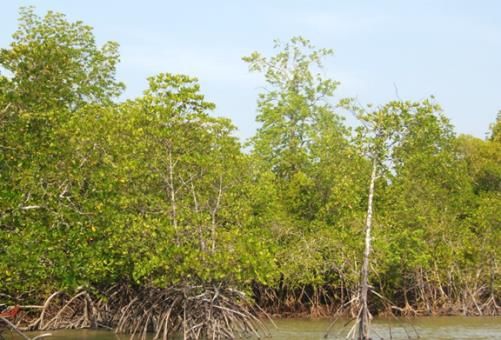
Table 1: Mangrove degradation scale 1 - 6, based on mangrove forest structural features such as shape, height, visible logging, light reaching the
mangrove floor and stem diameter of the remaining trees. This scale is not applicable in northern latitudes where cryptic mangrove stands are
reaching their limits of range, such as in southern China, North Vietnam, the Red Sea and North Africa. This scale is also not relevant within arid
mangrove zones.

 Scale
 1       Shape: Very low / very few
         mangroves.

         Height:
3   Shape: Low forest. Dense, bushy
    vegetation. Young trees, saplings.
    Often a heterogeneous mix of gaps
    and a few young trees.

    Height: 2-5m. Very few trees taller
    than 5m / 20cm DBH.

    DBH of Remaining Mangroves:
    15cm DBH)
    were removed, stumps of which
    might be visible. Gaps might also
    have been produced by logged
    trees damaging neighbouring trees
    / saplings when felled.

    Light to floor: 25-75%

    Notes: Forest will have a lot of
    gaps, but is likely to have enough
    seeding trees to regenerate.
    (Difficult to depict as similar to
    level 4, but overall tree height
    lower and less homogeneous in
    structure.)

4   Shape: Mangrove clearly defined
    in the shape of forest with gaps in
    between few larger trees, but
    more even canopy than in Level 3.

    Height: > 6-12m

    DBH of Remaining Mangroves:
    20cm and larger unless a densely
    stocked plantation.

    Logging: All the very big trees have
    been logged as well as some of the
    mid-sized trees.

    Light to Floor: 25-75%

    Notes: In a plantation forest, the
    majority of trees are in place, but
    some stems have been removed
    ( 12m

    DBH of Remaining Mangroves: Up
    to 1m DBH

    Logging: Only a few trees extracted
    and few cut stumps evident.
Light to Floor: 12m.

        DBH of Remaining Mangroves: Up
        to and over a 1m.

        Logging: N/A. Trees intact. Very
        limited extraction.

        Light to Floor:
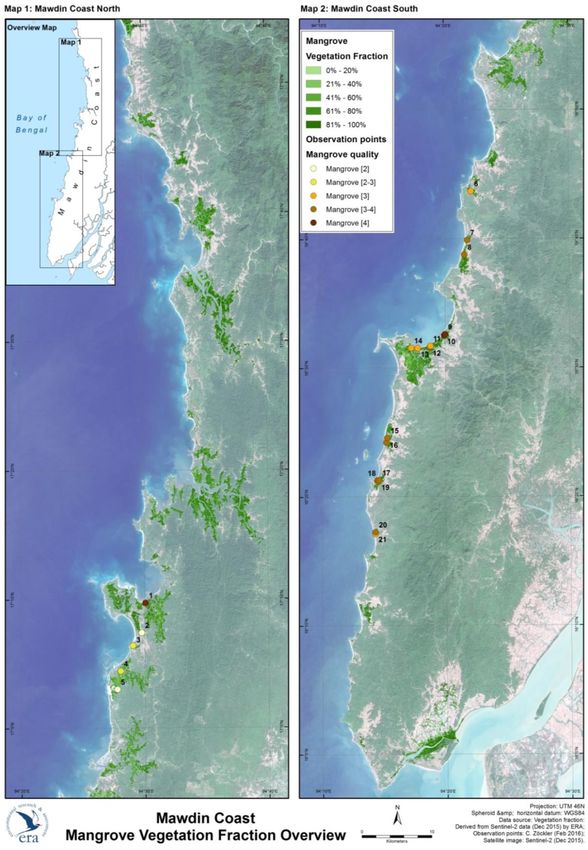
Fig 1: Mangrove status of non-estuarine mangrove stands on the Mawdin coast in the Ayeyarwady Region on the west coast of Myanmar (Harris
et al. 2016). Each symbol represents an assessment point (21)
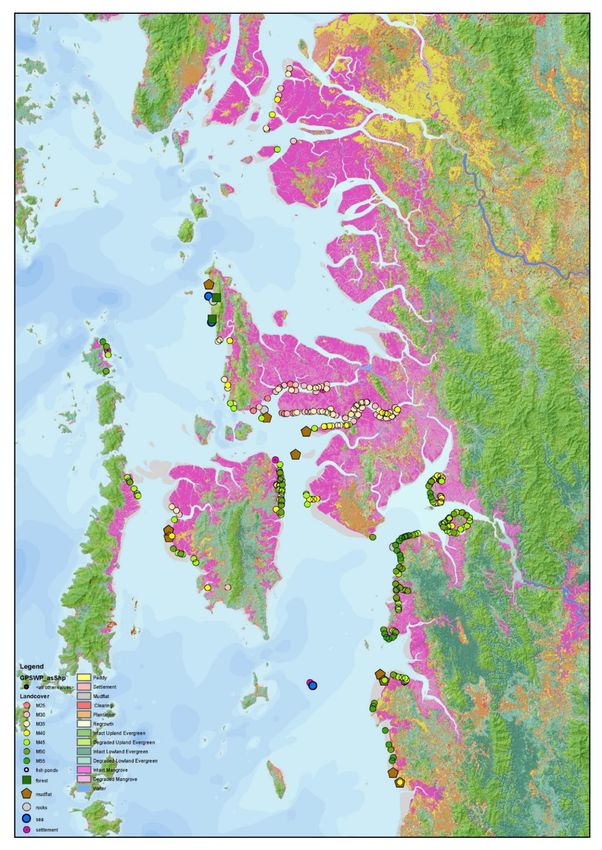
Fig 2: Mangrove distribution (pink) and status in the mangroves within the Myeik archipelago, Taninthary, Myanmar in 2016, based on our scale
with symbols from 2.5 (pale pink) to 5.5 (dark green) and based on 282 assessment points (100 in the northern part and 182 in the southern part,
(Zöckler et al. 2016). see also table 2.
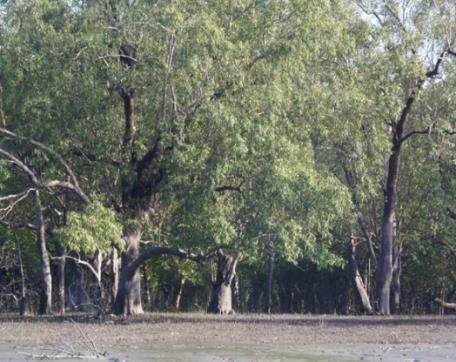
Fig 3 Left: Landsat 8 Image with remaining vegetation and the mangrove degradation status in three sub-regions in the Menabe Antimena
Protected Area, Western Madagascar. A total of 114 assessments points were taken across all three areas. Right: Location (red square) of
surveyed area in Madagascar.

Summary assessment of selected mangrove areas

Table 2: Average Mangrove Degradation (range from 1 = much degraded to 6 = intact, high-quality) at selected sites
in Myanmar and Madagascar between 2016-2019 (Zöckler & Moses 2016, Zöckler 2016, Zöckler et al 2019).
No      Site                                        Average mangrove quality and             No of mangrove
                                                         range of assessments                assessment points
         Myanmar (see Figs. 1,2)
 1       Mawdin Coast, Ayeyarwady Division                     3.2 (2.0-4.0)                          21
 2       North of Myeik, Taninthary                            3.4 (3.0-5.5)                         100
 3       South of Myeik, Taninthary                            4.5 (3.5-5.5)                         182
         Madagascar (Menabe) (see Fig.3)
 1       Tsangajoly/ Baie de Borongeny                         4.0 (3.5-5.0)                          58
 2       Andrahangy                                            3.8 (3.0-4.5)                          29
 3       Kivalo                                                3.3 (3.0-4.5)                          27

Table 2 shows the average degradation levels observed in different coastal regions in Myanmar and Madagascar. The
first area on the Mawdin coast was based on a small sample size (n=21). It suggests a relatively low average of just
over 3, reflecting the wide-scale destruction and degradation of mangroves in the region as well as early stages of
rehabilitation efforts.

In the Taninthary region, the northern side, closer to the business capital Myeik, appears to have suffered more
mangrove losses and disturbances, The degradation is a lower with a score of 3.4 than the southern more remote
mangroves around Whale Bay and Kan Maw island which averaged over 4.5 (see Fig. 3). This suggests that the
southern mangroves are healthier than the northern mangroves of Taninthary.
Madagascar also displayed differences in mangrove status in the three selected sub-regions (see Table 2 and Fig.3).
Kivalo, followed by Andrahangy and Tsangajoly/Baie de Borongeny showed the highest overall degradation. Although
this was not specifically tested, it might well be due to higher population densities in the southern areas, which are
closer to the biggest regional city of Morondava. All three areas show significant signs of degradation of which most
are rather unlikely to be detected using methods of remote sensing. Most signs of degradation were spatially
associated with local communities depicting increased pressure to the mangroves mainly due to logging for fire wood
and construction material. Over exploitation of mangrove wood in the region by local fisherman for cooking, treatment
of fishery products, and construction of boats and houses was already described by Rasolofo (1997). In some surveyed
areas, grazing of zebu or goats also present increasing threats to mangroves.

Discussion

This simple, rapid degradation assessment tool allows the assessment of the present status and degree of degradation
of a mangrove forest, but it also demonstrates the state of forest succession and rate of restoration after intervention
and restoration activities have taken place. The tool is applicable over at least the Indo-West Pacific and West-Indian
Ocean regions in non-arid situations, where high salinity is not the limiting factor. In the northern margins of the
mangrove belt mangroves develop much smaller ‘dwarf versions, which do not allow the application of the full range
of the degradation scale, especially height is not applicable here. We hope that beyond these areas, where similar
species at genus level provide comparable forest structures, this assessment tool will also allow comparisons across
regions and possibly also for mangroves across the Pacific, Caribbean and South America.

Like any tool this degradation scale approach has its limitations. It only provides a restricted window from the sea
front or from a boat, at best within navigable channels or small access roads, excluding large areas of the inner part of
the mangroves, which are often, especially in levels 3 and 4, also inaccessible on foot. While this is certainly a
restriction, this rapid assessment tool is only meant to provide an initial, qualitative assessment of damage by logging
and cutting or other degrading activities. We are encouraging assessors to get out of survey boats as much as possible
to provide additional survey points on foot. In addition, assessments might be hampered by observer bias or difficulty
allocating local degradation to the appropriate class.

This degradation scale has not been tested and verified, but initial comparisons by different observers using the same
locations did not indicate a significant difference in the assessment results. This first draft would benefit from further
testing in other mangrove systems including non-deltaic mangroves to develop a more robust scale of degradation.
Later on, a combination of this rapid assessment tool together with drone surveys would provide a more accurate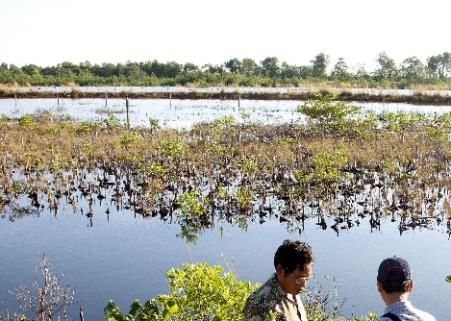
scale of degradation and present status of any chosen mangrove forest. Repeated surveys are encouraged as they
could reveal changes in the status of a mangrove stand over time. This would be particularly valuable to assess the
effectiveness of in-situ protection measures, community forest agreements and active restoration schemes if baseline
data is collected before, and then at intervals afterwards. Additionally, it is hoped that the scale can be tested and
used on its own by community groups and government mangrove agency field officers to assess and rank their
mangroves in order to prioritise rehabilitation and protection measures. Being simple and cheap the proposed rapid
assessment tool has major advantages in comparison with remote sensing and LIDAR approaches and could provide
substantial benefits to community-based mangrove conservation projects.

The tool offers the identification of degraded areas that have not appeared to be in need for restoration based on
superficial consideration or often remote sensing. In addition the tool can also been applied in recently restored
mangroves and plantations and could also provide a good measure for success of the restoration projects and
activities, whereby the age of the restoration activities need to be taken into consideration. It also allows comparisons
and can point to errors and failures of the restoration efforts and invite mitigating measures.

In comparison to deforested mangroves, areas with reversible mangrove degradation represent opportunities for
rapid and effective conservation mitigations, and thus can substantially facilitate mangrove restoration initiatives
(Worthington and Spalding 2018). The tool provides rapid and effective identification of sites most suitable for
mangrove rehabilitation.

We would welcome input, comments and improvements, including extra photos, particularly from groups that have
tried to use this scale. Eventually it will be available for download and printing as well as a smart phone app. It is
suggested that a version of it is laminated for use in the mangrove while conducting surveys.

Acknowledgements

We are very grateful for Fauna Flora International (FFI) and the Manfred-Hermsen Foundation who have supported
the mangrove surveys financially and logistically and encouraged the development of a rapid assessment tool. In
particular we like to thank Frank Momberg (FFI) for his vision and support for coastal mangrove surveys and Mark
Grindley (FFI) for his continued support. Patrick Oswald and Milan Fanck helped with the GIS mapping. Surveys in
Madagascar were supported by Chances for Nature and the Stiftung Artenschutz.

References

Bryan-Brown, D. N., Connolly, R. M., Richards, D. R., Adame, F., Friess, D. A., & Brown, C. J. (2020). Global trends in
mangrove forest fragmentation. Scientific Reports, 10(1), 1-8.
Carugati, L., Gatto, B., Rastelli, E., Lo Martire, M., Coral, C., Greco, S., Danovaro, R., 2018. Impact of mangrove forests
degradation on biodiversity and ecosystem functioning. Scientific Reports 8. https://doi.org/10.1038/s41598-018-
31683-0
FAO, 2003. Status and trends in mangrove area extent worldwide, in: Wilkie, M.L., Fortuna, S. (Eds.), Forest Resources
     Assessment Working Paper No. 63. FAO, Rome, Italy.
FAO, 2007. The world’s mangroves 1980-2005. FAO For. Pap. 153, 89. https://doi.org/978-92-5-105856-5
Friess, D. A., Yando, E. S., Abuchahla, G. M., Adams, J. B., Cannicci, S., Canty, S. W. & Diele, K. (2020). Mangroves give
      cause for conservation optimism, for now. Current Biology, 30(4), R153-R154.
Giri, C., Ochieng, E., Tieszen, L.L., Zhu, Z., Singh, A., Loveland, T., Masek, J., Duke, N.C., 2011. Status and distribution of
       mangrove forests of the world using earth observation satellite data. Glob. Ecol. Biogeogr. 20, 154–159.
       https://doi.org/10.1111/j.1466-8238.2010.00584.x
Ellison, A. M., Felson, A. J., & Friess, D. A. (2020). Mangrove Rehabilitation and Restoration as Experimental Adaptive
Management. Frontiers in Marine Science.
Hamilton, S.E., Casey, D., 2016. Creation of a high spatio-temporal resolution global database of continuous mangrove
forest cover for the 21st century (CGMFC-21). Glob. Ecol. Biogeogr. 25, 729–738.
https://doi.org/10.1111/geb.12449
Harris, C., K . Lorenz & C. Zöckler. (2016). Land cover classification, Mawdin Coast, Ayeyarwady Division, Myanmar.
Unpubl. Report for Fauna Flora International. 27p
Jones, T., Glass, L., Gandhi, S., Ravaoarinorotsihoarana, L., Carro, A., Benson, L., Ratsimba, H., Giri, C.,
Randriamanatena, D., Cripps, G., 2016. Madagascar’s Mangroves: Quantifying Nation-Wide and Ecosystem Specific
Dynamics, and Detailed Contemporary Mapping of Distinct Ecosystems. Remote Sensing 8, 106.
https://doi.org/10.3390/rs8020106
Lewis III, R. R., Brown, B. M., & Flynn, L. L. (2019). Methods and criteria for successful mangrove forest rehabilitation.
In Coastal wetlands (pp. 863-887). Elsevier.
Ohn, U., n.d. Coastal Resource Management with Special Reference to Mangroves of Myanmar. FREDA.
Rasolofo, MV (1997) Use of mangroves by traditional fishermen in Madagascar. Mangroves and Salt Marshes 1:243-
253.
Razakanirina, H. & E. Roger (2013). Mangrove status and management in the Western Indian Ocean Region:
Madagascar. WIOMSA. 29p.
Richards, D.R. & Friess, D.A. 2016. Rates and drivers of mangrove deforestation in Southeast Asia, 200-2012. PNAS 113
(2): 344-349
Scales, I.R., Friess, D.A., 2019. Patterns of mangrove forest disturbance and biomass removal due to small-scale
harvesting in southwestern Madagascar. Wetlands Ecology and Management 27, 609–625.
https://doi.org/10.1007/s11273-019-09680-5
Thomas N, Lucas R, Bunting P, Hardy A, Rosenqvist A, Simard M (2017) Distribution and drivers of global mangrove
forest change, 1996–2010. PLoS ONE 12(6): e0179302. https://doi.org/10.1371/journal.pone.0179302
Webb, E.L, Jachowski, N.R.A, Phelps, J., Fries, D. A., Than ,M.M. & Ziegler, A.D. 2014. Deforestation in the Ayeyarwady
Delta and the conservation implications of an internationally-engaged Myanmar. Global Environmental Change
24: 321-33. doi:10.1016/j.gloenvcha.2013.10.007
Worthington, T. A., Andradi-Brown, D. A., Bhargava, R., Buelow, C., Bunting, P., Duncan, C., ... & Lagomasino, D. (2020).
Harnessing Big Data to Support the Conservation and Rehabilitation of Mangrove Forests Globally. One
Earth, 2(5), 429-443.
Worthington, T., and Spalding, M. (2018). Mangrove Restoration Potential: A Global Map Highlighting a Critical
Opportunity. https://doi.org/ 10.17863/CAM.39153.
Yong, J., W., H., 2016. An Ecological and Plant Biodiversity assessment of the Meinmahla Kyun Wildlife Sanctuary
(MKWS) in relation to biodiversity conservation and restoration, and human livelihood. FFI report. 37 pp.
Zöckler, C. & Saw Moses. 2016. Bird survey report Eastern Delta and Mawdin Coast, Ayeyarwaddy Region, Myanmar,
18 – 28 February 2016. Unpubl. Report for FFI
Zöckler, C., 2016. Bird Fauna of the Southern Myeik Archipelago: Report on Historic and New Surveys in the Tanintharyi
Coast of Southern Myanmar. Report No. 32 of the Tanintharyi Conservation Programme. Yangon, Myanmar.
Zöckler C., Aung C. (2019) The Mangroves of Myanmar. In: Gul B., Böer B., Khan M., Clüsener-Godt M., Hameed A.
(eds) Sabkha Ecosystems. Tasks for Vegetation Science, vol 49. Springer, ChamYou can also read