Accelerating and Smoothing the Clean Energy Transition
←
→
Page content transcription
If your browser does not render page correctly, please read the page content below

Chapter 7

         Accelerating and Smoothing the
            Clean Energy Transition
Responding to the severe risks of climate change ranks among the most
important and difficult challenges facing the United States. Levels of
heat-trapping carbon dioxide in the atmosphere are higher than they have
been in millions of years, causing gradually increasing temperatures and
sea levels and worsening the catastrophic consequences of hurricanes,
wildfires, and other extreme events. Along with the governments of other
major greenhouse-gas-emitting countries, the Biden-Harris Administration
has declared the United States’ intention to rapidly reduce greenhouse gas
emissions to avoid the worst consequences of climate change.

Because three-quarters of human-caused U.S. greenhouse gas emissions
come from burning fossil fuels for energy, the most important step in reduc-
ing emissions is to shift from carbon-intensive to clean sources of energy
(U.S. Energy Information Administration 2021a)—in short, to pursue a
clean energy transition. A large and robust economics literature shows how
policies can accelerate this energy transition by encouraging cost-effective
emissions reductions. Completing this transition by mid-century would
constitute a transformation of the energy system at a pace without precedent,
and mark a giant achievement in human history, given the scale of the
avoided damage to current and future generations (Newell and Raimi 2018).

President Joseph R. Biden has also committed to build a clean energy supply
chain stamped “Made in America,” reflecting the considerable economic
opportunities and associated challenges presented by the energy transition.
One challenge is how to support America’s continued industrial strength

                                                                         221
and energy security. Doing so will require government actions that enable
U.S. firms to compete on a level playing field in emerging global industries,
especially given the degree to which other countries are supporting their
own domestic firms.

Another challenge presented by the transition is how to best support the
communities across the United States that depend on carbon-intensive
industries for jobs and tax revenue. In the past, when American communities
have faced employment losses due to economic shocks—such as recessions,
trade with China, and automation—workers and their families largely have
not moved to communities where jobs are more plentiful, raising the impor-
tant policy question of how to help people in the places where they are.

This chapter highlights what economics can tell us about effective policy
strategies to accelerate and smooth the United States’ clean energy transi-
tion. The first section provides background on climate risks, global progress
in mitigating these risks, and the policies that will accelerate the transition.
The second section describes the opportunities and challenges of support-
ing those domestic industries and communities that are most affected by
the transition. The chapter concludes by highlighting the interdependency
between the strategies to accelerate and to smooth the transition.

                Accelerating the Energy Transition
The widespread adoption of fossil fuel energy technologies powered the
steamships and factories that made the Industrial Revolution possible,
and has helped spur economic growth for over a century (U.S. Energy
Information Administration 2011; Friedrich and Damassa 2014). The burn-
ing of fossil fuels has also led to the rise in human-made carbon dioxide
(CO2) emissions, which is changing the composition of the atmosphere and,
with it, environments around the globe. Over the 800,000 years before the
20th century, the atmospheric concentration of CO2 vacillated between 150
and 300 parts per million, creating a climate hospitable for the world’s devel-
opment, as detailed in figure 7-1. In early 2022, CO2 concentration levels are
well above 400 parts per million and are continuing to grow. Because CO2
is a heat-trapping greenhouse gas, rising levels in the atmosphere have led

222 |   Chapter 7
Figure 7-1. Atmospheric CO2 Level Across the Millennia to 2019
CO2 level (parts per million)
450
                                                                                                         Current
                                                                                                          level
400

350
                                                                                                         1950
                                                                                                         level
300

250

200

150
 –800,000        –700,000       –600,000   –500,000   –400,000      –300,000   –200,000   –100,000   0        100,000

                                                      Years before today
Source: NASA (2021).
Note: CO2 = carbon dioxide.

to increasing temperatures, higher sea levels, more acidic oceans, and more
frequent and severe cases of extreme weather and climate events (Zickfield,
Solomon, and Gilford 2017; Bijma et al. 2013; Stott 2016).
      Climate change poses considerable risks to the global economy.
Climate-driven extreme events and biodiversity loss can result in cascad-
ing damage to such critical and interconnected systems as energy, public
health, water, and food (Garcia et al. 2018; Porter et al. 2021). In the United
States, estimated damage from storms, floods, wildfires, and other extreme
weather events has grown to about $120 billion a year over the past five
years (Smith 2021). Climate change disproportionately harms low-income
and historically marginalized populations, because vulnerable individuals
lack the resources to adequately prepare for or cope with extreme weather
and climate events (U.S. Global Change Research Program 2018).
      Because the rapid increase in greenhouse gases in the atmosphere is
an ongoing planetary experiment, future damage from climate change is
difficult to forecast precisely, and empirical estimates cover only a subset
of likely effects. A 2017 meta-analysis finds that an increase in global tem-
peratures of 5.4 degrees Fahrenheit (3 degrees Celsius) over preindustrial
levels—a threshold that could be surpassed later in this century absent strong
policy interventions—could cause economic damage equivalent to 7 to 11
percent of global gross domestic product (GDP) (Howard and Sterner 2017).
In addition, studies that estimate the economic effects of climate change
often fail to account for important aspects of climate change’s impact on
public health, including temperature-related mortality (Bressler 2021) and
the deaths and sicknesses caused by local pollution from fossil-fuel-related
emissions (Shindell et al. 2018; Scovronick et al. 2019).

                                       Accelerating and Smoothing the Clean Energy Transition | 223
Global Efforts to Reduce Greenhouse Gas Emissions
Average global temperatures have already risen about 1 degree Celsius
above preindustrial levels (NASA 2021). CO2 remains in the atmosphere for
centuries, so our continued emissions will cause temperatures to continue to
increase (Archer et al. 2009).
      We can slow the pace of temperature increases by reducing global
emissions, but halting global warming requires achieving net zero CO2 emis-
sions (Net Zero Climate 2022). Considerable momentum toward this goal
is building worldwide. The world’s major countries committed in the 2015
Paris Agreement to keep global warming well below 2 degrees Celsius above
preindustrial temperatures, which is likely to require net zero emissions at
the global level between 2050 and 2070 (UNFCCC 2021). Many countries,
including the United States, have coalesced around a goal of net zero emis-
sions by 2050. President Biden has additionally committed the United States
to halve its net greenhouse gas emissions by 2030 (using a 2005 baseline)
(McCarthy and Kerry 2021). In the European Union, the United Kingdom,
and Japan, mid-century net zero emissions targets are stipulated by law
(European Commission 2021a; Climate Change Committee 2021; Jiji Press
2021). The world’s largest emitter of greenhouse gases—China—has com-
mitted to net zero emissions by 2060 (Myers 2020). Many of the world’s
largest companies have also made pledges to cut emissions to net zero,
including financial institutions responsible for over $130 trillion in assets
(Glasgow Financial Alliance for Net Zero 2022).
      Global annual CO2 emissions have begun to level off after centuries of
increasing, partially as a consequence of this momentum (Our World in Data
2020). A recent United Nations report declares that the peaking of annual
global emissions by 2030 is within reach (UNFCCC 2021). The projections
of future global CO2 emissions by the International Energy Agency (IEA),
displayed in figure 7-2, also show annual global emissions peaking and then
beginning to decline in the decades ahead.
      But to achieve the climate goals specified seven years ago in the Paris
Agreement, the energy transition will need to accelerate markedly from cur-
rent trends: a recent study estimates that without additional policy actions,
there is less than a 10 percent probability that temperatures will stay below
2 degrees Celsius above preindustrial temperatures by 2100 (Ou et al. 2021).
Figure 7-2 shows that in 2040, global emissions under currently announced
or implemented policies are projected to be seven times higher than emis-
sions under a scenario in which the world is on pace to achieve net zero
emissions by mid-century (IEA 2021b).

224 |   Chapter 7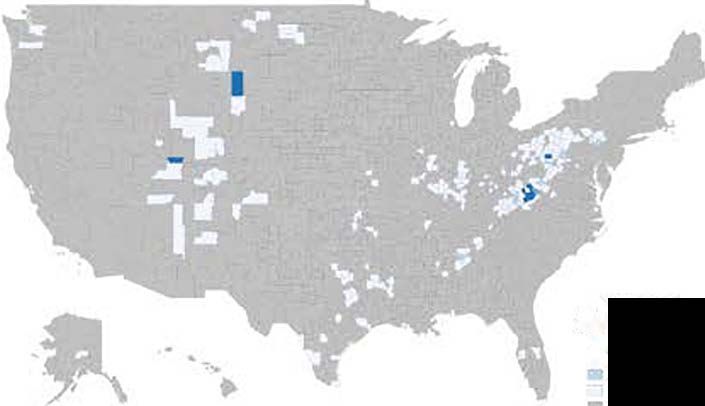
Figure 7-2. Global Carbon Dioxide Emission Projections, 2025–40
Million metric tons
  40,000

  35,000

  30,000

  25,000

  20,000

  15,000

  10,000

    5,000

         0
          2025    2026    2027     2028    2029    2030    2031     2032    2033    2034     2035    2036    2037    2038     2039    2040
                            WEO 2014                           WEO 2021                             Sustainable development scenario
 Source: International Energy Agency (IEA 2014, 2021), World Energy Outlook (WEO).
 Note: The WEO 2014 and WEO 2021 scenarios reflect projections that assume existing policy frameworks and
 announced policy intentions. The IEA’s Sustainable Development Scenario outlines how the world can deliver on the three main energy-
 related goals: achieving universal access to energy, reducing the severe health effects of air pollution, and tackling climate change.

Accelerating the Energy Transition in the United States
An effective response to climate change requires policy actions around the
globe, starting here at home. The United States’ annual greenhouse gas
emissions are surpassed only by those of China, and our cumulative emis-
sions are larger than those of any other country (Ritchie and Roser 2020;
Our World in Data 2020).
      Shifting from carbon-intensive to carbon-free energy systems is the
major challenge to achieving net zero emissions in the United States (see
figure 7-3). While reducing deforestation and other actions outside the
energy sector are also critical to slowing climate change, the production
and consumption of energy are responsible for about three-quarters of U.S.
emissions (Ge, Friedrich, and Vigna 2020; Climate Watch 2021).
      Successfully transitioning the U.S. economy to clean energy neces-
sitates a large shift in economic activity. Americans spend over $1 trillion
annually on energy, or about 5 to 10 percent of U.S. GDP in recent decades
(U.S. Energy Information Administration 2018). Natural gas- and coal-fired
power plants produce the majority of U.S. electricity, while petroleum
products are the dominant fuel to transport people and products. Houses and
buildings are often heated with furnaces and boilers that burn natural gas and
oil, and the products Americans buy, the food we eat, and the sidewalks we
walk on have carbon embedded in their production processes (White House
2021a). In 2019, 83 percent of the country’s energy demand was satisfied
by coal, oil, and natural gas, down from about 87 percent in 2000 (Ritchie
and Roser 2020).
      Meeting domestic and global climate targets means substantially
stepping up the pace of clean energy deployments over the next decades,

                                          Accelerating and Smoothing the Clean Energy Transition | 225
Figure 7-3. Representative Pathway to Meet Net Zero Emissions in the
United States, 2005–50
Reductions in net emissions (gigatons of CO2-equivalent per year)
7
6
5
4
3
2
1
Energy transition
0
Total Energy Decarbonizing Transition to Non-CO₂ Land sink CO₂ CO₂ removal
efficiency electricity low-carbon fuels reductions removal technologies
Source: U.S. Long-Term Climate Strategy.
Note: CO₂ = carbon dioxide.
as shown by a recent IEA analysis that details a pathway to net zero emis-
sions by 2050 (see table 7-1) (Bouckaert et al. 2021). Though the world is
not decarbonizing at the pace of this IEA scenario, recent trends and expert
forecasts do tell a story of an explosive growth of clean energy technologies.
In the United States, wind turbine technicians and solar energy installers
are two of the five fastest-growing occupations, and over 80 percent of new
electricity generation capacity built here in the first three quarters of 2021
was wind or solar (U.S. Bureau of Labor Statistics 2021a; Shahan 2021).
Although many details about the energy transition are impossible to
know in advance, the road map to meeting the energy demands of a grow-
ing economy with clean energy has become much clearer in recent years.
Dozens of “deep decarbonization” studies point to a similar recipe: produce
electricity with carbon-free sources and shift energy uses to this carbon-free
electricity and other low-carbon fuels (National Academies 2021).
A rapid energy transition will not occur without the implementation of
a host of policy measures. If market prices fail to account for the damage
caused by emissions, then consumers and producers will continue buying
and selling too many artificially inexpensive, carbon-intensive goods and
services. Carefully designed policies can change this behavior by raising the
relative price of carbon-intensive goods and services compared with cleaner
alternatives, which provides a financial incentive to shift away from the
carbon-intensive products (Serrano and Feldman 2012).
Such carbon prices could be implemented directly via carbon taxes,
indirectly through a cap on emissions and tradable permits, or through other
similar policy tools. Government revenues from the carbon price can be used
226 | Chapter 7Table 7-1. Global Clean Energy Deployments in 2020 and 2030 Consistent with Net Zero
Emissions by 2050
Type of Clean Energy 2020 2030
Global wind installations 114 GW per year 390 GW per year
Global solar energy installations 134 GW per year 630 GW per year
Electric vehicles 5% of global car sales 60% of global car sales
Heat pump installations 180 million per year 600 million per year
Captured carbon 40 mt per year 1670 mt per year
Source: Bouckaert et al. (2021, tables 2.5, 2.6, 2.9).
Note: GW = gigawatts; mt = metric tons.
to compensate consumers for increases in energy prices or to invest in other
societal priorities.
Carbon prices of some form exist at the national level in 45 countries,
including those that have been successful at sustaining emissions reductions,
such as the United Kingdom (see box 7-1) (World Bank 2021). Canada’s
federal carbon price is scheduled to increase from 50 Canadian dollars per
metric ton of CO2 in 2022 to 170 dollars in 2030 (Government of Canada
2021). However, many countries have failed to implement carbon prices at
the scale and scope needed to achieve large emissions cuts (OECD 2021).
In the United States, Federal-level carbon pricing proposals have stalled in
Congress for over 30 years, including legislation that passed in the House
of Representatives in 2009 but failed in the Senate (Center for Climate and
Energy Solutions 2021).
Even in the absence of these political challenges, carbon prices are
just one of many policy measures needed to cost-effectively accelerate the
energy transition. After all, in addition to the failure of market prices to
account for the damages caused by emissions, various other barriers stand
in the way of a rapid, equitable, and low-cost transition. Complementary
policies can make it cheaper or easier to conserve energy or to shift away
from carbon-intensive products.
Policy measures are needed for situations in which consumers can-
not or do not fully respond to price signals; for example, tenants are often
responsible for paying utility bills but have no control over what landlords
could do to effectively reduce energy consumption (Ryan et al. 2011). Well-
designed incentives and standards can encourage broader use of energy-
efficient products and other energy-conserving actions.
Measures that foster innovation are also necessary to reduce the costs
of the clean energy transition. Private firms are likely to underinvest in
technological progress because the benefits of their investments in emerging
technologies partially accrue to society writ large. In addition, new products
struggle to compete on a level playing field with established products due to
Accelerating and Smoothing the Clean Energy Transition | 227Box 7-1. The United Kingdom’s Emissions Have
Fallen Rapidly While Its Economy Has Grown
The United Kingdom passed a major climate change law in 2008 and
implemented a combination of emissions pricing, regulations, subsidies,
and spending on clean energy (London School of Economics 2020). Its
emissions fell by about 20 percent between 2009 and 2019, as shown in
figure 7-i; the trends shown are not due to swapping domestic production
of carbon-intensive products for imports (i.e., “offshoring” emissions); in
fact, between 2009 and 2019, emissions from imported goods decreased
by more than emissions from exported goods (Ritchie and Roser 2020).
Figure 7-i. Changes in U.K. Greenhouse Gas Emissions and
Real GDP since 1990
Percent change since 1990
80
Change in real GDP
60
40
20
0
–20
–40 Change in emissions
–60
1990 1992 1994 1996 1998 2000 2002 2004 2006 2008 2010 2012 2014 2016 2018
Sources: Climate Watch; U.K. Office for National Statistics; CEA calculations.
Note: Real GDP is reported in chained 2019 pounds. Greenhouse gases are reported in megatons and use production-
based accounting
a host of competitive disadvantages, which include access to capital and the
difficulty of acquiring the talent, materials, and customer bases necessary to
scale up production. Well-designed policies can help encourage investments
at all stages of the innovation process, from research to demonstration proj-
ects to initial commercialization (Gundlach, Minsk, and Kaufman 2019).
Finally, even with these policies in place, the widespread adoption of
cost-effective clean energy solutions requires building the necessary public
infrastructure and regulatory structures that enable them to compete with
more established products. For example, regulators can require financial
institutions to assess climate risks in their investments, and Federal agen-
cies can set guidelines to ensure that emerging technologies, such as carbon
capture and storage, are deployed effectively and equitably (White House
2021b; Council on Environmental Quality 2021).
228 | Chapter 7More broadly, policies that accelerate the transition can be designed
to prioritize equity. Currently, lower-income households are often dispro-
portionately harmed by higher energy bills. Further, energy infrastructure
investments have historically led to environmental degradation in marginal-
ized communities. Policies can be designed to lessen rather than exacerbate
these equity concerns; for example, the Biden Administration has committed
to devoting a substantial portion of Federal investments in clean energy
development to disadvantaged communities through the Justice40 Initiative
(White House 2021c). In many places that have implemented carbon prices
(e.g., Canada’s federal carbon pollution pricing system), the revenues are
returned to lower-income households so that they receive more in gov-
ernment payments than they pay in higher prices of goods and services
(Government of Canada 2022).
A Smooth Transition to Clean Energy
The need to shift to clean energy is paramount to lessen the severe threats of
climate change. However, an equitable transition to a clean energy economy
requires more than efforts to reduce emissions. This section highlights the
need for public policies that support certain domestic industries and vulner-
able communities in response to two key challenges posed by the energy
transition.
First, domestic clean energy industries will become increasingly
important for the Nation’s security and global economic position. Currently,
the United States’ energy industry is carbon-intensive and a source of eco-
nomic productivity and stability (U.S. Environmental Protection Agency
2021). For example, our domestic production of natural gas helps to keep
costs low for American consumers and firms (U.S. Energy Information
Administration 2021b). However, as the global energy transition progresses,
the innovation and production of clean technologies will grow in impor-
tance. Fortunately, the United States has the needed resources, institutions,
and workforce to support globally competitive clean industries. However,
other nations are rapidly ramping up investments in clean energy and sup-
port for their domestic industries. Without strong and sustained Federal
Government support, U.S. firms that can supply a clean economy are likely
to struggle to compete in global markets.
The second portion of this section describes the challenges the energy
transition poses to communities across the United States where jobs,
income, and tax revenues depend on carbon-intensive industries, such as the
production of fossil fuels or downstream products like automobiles. Fossil
fuel-dependent communities across the country are already facing economic
challenges, and the energy transition poses additional risks to communi-
ties that are not well prepared and supported (Interagency Working Group
Accelerating and Smoothing the Clean Energy Transition | 2292021). In the past, workers and their families largely have not moved to
find jobs when faced with the loss of major employers in their communi-
ties. Strategies to support these groups of Americans through the energy
transition therefore require policies that target fossil fuel-dependent local
economies.
Although economists largely agree on the policy recipe for accelerating
the energy transition, no similar playbook exists on how to smooth the tran-
sition for U.S. firms and communities. In fact, economists have long pointed
to the risks of government interventions that advantage certain industries or
geographic regions over others. However, the economic literature highlights
ways to minimize policy risks and capitalize on the economic opportunities
of creating global-leading firms and revitalizing local economies.
The First Challenge: Supporting Domestic Industries
This subsection describes the need for policy measures that support domestic
clean industries, and the opportunities and risks of government interventions
that can enable U.S. firms to compete in global markets that are growing
rapidly during this energy transition.
The domestic energy sector is important to the U.S. economy. Energy
production is an important component of U.S. economic strength and
stability. The United States is the world’s largest producer of petroleum
and natural gas, surpassing Saudi Arabia in petroleum production in 2018
and Russia in natural gas production in 2011 (U.S. Energy Information
Administration 2019). Despite being the world’s largest consumer of oil and
natural gas, American producers are also now large exporters of these fuels
(U.S. Energy Information Administration 2021c). Net imports of petroleum
products (about three-fourths of which come from crude oil) fell from about
10 million barrels a day in 2000 (roughly half of U.S. consumption) to below
zero by 2019; meanwhile, net imports of natural gas fell from about 4 tril-
lion cubic feet in 2000 to about -2 trillion cubic feet in 2019 (U.S. Energy
Information Administration 2021b, 2021c).
The United States is also the world’s largest exporter of refined
petroleum products and liquefied national gas (Observatory of Economic
Complexity; U.S. Energy Information Administration 2021d). The value of
fuel exports as a fraction of the total value of merchandise exports increased
from about 2 percent in 2000 to 13 percent in 2020, indicating that fuel
exports alone account for about 1 percent of U.S. GDP (World Bank 2020)
(figure 7-4).
In addition to fossil fuels, American firms are large producers and
exporters of many other energy- and carbon-intensive products, including
chemicals and steel (DeCarlo 2017; U.S. International Trade Administration
2020; IEA 2022a). The carbon-intensive auto industry makes up 3 percent
230 | Chapter 7Figure 7-4. U.S. Fossil Fuel Consumption for Selected Years
Trillions of barrels per day Trillions of cubic feet
25
A B 40
20 35
30
15
25
20
10
15
5 10
5
0
0
-5 -5
1950
1953
1956
1959
1962
1965
1968
1971
1974
1977
1980
1983
1986
1989
1992
1995
1998
2001
2004
2007
2010
2013
2016
2019
1950
1953
1956
1959
1962
1965
1968
1971
1974
1977
1980
1983
1986
1989
1992
1995
1998
2001
2004
2007
2010
2013
2016
2019
Consumption Production Imports Exports Net imports Production Consumption Net imports
Percent
16
C 14
12
10
8
6
4
2
0
1960
1963
1966
1969
1972
1975
1978
1981
1984
1987
1990
1993
1996
1999
2002
2005
2008
2011
2014
2017
2020
Sources: U.S. Energy Information Administration; World Bank.
Note: Figure panels, from left to right: A, U.S. petroleum consumption, production, imports, exports, and net imports, 1950–2020; B, U.S. natural
gas consumption, dry production, and net imports, 1950–2020; C, U.S. fuel exports as a share of merchandise exports, 1960–present.
of GDP, more than any other manufacturing sector (American Automotive
Policy Council 2020).
Despite the harmful effects of the United States’ reliance on fossil
fuels, the reality is that we currently benefit in certain ways from our domes-
tic energy production. In the winter of 2021–22, Europe was immersed in
an energy crisis, including historically high natural gas prices caused by a
series of shocks that led to increased demand and constrained supply, due
in part to the continent’s dependence on natural gas from Russia (Cohen
2021; Stapczynski 2021; Sabadus 2021). The United States is somewhat
insulated from turmoil in natural gas markets abroad due to our domestic
production and the lack of a fully integrated global market—natural gas
prices in Europe rose to over 10 times higher than prices in the United States
in December 2021 (Reed 2021).
In contrast, the global oil market is highly integrated, with a group of
countries that essentially set prices (Fattouh 2007) and a mixture of state-
owned and private producers with widely varying costs of production (Wall
Street Journal 2016). American consumers of oil are therefore vulnerable to
geopolitical turmoil and the decisions of policymakers in petrostates. The
uninterrupted availability of affordable energy is a national security concern
for the United States (IEA 2022b). Ensuring the security of our energy
supply will require policy measures that diversify our energy sources and
supply chains, and that build resilience into the energy system as a buffer
against future shocks (Yergin 2006).
The energy transition is an economic opportunity, but policies
are needed to help build strong domestic clean industries. American oil
Accelerating and Smoothing the Clean Energy Transition | 231Box 7-2. The History of U.S. Government Support
for Domestic Carbon-Intensive Energy Industries
As industry and consumers ramped up their use of fossil fuels in the early
20th century, experts became concerned that the country would run out
of oil unless new oil fields were found and brought online (Olien and
Olien 1993). In 1913, the Federal Government added the intangible drill-
ing oil and gas deduction into the tax code, which allowed companies to
deduct from their taxes most of the costs of drilling new wells, reducing
the high up-front expenses that could discourage exploration (Center for
a Responsible Federal Budget 2013). This deduction remains in place
today; at $2.3 billion a year, it is the single largest production tax benefit
for the fossil fuel industry (Roberts 2018).
The U.S. government has periodically intervened in markets to
ensure stable prices in the face of turmoil. For example, in 1930 in
East Texas, an enormous new oil field known as the “Black Giant” was
discovered by the oilman Dad Joiner (Loeterman 1992). Thousands of
independent producers (known as wildcatters) flocked to the area, flood-
ing the market with supply and driving the price of oil down to as low as
$0.02 a barrel, well below the cost of production. Faced with a possible
collapse of the oil industry, the Governors of Texas and Oklahoma
declared martial law in 1931, halting production and stabilizing the price
(Goodwyn 1996). President Franklin D. Roosevelt’s Secretary of the
Interior, Harold Ickes, led an effort to work out quotas and regulations
with producers in the area. Three decades later, the founders of OPEC
would look to that system as their model (Loeterman 1992). In 1959,
President Dwight D. Eisenhower imposed a quota system restricting
oil imports that would remain in place until 1973 (Council on Foreign
Relations 2021).
The U.S. government has also intervened to help American
companies access energy sources around the world. For example, in the
1940s and 1950s, the U.S. Department of State worked with U.S. oil
companies to negotiate profit-sharing agreements with oil-producing
nations, including Venezuela and Saudi Arabia, to be as favorable as
was feasible to U.S. companies (Council on Foreign Relations 2021).
In a 1950 agreement with Saudi Arabia, negotiators cut a deal in which
oil companies increased the taxes they paid to Saudi Arabia while
reducing the taxes they paid in the United States (Ross 1950). This
agreement allowed money to flow to Saudi Arabia outside the formal
Congressional approval process. When the Mossadeq government in Iran
nationalized the Anglo-Iranian Oil Company, the U.S. and U.K. govern-
ments launched Operation Ajax, which helped overthrow Mossadeq in
1953 (Allen-Ebrahimian 2017). In the aftermath, the five major U.S.
oil companies, along with British and French companies, were given
access to Iranian oil fields as part of the Iranian Consortium Agreement
232 | Chapter 7of 1954; the companies were also given control over production levels
(Heiss 1994).
Government support comes in the form of boosting energy infra-
structure and supply chains as well. A notable example is the Federal
Highway Act of 1956, which built the networks necessary for fossil
fuels to dominate personal and freight transportation in the United States,
while potentially crowding out lower-carbon alternatives such as rail.
producers are also vulnerable to decisions made in petrostates. Though
the United States is currently the world’s largest oil producer, if the world
moves to rapidly limit carbon and therefore reduce oil demand, state-owned
oil producers in countries like Saudi Arabia may increasingly find it in their
interest to maintain their production levels by setting prices closer to produc-
tion costs than they are now, at the expense of higher-cost producers that
include U.S. firms (U.S. Energy Information Administration 2021f). This
means that while global oil demand may decrease only gradually in the com-
ing decades, the effect on the U.S. oil industry may be more abrupt. Indeed,
two recent projections show the oil market shares of the members of the
Organization of the Petroleum Exporting Countries (OPEC) increasing from
roughly one-third in 2021 to about one-half or two-thirds by 2050 in a net
zero scenario (Bouckert et al. 2021; Mercure, Salas, and Vercoulen 2021).
At the same time, the rapid growth of the demand for carbon-free
products globally creates massive—but possibly fleeting—opportunities for
U.S. firms. A key question is how the economic productivity and energy
security of the United States will be affected as countries transition to clean
energy. Will U.S. firms be able to compete in emerging global carbon-free
industries? If not, the energy transition could lead to our reliance on imports
of the batteries, heat pumps, low-carbon steel, and other critical inputs to a
clean energy economy.
Consider the transition from internal combustion engine (ICE) vehicles
to electric vehicles (EVs). Cars are a major source of greenhouse gas emis-
sions, and President Biden has announced a goal to increase the share of new
passenger vehicle sales that are EVs and other zero emissions vehicles from
2.4 percent in 2020 to 50 percent in 2030 (Bui, Slowik, and Lutsey 2021).
There are nearly 1 million workers in the U.S. automotive industry, and over
3 million in the car dealer industry (U.S. Bureau of Labor Statistics 2021b).
The motor vehicle and parts industry has an annual output of over $500 bil-
lion (U.S. Bureau of Economic Analysis 2022). Reducing harmful emissions
from vehicles will entail the reduction in output and employment related
to ICE vehicles, but enormous growth in EVs—the value of the global EV
Accelerating and Smoothing the Clean Energy Transition | 233market is expected to grow from $163 billion in 2020 to over $800 billion by
2030, according to one expert’s forecast (Jadhav and Mutreja 2020).
Over the past century, the combination of automaker innovations,
workers’ unions, and labor laws have made ICE vehicles a staple of middle-
class families—and in the process creating good jobs, new methods of pro-
duction, and a strong domestic automobile industry. The United States has
the resources and capital required to rapidly scale up a domestic EV industry
that can satisfy the growing and changing nature of transportation needs.
But this will not occur at a pace consistent with our climate goals without a
policy strategy that encourages the redirection of capital and workers across
the auto industry supply chain.
More broadly, the United States is well positioned to incubate leading-
edge clean energy firms (Rodrik 2014; Cleary et al. 2018)—with a highly
educated population (National Center for Education Statistics 2021) and
institutions that have enabled global leaders in Silicon Valley, biotech, phar-
maceuticals, and other industries. Further, a unique endowment of natural
resources makes certain United States’ geographic regions ideally suited to
become hubs of carbon-free energy production (National Academies 2021).
However, U.S. firms will require support to compete in emerging
global markets for clean products. The inability to capture the full societal
benefits of innovation has led to insufficient private sector investments in
emerging clean technologies, inhibiting the expansion of clean industries
(Council of Economic Advisers 2021). For example, a first-of-its-kind
demonstration facility for low-carbon cement production may provide large
societal benefits but also have a cost and risk profile that the private sector
is unwilling to take on without government support.
Even after a new technology has been successfully developed and
demonstrated, its producers often face additional barriers competing with
more established technologies. Established firms receive a range of ben-
efits from the existence of a mature industry with extensive supply chains,
agglomeration effects (i.e., interactions between innovation and production),
and networks of consumers, whereas chicken-and-egg problems hinder
emerging technologies. For example, the uptake of EVs is slowed by a lack
of a nationwide charging network, and a nationwide charging network has
not been built because there are not enough EVs on the roads (Wei et al.
2021).
The robust industrial policy strategies of other countries can also be
an obstacle to emerging clean industries in the United States. In an efficient
global market, each country would provide its domestic firms with only the
support required to overcome the types of hurdles described above, which
should enable the most productive firms worldwide to become market
leaders. In reality, if the U.S. government fails to provide domestic firms
with sufficient support, or if other governments overcompensate their own
234 | Chapter 7Figure 7-5. The United States’ and China’s Percentages of the
Market across Clean Technology Industries
Percent China United States
90
80
70
60
50
40
30
20
10
0
Solar module Battery cell Battery cathode Passenger Wind turbine Lithium mining Lithium refining
manufacturing manufacturing manufacturing electric vehicle manufacturing capacity
(crystalline sales
silicon)
Source: BloombergNEFѵ
domestic firms, American firms may not be able to compete in global mar-
kets, regardless of their potential competitive advantages.
The Chinese government has made a concerted and successful effort
to build domestic industries that can supply a global clean energy economy
(Liu and Urpelainen 2021). Therefore, Chinese firms dominate clean energy
manufacturing worldwide. Chinese companies produce about 60 percent of
the world’s wind turbines and about 80 percent of its solar module cells (see
figure 7-5).
In addition, China now produces over 80 percent of the world’s bat-
tery cells used to power EVs. Ceding such industries to China is not only a
lost opportunity for U.S. firms but also a risk to U.S. consumers, given the
potential for the monopolization of important supply chains (see also chapter
6). Building a domestic battery industry—as well as other components of the
EV supply chain, such as key critical minerals—that can compete with firms
in China and other countries is a key challenge for the U.S. economy over
the next decade—and a major economic opportunity, given the growing
global demand for EVs.
China and Russia are also making large bets on nuclear energy,
another source of clean energy with the potential to grow rapidly in a global
energy transition (Berthélemy and Cameron 2021). A recent study by the
International Atomic Energy Agency projects nuclear energy capacity
could grow between 17 and 94 percent worldwide by 2030 (IAEA 2013).
In contrast, the growth of nuclear energy has stalled in the United States
due to concerns related to costs, safety, and waste, although the Bipartisan
Infrastructure Law and other Biden-Harris Administration proposals include
substantial incentives to support the domestic nuclear energy industry
Accelerating and Smoothing the Clean Energy Transition | 235(Bordoff 2022; U.S. Energy Information Administration 2021g). Ceding the
global-leading positions in the nuclear industry to China and Russia, whose
companies are now supplying reactor technologies to other parts of the
world, would forgo not only economic opportunities for U.S. firms but also
the potential for the U.S. government to influence nonproliferation efforts in
other countries with nuclear energy facilities (Bordoff 2022).
Our allies are developing industrial policy strategies as well. For
example, the European Union is the world’s leader in subsidizing renew-
able electricity generation (Taylor 2020), and it recently introduced a new
strategy to support domestic industries with increased access to financing,
reduced regulatory burdens, and capacity building for the transition to
sustainability and digitization (European Commission 2020). The EU has
also provided substantial support to key emerging technologies such as
batteries and clean hydrogen, positioning European clean energy firms to
be the global leaders in potentially game-changing technologies (European
Commission 2021b, 2022).
Strategies for Supporting Domestic Industries
through the Energy Transition
The world’s most advanced economies, including the United States, have
implemented policy measures with the aim of industrial development
(Goodman 2020). For over a century, U.S. policymakers have provided
support to the fossil fuel industry, recognizing that a strong domestic energy
industry is important for economic competitiveness and national security
(Johnson 2011). Yet government interventions are not without risk; after all,
market forces can improve the economic efficiency of decisions. The chal-
lenge for policymakers, then, is to design a fulsome strategy that maximizes
the economic opportunities of the clean energy transition while minimizing
the risks.
Although there is no established playbook for green industrial policy,
economists have offered numerous general principles (Vogel 2021; Rodrik
2014; Mazzucato, Kattel, and Ryan-Collins 2019). First, the government
should provide domestic industries with transparent, high-level goals.
National governments can launch national missions to confront the largest
challenges facing societies, including climate change (Mazzucato, Kattel,
and Ryan-Collins 2019). For example, during the Space Race of the 1960s,
funding for the U.S. National Aeronautics and Space Administration reached
nearly 4.5 percent of Federal spending, which fueled domestic industries
like computer chip production and spawned a new generation of engineers
and scientists (Chatzky, Siripurapu, and Markovich 2021). In contrast to
high-level missions, supporting specific companies or technologies over
236 | Chapter 7others comes with demanding informational requirements on policymakers,
and government actors do not have complete information on the potential
benefits, costs, and risks of each investment (Schultze 1983). Instead,
the government may (at least partially) let political considerations influ-
ence investment decisions, which raises the odds of wasteful government
spending.
Another recommendation is that government should focus support on
technologies that are not fully mature—from research and development to
demonstration projects to initial commercialization. Without government
support, firms that produce emerging technologies often cannot compete
with firms that produce mature technologies. Many of the largest industrial
policy success stories have come from investing in innovative technologies
that exhibit a wide range of potential (and often unforeseen) applications
(Goodman 2020). In contrast, subsidies for fully mature technologies can
cause long-term declines in allocative efficiency, largely by untethering
prices and output allocations from underlying economic conditions (Kim,
Lee, and Shin 2021). Importantly, it may not be possible or desirable to
avoid supporting specific emerging clean energy technologies, despite the
associated challenges noted above.
Governments need to balance the potentially conflicting needs to fos-
ter collaborations with industry while avoiding its undue influence on the
policy process. Successful public policies often require considerable inter-
action between government officials and industry stakeholders, so that the
government officials understand the businesses and technologies on which
public policies focus (Rodrik 2014). Such interactions naturally heighten the
concerns of political capture—whereby government officials put their own
interests and the interests of industry stakeholders who lobby them above
the interests of their constituents—because policy decisions are made by
political actors (Gregg 2020). Indeed, whenever subsidies and tariffs are on
the table, moneyed interests will lobby for the adoption and retention of their
preferred policies, making these policies difficult to eliminate when they
become unnecessary or counterproductive. For example, fossil fuel subsi-
dies were first paid in the 1910s, and agriculture subsidies were first paid
in the 1930s (Center for a Responsible Federal Budget 2013; Comparative
Food Politics n.d.); in both cases, the subsidies have lasted to the present day
due in large part to interests that benefit from them. Approaches to balance
the needs to collaborate with industry, while avoiding their undue influence,
include government institutions with some degree of independence from the
political process and restrictions on a revolving door between government
service and industry.
Another way to maximize the effectiveness of government interven-
tions is to make the regulatory environment as certain as possible. Ensuring
that the parameters and duration of government support are clear and
Accelerating and Smoothing the Clean Energy Transition | 237concrete will give firms confidence about future technological and market
opportunities, catalyzing investment and innovation that would not other-
wise occur. In contrast, uncertain regulatory environments are not conducive
to attracting private sector investments. For example, the periodic expiration
(or near-expiration) of the production tax credit for renewables in the United
States has inhibited investments in wind and other clean energy technologies
and thus has inhibited the growth of these emerging industries (Sivaram and
Kaufman 2019).
Finally, just as an investor may be wise to consider a diversified
portfolio rather than a concentrated set of individual stocks, the government
should invest in a broad portfolio of clean energy solutions (Rodrik 2014).
An important role of government is to take on risks that the private sector
will not bear; a diverse portfolio accommodates such risks, even in the pres-
ence of the inevitable failed investments. For example, the Department of
Energy’s Loan Programs Office was established to provide financing for
innovative energy projects in the United States, including access to debt
capital that private lenders cannot or will not provide (U.S. Department of
Energy, Loan Programs Office 2017). The program has funded a few com-
panies that went bankrupt—most notably the solar producer Solyndra—but
those bankruptcies have not prevented the formation of a highly successful
overall portfolio of investments (Rodrik 2014). The program has propelled
the growth of game-changing companies, including Tesla (U.S. Department
of Energy, Loan Programs Office 2017). The Federal Government should
be willing to lose money to achieve such benefits; but instead, the monetary
losses from the Loan Program have been less than one-third of the interest
paid to the government on the loans to date (U.S. Department of Energy,
Loan Programs Office 2021).
Following this playbook, President Biden has announced a goal for 50
percent of passenger vehicle sales by 2030 to be EVs, along with helping
to build a domestic supply chain to support EV production (White House
2021d). Moreover, the Federal Government is investing in the infrastructure
needed to entice consumers to purchase EVs; there are currently only about
5,000 of the fastest EV chargers in the United States for public use, and these
chargers are clustered in a few regions, including in the Northeast and on
the West Coast. The 2021 Bipartisan Infrastructure Law is investing billions
of dollars in building a domestic supply chain for batteries and nationwide
network of EV charging stations (White House 2021d, White House 2021e).
Previous attempts to support domestic industries in global markets
have mixed track records (see box 7-3). Many failed investments might
have been avoided with better processes for strategically targeting industrial
policy opportunities. Perhaps more important than avoiding failed invest-
ments is creating the conditions where failures are expected and accepted as
a learning experience, including with data collection, information sharing,
238 | Chapter 7Box 7-3. Industrial Policy Successes and Failures
Governments worldwide have had many successes and failures support-
ing domestic industries. Perhaps the most prominent examples are in
the context of economic development. South Korea is an often-lauded
success story, due to its subsidies for a targeted set of industries that
helped build a series of large, family run business conglomerates called
the Chaebol, including well-known brands like Hyundai and Samsung
(Albert 2018; Westphal 1990). One study found that targeted industries
grew more than 80 percent more than nontargeted ones from 1973 to
2017 (Lane 2017). In contrast, several industrial policy pushes in Sub-
Saharan Africa, North Africa, and the Middle East have been largely
unsuccessful, with corruption, existing distortions, and weak govern-
ment capacity limiting their effectiveness (Devarajan 2016). Even in
cases where industrial policy has been successful in the development
context, such as Japan, it is difficult to disentangle industry support from
other factors that influence economic growth, such as favorable domestic
economic conditions or high savings rates (Goodman 2020).
The anecdotal evidence of developed countries supporting domes-
tic producers in emerging high growth industries offers notable successes
and failures. Denmark has successfully leveraged a national strategy to
build world-leading capabilities in offshore wind energy, while the bil-
lions of dollars spent by France, Germany, and the European Union in
the early 2000s to fund search engines that could compete with Google
were unsuccessful (Lewis 2021; Goodman 2020).
Efforts by the U.S. government to support domestic industry
have similarly produced mixed results. Some of the largest anecdotal
successes of government interventions have come in the face of threats,
like the Space Race or the War Production Board during World War II
(Chatzky, Siripurapu, and Markovich 2021). Facing intense competition
from Japan in the 1980s, subsidization of the semiconductor industry
created a globally competitive industry by the 1990s (Hof 2011). In
contrast, the United States has provided strong support to the domestic
shipping industry for a century—yet U.S. ships still cannot compete
on cost with foreign vessels, in part due to poor labor standards in
the industry abroad (which is also a highly relevant concern for clean
energy production abroad) (Frittelli 2003, 2019; Ha et al. 2020; Kaplan,
Buckley, and Plumer 2021).
and impact evaluations. This will enable policymakers to experiment with
policy design, figure out what works, and take sufficient risks to reap the
rewards of economy-boosting investments.
Accelerating and Smoothing the Clean Energy Transition | 239The Second Challenge: Supporting Communities
That Rely on a Carbon-Intensive Economy
The geographic concentration of many of the industries most affected by the
energy transition, including fossil fuel extraction and the manufacturing of
high-carbon products, implies disproportionate risks for the regions of the
country that rely on these industries for jobs and tax revenue, and important
opportunities for public policies to mitigate these risks and invest in the
residents of these same regions.
There is considerable overlap between the dual challenges of smooth-
ing the energy transition for domestic economic sectors and for local com-
munities. After all, clean energy-related investments in fossil fuel-dependent
local economies can serve to boost both the industries and places most
affected by the energy transition.
However, these two challenges also differ in marked ways. As
described above, supporting domestic industries most effectively entails
a national strategy that will lead to investments across the entire country,
including but not limited to local economies that currently depend on fossil
fuels. Similarly, effectively supporting fossil fuel-dependent communities
will involve a commitment to these local economies with measures that are
not limited to clean energy investments.
The remainder of this section describes the rationale for government
interventions to support fossil fuel-dependent communities and the lessons
learned from prior experience with place-based policies.
The Geographic Concentration of Fossil-Fuel-Dependent Communities
As a case study, consider the automobile industry’s shift away from ICE
vehicles. Certain industry jobs, including vehicle assembly and sales, may
translate to jobs on the EV line relatively seamlessly. However, many of
the jobs specific to ICE components and supply chains will decline. For
example, the ICE and EV powertrains—the system by which the engine and
motor deliver power to the wheels—require different parts. Of the 140,000
workers in the U.S. powertrain sector, 70 percent are mostly concentrated
in small communities in Michigan, Ohio, and Indiana. In Monroe County,
Michigan, more than one-quarter of employment relates to ICE vehicle
powertrains (Raimi et al. 2021).
The risks of the energy transition may be even more acute for commu-
nities dependent on the extraction and combustion of fossil fuels. The U.S.
fossil fuel industry is highly geographically concentrated, as shown in figure
7-6. The coal extraction industry (panel A) is largely located in Appalachia
and portions of the Mountain West—about 90 percent of U.S. coal produc-
tion takes place in 50 counties (U.S. Energy Information Administration
240 | Chapter 7Figure 7-6. Fossil Fuel Employment by County
A B
Fraction of Fraction of
county WOfkforce counly WOf1d0tce
•0.10-026 ao.10-0.2•
...,
•0.05-0.10 ■0.05-0.10
o.o, -0.05 o.o, -o.05
0.00-0.01 0.00-0.01
No data No data
C
•
...... Fraction of
1/�
county wOfkforee
ao.,o-o:ia
■0.05-0.10
o.o, -0.05
0.00-0.01
No date
Sources: Quarterly Census of Employment and Wages; Bureau of Labor Statistics (BLS); CEA calculations.
Note: Figure panels, from left to right: A, coal mining; B, oil and gas extraction; C, support services for the mining and quarrying of minerals and for the
extraction of oil and gas. Industries are defined by NAICS codes 211 (oil and gas extraction), 2121 (coal mirung), and 213 (support activities for mining and
oiVgas extraction). Each panel displays the fraction of the county's workforce in the NAICS industry. Cells with small employment are suppressed by the BLS.
2021h). In some counties, fossil fuel employment is as high as 30 to 50
percent of all employment (panels A, B, and C); these figures are higher
when including jobs directly supported by the region’s dominant industry,
such as in the service sector, supply chain, and local government (Tomer,
Kane, and George 2021).
Employment and economic activity associated with fossil fuel produc-
tion is already declining in many regions of the country. Coal-mining jobs
have decreased by about three-quarters since 1980, and employment in
the oil and gas sector has declined by about 30 percent in the last decade
(Interagency Working Group 2021; Federal Reserve Bank of Saint Louis
2022). The underlying reasons are myriad: automation; cheap natural gas
causing a shift away from coal-fired electricity; lower prices of renewable
energy; resource decisions that account for the damage caused by climate
change and air pollution; volatility in oil markets; and weak international
demand, which may continue to fall as countries seek to meet their Paris
Agreement commitments (Look et al. 2021; Bowen et al. 2018).
Fossil fuel-dependent communities that are unprepared for the energy
transition risk further reductions in employment and economic activity
(Larson et al. 2020). These areas are often rural, undiversified, and have pre-
existing economic challenges—poverty rates are higher in fossil fuel-reliant
communities than in neighboring counties and the Nation as a whole, as are
mortality rates due to such issues as opioid abuse and black lung disease
(Interagency Working Group 2021; Bowen et al. 2018; Metcalf and Wang
2019; National Institute for Occupational Safety and Health 2018). Large
Accelerating and Smoothing the Clean Energy Transition | 241populations in coal communities depend on pensions and other benefit funds
with questionable solvency (Randles 2019).
More broadly, rural locations often lack both the basic infrastructure
(e.g., roads and broadband Internet) and the financial infrastructure (e.g.,
easily accessible credit) necessary to transition to new industries (Raimi et
al. 2021). Many rural locations also suffer from a dearth of opportunities,
with undiversified economies and workers that are specialized for the jobs
in the region. For instance, workers in Appalachia are 25 percent less likely
than the national average to have a college degree (Appalachian Regional
Commission 2022).
The loss of dominant employers can precipitate fiscal spirals from
which jurisdictions struggle to recover, as previously shown in the experi-
ences of steel towns in Pennsylvania, coal-producing regions of the United
Kingdom, and the automobile-dominated economy of Detroit, among oth-
ers. When major industrial firms depart, the supporting service sectors and
nearby supply chains shrivel in size. Reduced economic activity leads to
reduced government revenues from property and sales taxes, which often
results in cuts to government services. Combined with reduced employment
opportunities, these factors make it difficult for distressed communities to
attract new businesses and for dislocated workers to find new job opportuni-
ties (Morris, Kaufman, and Doshi 2021).
The Inadequacy of Place-Neutral Policies
The geographic concentration of the risks of the energy transition does
not, by itself, imply that government support should specifically target
these regions. Instead of targeting economically distressed regions, policies
could target struggling people, regardless of where they live. Indeed, many
government programs already support people in communities that face eco-
nomic shocks, even though they are often not targeted at specific communi-
ties. For example, Federal and State governments have implemented trade
adjustment assistance programs to directly compensate workers who lose
their jobs because of increased exposure to trade,1 and assistance programs
such as the Supplemental Nutrition Assistance Program (formerly known as
Food Stamps) and Medicaid help people during times of economic hardship
(Higdon and Robertson 2020).2
1
Multiple reports have found limited effectiveness of trade adjustment assistance (TAA) programs
at transitioning workers to new, higher-paying lines of work (Rodrik 2017; U.S. Government
Accountability Office 2012a, 2012b). While TAA has a large, positive causal effect on employment
and earnings, take-up of TAA is low, so some of the limited effectiveness of TAA may be explained
by how few people use it (Hyman 2018; Autor et al. 2014).
2
Social safety net programs may be especially important for aiding fossil-fuel-reliant communities,
given preexisting economic challenges and the growing concerns about the solvency of industry-
funded pension programs (Higdon and Robertson 2020; Walsh 2019).
242 | Chapter 7You can also read