Vegetation change across the Drake Passage region linked to late Eocene cooling and glacial disturbance after the Eocene-Oligocene transition
←
→
Page content transcription
If your browser does not render page correctly, please read the page content below
Clim. Past, 18, 209–232, 2022
https://doi.org/10.5194/cp-18-209-2022
© Author(s) 2022. This work is distributed under
the Creative Commons Attribution 4.0 License.

Vegetation change across the Drake Passage region linked to
late Eocene cooling and glacial disturbance after the
Eocene–Oligocene transition
Nick Thompson1 , Ulrich Salzmann1 , Adrián López-Quirós2,3 , Peter K. Bijl4 , Frida S. Hoem4 , Johan Etourneau3 ,
Marie-Alexandrine Sicre5 , Sabine Roignant6 , Emma Hocking1 , Michael Amoo1 , and Carlota Escutia3
1 Department   of Geography and Environmental Sciences, Northumbria University, Newcastle upon Tyne, UK
2 Department   of Geoscience, Aarhus University, Høegh-Guldbergs Gade 2, 8000, Aarhus C, Denmark
3 Instituto Andaluz de Ciencias de la Tierra, CSIC-Universidad de Granada, Granada, Spain
4 Department of Earth Sciences, Utrecht University, Utrecht, the Netherlands
5 Sorbonne Université (UPMC, Univ. Paris 06)-CNRS-IRD-MNHN, LOCEAN Laboratory, Paris, France
6 Institut Universitaire Européen de la Mer, Plouzane, France

Correspondence: Nick Thompson (alasdair.thompson@northumbria.ac.uk)

Received: 7 July 2021 – Discussion started: 16 July 2021
Revised: 20 October 2021 – Accepted: 6 November 2021 – Published: 4 February 2022

Abstract. The role and climatic impact of the opening of           reflecting a change from temperate forests to cool temper-
the Drake Passage and how it affected both marine and              ate forests following 33.5 Ma. This surprising expansion of
terrestrial environments across the Eocene–Oligocene tran-         gymnosperms and cryptogams is suggested to be linked to
sition (EOT ∼ 34 Ma) period remains poorly understood.             environmental disturbance caused by repeat glacial expan-
Here we present new terrestrial palynomorph data compared          sion and retreat, which facilitated the proliferation of conifers
with recently compiled lipid biomarker (n-alkane) data from        and ferns. The timing of glacial onset at Site 696 is linked to
Ocean Drilling Program (ODP) Leg 113, Site 696, drilled            the global cooling at the EOT, yet the latest Eocene regional
on the margin of the South Orkney Microcontinent (SOM)             cooling cannot directly be linked to the observed vegetation
in the Weddell Sea, to investigate changes in terrestrial en-      changes. Therefore, our vegetation record provides further
vironments and palaeoclimate across the late Eocene and            evidence that the opening of the Drake Passage and Antarc-
early Oligocene (∼ 37.6–32.2 Ma). Early late Eocene floras         tic glaciation were not contemporaneous, although stepwise
and sporomorph-based climate estimates reveal Nothofagus-          cooling in response to the opening of ocean gateways sur-
dominated forests growing under wet temperate conditions,          rounding the Antarctic continent may have occurred prior to
with mean annual temperature (MAT) and precipitation               the EOT.
(MAP) around 12 ◦ C and 1802 mm respectively. A phase
of latest Eocene terrestrial cooling at 35.5 Ma reveals a de-
crease in MAT by around 1.4 ◦ C possibly linked to the open-       1   Introduction
ing of the Powell Basin. This is followed by an increase in
reworked Mesozoic sporomorphs together with sedimento-             The Cenozoic progression from greenhouse to icehouse cli-
logical evidence indicating ice expansion to coastal and shelf     mate conditions was accompanied by the establishment of
areas approximately 34.1 Myr ago. However, major changes           the Antarctic ice sheet around the Eocene–Oligocene tran-
to the terrestrial vegetation at Site 696 did not take place un-   sition (EOT 34.44–33.65 Ma; e.g. Hutchinson et al., 2021).
til the early Oligocene, where there is a distinct expansion of    This change in Earth climate state is evidenced by a promi-
gymnosperms and cryptogams accompanied by a rapid in-              nent excursion in oxygen isotope ratios from marine bio-
crease in taxon diversity and a shift in terrestrial biomarkers    genic calcite (e.g. Zachos et al., 2001, 2008; Westerhold et
                                                                   al., 2020) during the earliest Oligocene oxygen isotope step

Published by Copernicus Publications on behalf of the European Geosciences Union.
210                           N. Thompson et al.: Vegetation change across the Eocene–Oligocene Drake Passage region

(EOIS ∼ 33.65 Ma; Hutchinson et al., 2021). The possible            2.1     Lipid biomarkers (n-alkanes)
causes of the onset of Antarctic glaciation are poorly un-
                                                                    The distribution of n-alkanes in sediments can be assessed
derstood and ambiguity remains as to whether a single or
                                                                    on the basis of carbon chain length in order to determine
combination of factors and feedbacks drove the Cenozoic cli-
                                                                    potential biological sources (Cranwell, 1973; Rieley et al.,
mate transition (e.g. DeConto and Pollard, 2003; Coxall and
                                                                    1991; Bi et al., 2005; Duncan et al., 2019; López-Quirós et
Pearson, 2007). In particular, large uncertainties remain over
                                                                    al., 2021). Algae and bacteria typically produce shorter chain
the role of the opening and deepening of the Drake Passage
                                                                    lengths (C12 –C22 ; Clark and Blumer, 1967; Han and Calvin,
on the development of the Antarctic Circumpolar Current
                                                                    1969; Cranwell et al., 1987; Grimalt and Albaigés, 1987;
(ACC) and how this event affected both marine and terres-
                                                                    Duncan et al., 2019), while aquatic plants and Sphagnum
trial environments (Scher and Martin, 2008; Houben et al.,
                                                                    mosses are characterized by enhanced production of C23 to
2019; Lauretano et al., 2021). Today ocean currents and the
                                                                    C25 chain lengths (Baas et al., 2000; Ficken et al., 2000; Pan-
ACC exert a strong influence on the Earth’s climate system
                                                                    cost et al., 2002; Bingham et al., 2010; Duncan et al., 2019).
in the global distribution of heat, nutrients, salt, and carbon
                                                                    Long-chain n-alkanes (C25 and higher) are most abundantly
as well as in the gas exchange between the atmosphere and
                                                                    produced by terrestrial higher plants (Eglinton and Hamil-
the ocean (Cox, 1989; Bryden and Imawaki, 2001; Anderson
                                                                    ton, 1963; Duncan et al., 2019). Therefore, medium- to long-
et al., 2009; Sarkar et al., 2019). In particular the ACC facili-
                                                                    chain n-alkane (C23 –C31 ) distributions can provide details
tates the thermal isolation of Antarctica from subtropical sur-
                                                                    about the origin of organic matter in sediments, differenti-
face heat through the isopycnal tilt of its water masses, acting
                                                                    ating between terrigenous and marine and providing infor-
to stabilize the Antarctic ice sheet (Martinson, 2012; Sarkar
                                                                    mation about palaeovegetation and palaeoclimate (Meyers,
et al., 2019). Given that unabated anthropogenic warming is
                                                                    1997; Ficken et al., 2000; Schefuß et al., 2003; Vogts et al.,
expected to cause a poleward shift of the ACC and poten-
                                                                    2009; Duncan et al., 2019; López-Quirós et al., 2021).
tially weaken thermohaline circulation (Zhang and Delworth,
2005), this study responds to a broader need to fully under-
stand the Earth climate system in order to better predict the       2.1.1    ACL (average chain length n-alkane index)
future stability of the Antarctic ice sheet.                        Variations in the ACL through time can be used as a proxy
   A major obstacle in understanding the role of the open-          of terrestrial organic matter inputs and can also provide
ing Drake Passage and ocean currents in Cenozoic climate            information on changes in climate (Collister et al., 1994;
change has been the lack of well-dated continuous records           Rommerskirchen et al., 2006; Mahiques et al., 2017; Dun-
spanning the EOT from the region. Here we present new               can et al., 2019; López-Quirós et al., 2021). Plants produce
terrestrial palynomorph data from the EOT recovered in the          higher ACLs in warmer, tropical regions, whilst lower ACLs
Ocean Drilling Program (ODP) Leg 113, Site 696, Hole B              are generally observed from cooler climates (Poynter et al.,
(herein referred to as Site 696), containing a well-recovered       1989; Sicre and Peltzer, 2004; Jeng, 2006; Vogts et al., 2009;
EOT section (∼ 37.6–32.2 Ma; Houben et al., 2013, 2019).            Bush and McInerney, 2015; Duncan et al., 2019; López-
Vegetation composition, structure, and diversity patterns           Quirós et al., 2021). Studies have also suggested plants syn-
are reconstructed along with sporomorph-based quantitative          thesize longer n-alkanes in more arid environments provid-
climate estimates in order to explore the timing and na-            ing plants with a more efficient wax coating to restrict wa-
ture of vegetation and climate change across the northern           ter loss (e.g. Kolattukudy et al., 1976; Schefuß et al., 2003;
Antarctic Peninsula region and South Orkney Microconti-             Calvo et al., 2004; Zhou et al., 2005; Moossen et al., 2015;
nent (SOM). The results are compared with recently com-             Jalali et al., 2017, 2018), indicating aridity has a strong con-
piled lipid biomarker (n-alkane) data (López-Quirós et al.,         trol on ACL and that ACL values decrease under wetter con-
2021) and dinoflagellate cyst data (Houben et al., 2013) to         ditions (Duncan et al., 2019; López-Quirós et al., 2021). At
better understand shifts in marine as well as terrestrial en-       Site 696 ACL values display an upward decreasing trend
vironments and the source of terrestrial versus aquatic or-         (Fig. 5; López-Quirós et al., 2021). Higher ACLs indicate
ganic matter. Our results reveal new insights into the timing       a mixed input from higher land plants generally synthesized
of terrestrial climate cooling in the region and glacial onset      under warmer climate conditions (Jeng, 2006; Vogts et al.,
in Antarctica across the EOT.                                       2009; Bush and McInerney, 2015).

2   Previous geochemical analyses                                   2.1.2 Paq (aquatic plant n-alkane index)

The following section will focus on the interpretation of lipid     The Paq provides an approximate measure of the relative
biomarker (n-alkane) and stable isotope data from Site 696          sedimentary contribution of submerged and floating aquatic
by López-Quirós et al. (2021). For a full description of geo-       macrophytes relative to emergent and terrestrial vegetation
chemical methods see López-Quirós et al. (2021).                    (Ficken et al., 2000; López-Quirós et al., 2021). Sphagnum
                                                                    mosses also have a molecular distribution similar to sub-
                                                                    merged and floating macrophytes, showing enhanced pro-

Clim. Past, 18, 209–232, 2022                                                           https://doi.org/10.5194/cp-18-209-2022
N. Thompson et al.: Vegetation change across the Eocene–Oligocene Drake Passage region                                       211

duction of C23 and/or C25 (Baas et al., 2000; Nott et al., 2000;   tio (Müller, 1977; Sampei and Matsumoto, 2001). Therefore,
Nichols et al., 2006; Duncan et al., 2019). Therefore, the Paq     TOC may be a better indication for palaeoproductivity de-
reflects the input from Sphagnum and aquatic plants versus         spite dependence on degradation and thus the residence time
terrestrial vegetation. At the study site Paq values 0.9;        places the studied section at 33.2 to 37.6 Ma (Table 1), with
López-Quirós et al., 2021) between TOC and TN. In addi-            sediments encompassing the EOT and EOIS event recovered
tion, close correspondence between the two proxy records           between 571.5 to 569.1 m b.s.f. (Houben et al., 2013).
suggests TOC and TN reflect the same bulk organic matter              A total of 35 samples from the late–middle Eocene to ear-
source. C/N ratio values from Site 696 indicate a mixture          liest Oligocene (643.73–520.88 m b.s.f.) were analysed for
of marine and terrestrially derived sources (López-Quirós et       their pollen and spore content. Raw data collected are avail-
al., 2021), consistent with the presence of both marine and        able from the PANGAEA database (Thompson et al., 2021).
terrestrial palynomorphs.                                          All palynological slides were prepared using standard chem-
   Organic matter in marine sediments is mainly derived from       ical palynological processing techniques following the pro-
the decomposition of plants, animals, and most importantly         tocols at the University of Northumbria, Department of Ge-
plankton (Avramidis et al., 2015). High planktonic primary         ography and Environmental Sciences, and the Laboratory of
production and zooplankton grazing results in increased ex-        Palaeobotany and the Laboratory of Palaeobotany and Paly-
port of organic matter through the water column to the sea         nology of Utrecht University, published previously (e.g. Bijl
floor supporting increased preservation of organic carbon in       et al., 2018; Riding, 2021). Samples were treated with 30 %
sediments. Although the C/N ratios have been interpreted to        HCl overnight and cold 38 % HF to dissolve carbonates and
essentially be equal to the weight ratio of Corg. to organic       silicates respectively. Next 30 % HCl was then added to re-
nitrogen (i.e. C/Norg. ratio), the presence of inorganic nitro-    move fluoride gels and subsequently centrifuged, decanted,
gen measured within TN has led some researchers to point           and sieved using 250 to 10 µm sieve meshes. Residues were
out that a relatively high Ninorg. could affect the C/N ra-        mounted on glass slides using glycerine jelly. Slides were

https://doi.org/10.5194/cp-18-209-2022                                                          Clim. Past, 18, 209–232, 2022
212                                    N. Thompson et al.: Vegetation change across the Eocene–Oligocene Drake Passage region

Figure 1. Modern-day geographical and tectonic setting of the study area, showing the location of ODP Site 696 on the south-eastern margin
of the SOM (red circle) and litho-tectonic units superimposed for the Antarctic Peninsula and southern South America (modified after Elliot,
1988). Tectonic setting and features after Maldonado et al. (2014). APR, Antarctic-Phoenix Ridge; BB, Bruce Bank; Sea; DB, Discovery
Bank; DvB, Dove Basin; EB, Endurance Basin; ESR, East Scotia Ridge; FP, Falkland Plateau; HB, Herman Bank; JB, Jane Basin; JBk, Jane
Bank; OB, Ona Basin; PB, Powell Basin; PBk, Protector Bank; PrB, Protector Basin; SB, Scan Basin; SGM, South Georgia Microcontinent;
SI, Seymour Island; SOM, South Orkney Microcontinent; SSIB, South Shetland Islands Block; TR, Terror Rise; WSR, West Scotia Ridge;
and WSS, West Scotia Sea. (Adapted from López-Quirós et al., 2019, 2021.)

Table 1. Revised age model for Ocean Drilling Program (ODP) Leg 113, Site 696, determined by calcareous nannofossil and dinoflagellate
cyst biostratigraphy (FO: first occurrence; FCO: first common occurrence).

 Event/characteristic   Kind             Lower    Upper    Bottom depth   Top depth   Mid-depth   Reference              Age (Ma)   Reference
                                         level    level
 FO Chiropteridium      Dinocysts        53R-3,   53R-2,        552.70      551.70       552.20   Houben et al. (2019)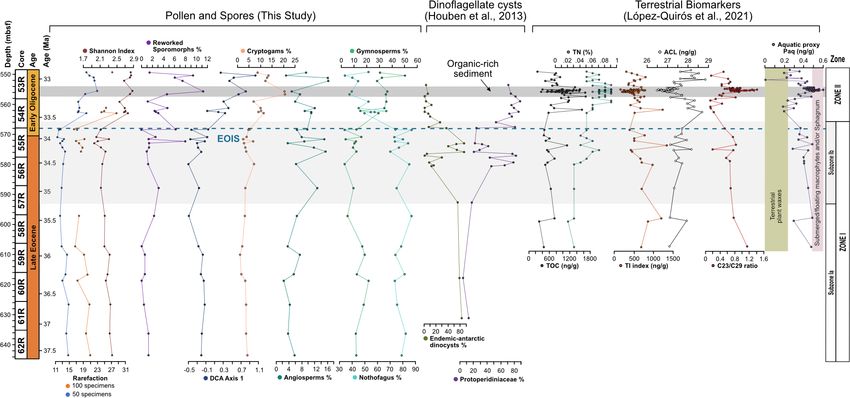
N. Thompson et al.: Vegetation change across the Eocene–Oligocene Drake Passage region                                                213

Figure 2. Stratigraphy of the studied sedimentary interval from ODP, Site 696, Hole B. From left to right: simplified lithological log of
ODP Site 696, age–depth plot based on biostratigraphy, cores, detailed lithological log of Eocene–Oligocene Unit VII, and clay mineral
percentage. Biostratigraphic age constraints based on calcareous nannofossils (Wei and Wise, 1990) and dinoflagellate cysts (Houben et al.,
2013). Detailed lithological log from López-Quirós et al. (2019, 2021). Clay minerals are from Robert and Maillot (1990). (Adapted from
López-Quirós et al., 2019, 2021.)

the final calculation of sporomorph percentages. Pollen per-            tion technique is used in order to evaluate ecological patterns
centages were plotted using riojaPlot, based on the R pack-             within the data, using knowledge of the distribution of NLRs
age rioja (Juggins, 2020) and local zones were established              and their modern environmental gradients (Correa-Metrio et
using the CONISS (constrained incremental sum of squares:               al., 2014). Rarefaction, Shannon–Wiener, and DCA were all
Grimm, 1987) cluster analysis function. Sporomorph diver-               performed using the software R for statistical computing (R
sity was measured using both the Shannon–Wiener index                   Development Core Team, 2013) and the package Vegan (Ok-
and the observed number of taxa. A rarefaction method for               sanen et al., 2020).
sums of ≥ 50 and ≥ 100 grains was applied, so that the effect
caused by differences in the sample size may be removed al-             3.1   Bioclimatic analysis
lowing the estimation of the number of sporomorph species
at a constant sample size (Raup, 1975; Birks and Line, 1992).           Estimates for terrestrial mean annual temperature (MAT),
The Shannon–Wiener index was also carried out as the sec-               mean annual precipitation (MAP), warmest month mean
ond measure of sporomorph diversity accounting for species              temperature (WMMT), and coldest-month mean temperature
richness and evenness (Shannon, 1948; Morris et al., 2014).             (CMMT) were obtained using the NLR approach in con-
Samples containing less than 50 grains were omitted from                junction with the probability density function (PDF) method.
this analysis. Detrended correspondence analysis (DCA) was              Fossil taxa used and their NLRs are shown in Table 2.
performed, with downweighting of rare species by remov-                   Climate estimates based on the NLR approach use pres-
ing pollen types whose representation is
214                                 N. Thompson et al.: Vegetation change across the Eocene–Oligocene Drake Passage region

Table 2. List of fossil pollen and spore taxa and their NLR used in sporomorph-based climate estimates from ODP Site 696.

  Fossil taxa                               Botanical affinity                    Reference                      NLR used for climate
                                                                                                                 analysis
  Angiosperms
  Acaena sp.                                Acaena                                                               Acaena
  Arecipites sp.                            Arecaceae                             Raine et al. (2011)            Arecaceae
  Beaupreaidites cf. verrucosus             Proteaceae (Beauprea).                Raine et al. (2011)            Beauprea
  Chenopodipollis chenopodiaceoides         Amaranthaceae (Chenopodioideae)       Raine et al. (2011)            Chenopodiaceae
                                                                                                                 (Chenopodioideae)
  Clavatipollenites ascarinoides            Chloranthaceae (Ascarina).            Barreda et al. (2020)          Ascarina
  Cupanieidites orthoteichus                Sapindaceae                           Raine et al. (2011)            Sapindaceae
  Ericipites cf. scabratus                  Ericaceae                             Raine et al. (2011)            Ericaceae
  Lateropora glabra                         Pandanaceae (Freycinetia)             Raine et al. (2011)            Freycinetia
  Liliacidites intermedius                  Liliaceae (?Arthropodium)             Raine et al. (2011)            Liliaceae
  Lymingtonia cf. cenozoica                 Nyctaginaceae (Pisonia brunoniana)    Raine et al. (2011)            Pisonia
  Malvacipollis cf. subtilis                Malvaceae?/Euphorbiaceae              Raine et al. (2011)            Euphorbiaceae
  Myricipites harrisii                      Casuarinaceae/Myricaceae              Raine et al. (2011)            Myricaceae
  Myrtaceidites cf. mesonesus               Myrtaceae (Metrosideros)              Barreda et al. (2020, 2021)    Metrosideros
  Nothofagidites asperus complex            Nothofagus (Lophozonia)               Raine et al. (2011)            Nothofagus menziesii
  Nothofagidites brachyspinulosus           Nothofagus (Fuscospora)               Raine et al. (2011)            Fuscospora
  Nothofagidites lachlaniae                 Nothofagus (Fuscospora)               Raine et al. (2011)            Fuscospora
  Nothofagidites emaricidus complex         Nothofagus (Brassospora)              Raine et al. (2011)            Brassospora
  Nothofagidites flemingii                  Nothofagus (Nothofagus)               Barreda et al. (2020, 2021)    Nothofagus
  Nothofagidites rocanensis                 Nothofagus (Nothofagus)               Barreda et al. (2021)          Nothofagus
  Nothofagidites spp.                       Nothofagaceae                         Barreda et al. (2020, 2021)    Nothofagaceae
  Propylipollis reticuloscabratus           Proteaceae (Gevuina/Hicksbeachia)     Barreda et al. (2020, 2021)    Proteaceae
  Proteacidites spp.                        Proteaceae                            Barreda et al. (2020, 2021)    Proteaceae
  Sparganiaceaepollenites barungensis       Sparganiaceae (Sparganium)            Macphail and Cantrill (2006)   Sparganium

for sporomorph-based climate estimates from marine sed-                   and leaf margin analysis (e.g. Kennedy, 2003; Uhl et al.,
iments, where hydrodynamic sorting of grains may cause                    2003; Ballantyne et al., 2010; Pross et al., 2012; Kennedy et
variations in the percentages of individual taxa (Arias,                  al., 2014; Pound and Salzmann, 2017; Willard et al., 2019),
2015) and also helps reduce taphonomic biases (Klages et                  providing a certain level of confidence (Klages et al., 2020;
al., 2020). However, the assumption that modern species                   Pross et al., 2012).
and their climate requirements have remained unchanged                       The PDF method is used to statistically constrain the
throughout geological time represents one of the biggest                  most likely climate co-occurrence window for an assemblage
weaknesses of the NLR approach. This uncertainty in-                      (Harbert and Nixon, 2015; Willard et al., 2019; Klages et al.,
evitably increases further back in the geological record (Hol-            2020). The bioclimatic envelope for each NLR was identified
lis et al., 2019). It should also be noted that the modern distri-        by cross-plotting the modern distribution from the Global
bution of species may be a function of either its past climate            Biodiversity Information Facility (GBIF; GBIF, 2021) with
or biogeographic history (Reichgelt et al., 2016; Willard et              the gridded WorldCLIM (Fick and Hijmans, 2017) climate
al., 2019). Nevertheless, temperature estimates derived from              surface data using the dismo package (Hijmans et al., 2021)
the NLR approach are often in agreement with those from                   in R. Some taxa were grouped at the family level because of
other botanical methods and geochemical proxies, such as                  their potentially ambiguous climatic affinity. This includes
the Climate Leaf Analysis Multivariate Program (CLAMP)                    (1) pollen taxa affiliated with the modern-day genus Micro-

Clim. Past, 18, 209–232, 2022                                                                  https://doi.org/10.5194/cp-18-209-2022
N. Thompson et al.: Vegetation change across the Eocene–Oligocene Drake Passage region 215
Table 2. Continued.
Fossil taxa Botanical affinity Reference NLR used for climate
analysis
Gymnosperms
Araucariacites australis Araucariaceae (Araucaria) Barreda et al. (2020, 2021) Araucaria
Dacrydiumites praecupressinoides Podocarpaceae (Dacrydium cupressinum) Raine et al. (2011) Dacrydium
Microalatidites paleogenicus Podocarpaceae (Phyllocladus) Barreda et al. (2021) Phyllocladus
Microcachryidites antarcticus Podocarpaceae (Microcachrys tetragona) Barreda et al. (2020, 2021) Podocarpaceae
Phyllocladidites mawsonii Podocarpaceae (Lagarostrobos franklinii). Barreda et al. (2021) Lagarostrobos
franklinii
Podocarpidites spp. Podocarpaceae (Podocarpus) Barreda et al. (2020, 2021) Podocarpus
Podosporites spp. Podocarpaceae (cf. Microcachrys) Raine et al. (2011) Podocarpaceae
Trichotomosulcites subgranulatus Podocarpaceae (Microcachrys) Barreda et al. (2021) Podocarpaceae
Cryptogams
Baculatisporites comaumensis Osmundaceae Barreda et al. (2020) Osmundaceae
Ceratosporites cf. equalis Selaginellaceae (Selaginella) Raine et al. (2011) Selaginellaceae
Coptospora archangelskyi Bartramiaceae (Conostomum) Raine (1998) Conostomum
Cyathidites spp. Cyatheaceae/Dicksoniaceae/Schizaeaceae Barreda et al. (2020) Cyatheaceae
Dictyophyllidites arcuatus Gleicheniaceae (?Dicranopteris) Raine et al. (2011) Dicranopteris
Foveotriletes lacunosus Lycopodiaceae (Huperzia) Raine et al. (2011) Huperzia
Gleicheniidites spp. Gleicheniaceae Barreda et al. (2020) Gleicheniaceae
Laevigatosporites spp. Polypodiaceae Barreda et al. (2020) Polypodiaceae
Monolites alveolatus cf. Polypodiaceae (Belvisia) Raine et al. (2011) Belvisia
Osmundacidites cf. wellmanii Osmundaceae (Todea barbara) Raine et al. (2011) Osmundaceae
Polypodiisporites cf. radiatus Davalliaceae (Davallia) Conran et al. (2010) Davallia
Retitriletes/Lycopodiacidites Lycopodiaceae (Lycopodium) Raine et al. (2011) Lycopodium
Stereisporites spp. Sphagnaceae (Sphagnum) Truswell and Macphail (2009) Sphagnum
cachrys, of which Microcachrys tetragona is the sole species, morph of unknown affiliation were identified (excluding re-
on the basis that M. tetragona is only found in a particu- worked and unidentified sporomorphs), containing 54 gen-
lar location in Tasmania, Australia, under narrow climatic era. The stratigraphic distribution and relative abundance
and environmental conditions which are likely not represen- of major taxon groups is shown in Fig. 3. Pollen affili-
tative of this once widespread genus and (2) the pollen taxon ated with the modern-day genus Nothofagus are the most
Peninsulapollis gillii, which has links to the modern genus abundant throughout the section, with pollen taxa belong-
Beauprea now also endemic to New Caledonia. In these ing to the Nothofagidites lachlaniae complex, undifferenti-
cases, Podocarpaceae and Proteaceae were used rather than ated Nothofagidites spp., Nothofagidites rocanensis, and the
the genus or species as the NLR. Nothofagidites brachyspinulosus complex being the largest
groups. Other major pollen and spore taxa, in order of
decreasing abundance include, undifferentiated Podocar-
4 Results pidites spp., undifferentiated Retitriletes/Lycopodiacidites
spp., Podocarpidites cf. exiguus, pollen belonging to the
The recovery of palynomorphs is good throughout the Podocarpidites marwickii/ellipticus complex, Cyathidites
section. Of the 34 samples analysed 5 do not contain minor, and Phyllocladidites mawsonii, which occur com-
a sufficient amount of sporomorphs and were discarded monly throughout the Eocene and Oligocene sections.
from further analysis. In total 74 pollen taxa (58 an-
giosperms and 16 gymnosperms), 24 spores, and 1 sporo-
https://doi.org/10.5194/cp-18-209-2022 Clim. Past, 18, 209–232, 2022216 N. Thompson et al.: Vegetation change across the Eocene–Oligocene Drake Passage region
Figure 3. Frequency and stratigraphic distribution of major pollen and spore taxa with CONISS ordination showing two distinct zones
(Zone I and Zone II); Zone I is further subdivided based on the occurrence of key taxa. Pollen and spore taxa have been separated into key
ecological groups.
Based on the results of CONISS ordination the succession belonging to the Nothofagidites lachlaniae complex (sub-
is divided into two main zones (I and II; Fig. 3). In addition, genus: Fuscospora) are the most abundant followed by un-
Zone I is further subdivided (Ia, Ib), based on the abundance differentiated Nothofagus spp. sporomorphs and N. rocanen-
and presence of key taxa. The results of rarefaction and DCA sis (subgenus: Nothofagus). Other angiosperm pollen (non-
analysis along with the diversity index results also show a Nothofagidites) is rare, making up about 4.2 % of the non-
good distinction between Zones I and II. reworked sporomorph assemblage in Zone 1. Of the non-
Nothofagus angiosperm taxa the most abundantly occur-
ring, in order of decreasing abundance, include Proteacidites
4.1 Zone I, 37.6–33.6 Ma (643.73–568.82 m b.s.f.) (NLR: Proteaceae), Tricolpites (Dicotyledonae), Liliacidites
Zone I comprises of 18 samples (62R 6W 142–144 to 55R intermedius (Liliaceae), and Lateropora glabra (Freycine-
1W 62–64). Based on the age models of Wei and Wise (1990) tia). Other less common angiosperms are typically only rep-
and Houben et al. (2013, 2019) and linear extrapolation, the resented by one or two occurrences. The second-most abun-
lowermost 16 samples are placed in the Eocene, while the dant group are gymnosperms, which account for 10.6 % of
uppermost two samples are placed in the earliest Oligocene all non-reworked taxa. Predominantly gymnosperms are rep-
(37.6 to ∼ 33.6 Ma). Quantitatively, Zone I is typified by rel- resented by the pollen taxa (in order of abundance) Podocar-
atively low numbers of sporomorph species and low diver- pidites, Phyllocladidites, Trichotomosulcites subgranulatus
sity. Based on rarefaction analysis, the average number of (all Podocarpaceae), undifferentiated Podocarpidites spp.
sporomorph species per sample is 13.28 ± 1.05 (mean ± SD) (Podocarpus), and Araucariacites australis (Araucariaceae).
at a count of 50 grains. Low levels of diversity are confirmed Many of these are likely to belong to Podocarpidites; how-
by the Shannon diversity index (H ), which indicates an av- ever, folding of the grains has made further identification im-
erage of 1.79 ± 0.06. possible. Cryptogams account for 6.23 % of non-reworked
The overall Zone I assemblage is dominated by the south- taxa in Zone 1 and include both ferns and mosses. Abun-
ern beech, Nothofagus (pollen taxon: Nothofagidites). On dantly occurring cryptogam spores include taxa belonging
average Nothofagidites pollen accounts for 79.0 % of all to the Retitriletes/Lycopodiacidites spp. complex (Lycopo-
non-reworked taxa and 95.0 % of all angiosperm taxa. Taxa
Clim. Past, 18, 209–232, 2022 https://doi.org/10.5194/cp-18-209-2022N. Thompson et al.: Vegetation change across the Eocene–Oligocene Drake Passage region 217
diaceae), Cyathidites (Cyatheaceae), Ischyosporites gremius vaceae), Proteacidites cf. amolosexinus, P. cf. Lewalanipol-
(Filicopsida), and Coptospora archangelskyi (Conostomum). lis trycheros, P. scaboratus, P. spiniferus (all Proteaceae),
Sparganiaceaepollenites barungensis (Sparganium) (Tricol-
4.1.1 Subzone Ia 37.6–35.5 Ma (643.73–597.66 m b.s.f.)
pites cf. brevicolpus, T. reticulatus (both extinct clade), and
Camarozonosporites sp. (Lycopsida). Sporomorph-based cli-
The Subzone Ia assemblage is unique in that Arecipites mate estimates reveal MAT between 10.1 and 11.7 ◦ C and
spp. (Arecaceae), Beaupreaidites (Beauprea), and Myrta- MAP between 1499 and 2042 mm, with an average of
ceidites cf. mesonesus (Myrtaceae), all warmth-loving taxa 10.7 ◦ C and 1706 mm respectively for Subzone Ib (Fig. 4).
whose NLRs predominantly have a tropical and subtropi-
cal distribution, especially in the Pacific, Southeast Asia and 4.2 Zone II, ca. 33.5–32.2 Ma (563.38–549.70 m b.s.f.)
New Caledonia, and only occur in this subzone. Ericipites
cf. scabratus (Ericaceae), Chenopodipollis cf. chenopodi- The 11 samples of Zone II (53R 1W 80–82 to 54R 3W 38–
aceoides (Chenopodioideae), Polypodiisporites cf. radiatus 41) are assigned an Oligocene age. Zone II records a signif-
(Davallia), Podosporites parvus (Podocarpaceae), and Tri- icant increase in gymnosperms and cryptogams, accompa-
colpites cf. asperamarginis (extinct clade) are also unique nied by a rapid rise in taxon diversity between ca. 33.5 and
to Subzone Ia. In addition, pollen taxa belonging to the 32 Ma and a contemporaneous increase in reworked Meso-
genus Podocarpidites are more abundant throughout Sub- zoic sporomorphs (Fig. 3). Based on the results of rarefac-
zone Ia compared to Subzone Ib, in particular taxa be- tion analysis the average number of sporomorph species for
longing to the Podocarpidites marwickii/ellipticus complex a count size of 50 grains is 19.63 ± 2.00. The results of the
and P. cf. exiguus (both Podocarpus). Furthermore, taxa be- Shannon diversity index are between 1.97 and 2.12, with an
longing to the Nothofagidites asperus complex (subgenus: average of 2.06 ± 0.05.
Lophozonia), Microcachryidites antarcticus, Trichotomosul- The Zone II sporomorph assemblages show a signifi-
cites subgranulatus (both Podocarpaceae), Gleicheniidites cant decrease in Nothofagus compared to Zone I. Nothofa-
(Gleicheniaceae), and Ischyosporites (Filicopsida) are also gus pollen make up 51.2 % of all non-reworked taxa and
more abundant in Subzone Ia in comparison to Subzone Ib. 89.9 % of all angiosperm taxa in Zone II. Pollen taxa
Other rare taxa such as Lymingtonia cf. cenozoica (Nyctag- belonging to the Nothofagidites lachlaniae complex (sub-
inaceae), Myrtaceidites spp. (Myrtaceae), Proteacidites tu- genus: Fuscospora) remain the most abundant, followed
berculatus (Proteaceae), and Ceratosporites cf. equalis (Se- by N. rocanensis (subgenus: Nothofagus), with undifferen-
laginellaceae) also only occur in Subzone Ia of Zone I but tiated Nothofagidites spp. sporomorphs also making a valu-
are represented by one or two specimens. Sporomorph-based able contribution. Other pollen taxa belonging to Nothofa-
climate reconstructions reveal significantly higher tempera- gus are less abundant and represented by only a few oc-
tures within Subzone Ia compared to Subzone Ib, with an currences. Although a slight increase in other angiosperms
interval of latest Eocene cooling occurring around 35.5 Ma. (non-Nothofagus) occurs in Zone II, they remain the smallest
MAT ranges from 10.5 to 15.3 ◦ C and MAP ranges from botanical group, representing just 5.8 % of all non-reworked
1580 to 2005 mm, with an average of 12 ◦ C and 1802 mm sporomorphs. In order of abundance, from most to least
respectively for Subzone Ia (Fig. 4). abundant, significant non-Nothofagus angiosperm taxa in-
clude Proteacidites, Tricolpites, Myricipites harrisii (Ca-
4.1.2 Subzone Ib 35.0–33.6 Ma (588.25–568.82 m b.s.f.)
suarinaceae), and Peninsulapollis gillii (Proteaceae). Addi-
tional angiosperm taxa are typically represented by one or
Subzone Ib records the loss of thermophilic plant types two occurrences (e.g. Chenopodipollis chenopodiaceoides).
(Arecaceae, Beauprea, and Myrtaceae) that are only found Gymnosperms remain the second-most abundant botani-
within Subzone Ia and a decrease in the abundance of cal group, but their abundance has increased markedly,
Podocarpaceae. In comparison to Subzone Ia, taxa belong- representing 28.3 % of all non-reworked sporomorphs in
ing to Proteaceae are more abundant within Subzone Ib, Zone II. The gymnosperm assemblage remains dominated
in particular the pollen taxa belonging to the Proteacidites by Podocarpidites and Phyllocladidites, which are the two
parvus/pseudomoides complex, P. cf. Scabratriporites spp., most common gymnosperm taxa respectively. However,
and P. tenuiexinus (all Proteaceae). Other pollen taxa that other changes in the gymnosperm pollen include Dilwynites
increase in abundance and frequency within Subzone Ib of (Wollemia), which increase in frequency and abundance,
Zone I include Liliacidites intermedius (Liliaceae), Tricol- along with Alisporites cf. australis (Gymnospermopsida),
porites cf. scabratus (extinct clade), Coptospora archangel- Microcachryidites antarcticus, Podosporites, Trichotomo-
skyi (Conostomum), and Retitriletes/Lycopodiacidites spp. sulcites subgranulatus (all Podocarpaceae), and undiffer-
(Lycopodium). Other rare taxa are also unique to Subzone entiated Podocarpidites spp. (Podocarpus), among others.
Ib of Zone I and are represented by one of two occurrences. Sporomorph-based climate estimates provide no evidence for
These include Clavatipollenites ascarinoides (Ascarina), abrupt cooling at the Eocene–Oligocene boundary. Within
Ligulifloridites (Asteraceae), Parsonsidites psilatus (Mal- the early Oligocene Zone II MATs are between 10.4 to
https://doi.org/10.5194/cp-18-209-2022 Clim. Past, 18, 209–232, 2022218 N. Thompson et al.: Vegetation change across the Eocene–Oligocene Drake Passage region
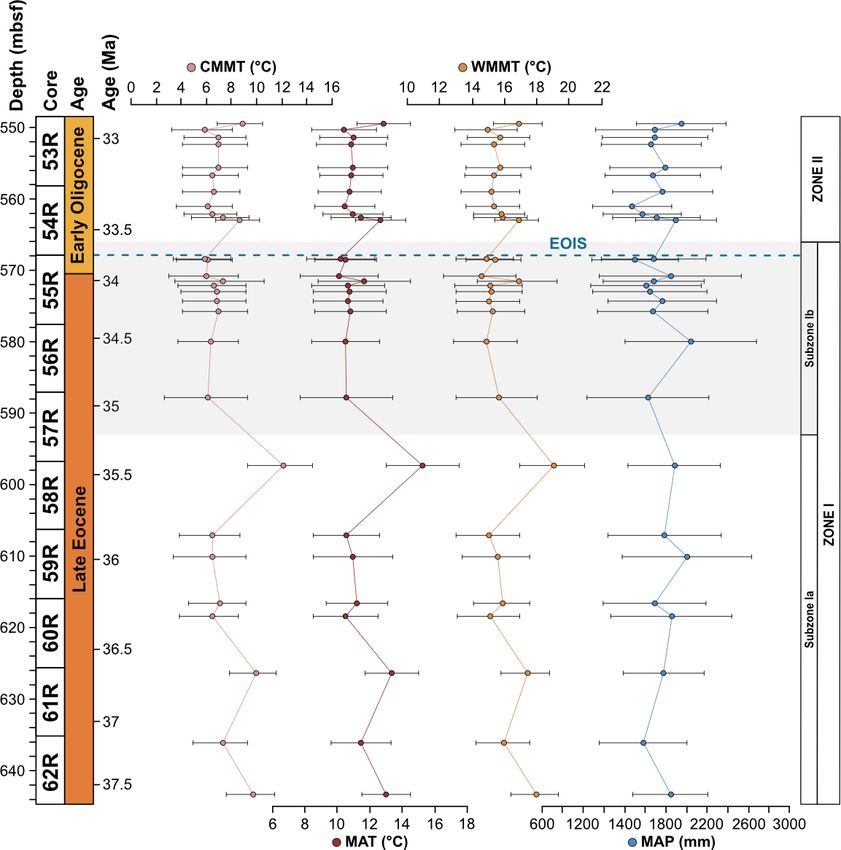
Figure 4. Sporomorph-based quantitative climate estimates using probability density functions (PDFs). From left to right: coldest-month
mean temperature (CMMT), mean annual temperature (MAT), warmest month mean temperature (WMMT), and mean annual precipitation
(MAP).
12.9 ◦ C, and MAP ranges from 1571 to 1951 mm a year, with ing suggests that pollen from the Antarctic Peninsula region
an average of 11.2 ◦ C and 1715 mm respectively (Fig. 4). could have been transported to the SOM during this time.
These results indicate a slight increase in both temperature Furthermore, similarities between Facies IV and nearby Sey-
and precipitation compared to the latest Eocene Subzone Ib. mour Island sediments, both in composition and palaeogeo-
graphic setting, could suggest a related sediment source and
that the SOM was proximal enough to receive detritus from
5 Discussion the Antarctic Peninsula (Barker et al., 1988; López-Quirós
et al., 2021). However, despite these similarities, significant
5.1 Sediment transport and provenance differences in the palaeoflora occur between the two regions,
indicating the Antarctic Peninsula may not have been the pri-
The late Eocene terrestrial vegetation assemblage from Site mary sediment source. In agreement with previous observa-
696 shares a number of similarities with Antarctic Peninsula tions by Mohr (1990) the sporomorph assemblage from Site
palaeofloras of similar ages (e.g. Warny and Askin, 2011; 696 contains a greater diversity of angiosperm pollen com-
Warny et al., 2019). Both Site 696 and Antarctic Peninsula pared to late Eocene Antarctic Peninsula palaeofloras (e.g.
late Eocene assemblages are dominated by Nothofagidites Anderson et al., 2011; Warny and Askin, 2011; Warny et
pollen, predominantly those related to the modern subgenus al., 2019). This higher diversity has also been reported in
Fuscospora, with secondary gymnosperms, including high southern South American Paleogene sporomorph floras (e.g.
frequencies of Podocarpaceae pollen. Similar angiosperm Romero and Zamaloa, 1985; Romero and Castro, 1986). In
and cryptogam assemblages are also seen between the two, addition, the late Eocene Zone Ia assemblage (37.6–35.5 Ma)
with angiosperms such as Proteaceae and Liliaceae, and at Site 696 contains the thermophilic taxa Arecipites spp.
cryptogams such as Cyatheaceae and Sphagnum. This find-
Clim. Past, 18, 209–232, 2022 https://doi.org/10.5194/cp-18-209-2022N. Thompson et al.: Vegetation change across the Eocene–Oligocene Drake Passage region 219 (Arecaceae), Myrtaceidites cf. mesonesus (Myrtaceae), and posited at Site 696 are not of local origin. Using detrital Polypodiisporites cf. radiatus (Davallia) not recorded in co- zircon U–Pb and apatite thermochronometry analysis these eval Antarctic Peninsula assemblages, possibly due to the authors concluded that sand grains, featuring characteris- more northern latitude of the SOM resulting in milder cli- tics of ice transport, from the late Eocene Site 696 best matic conditions. Sediments may also have been supplied matched sources within the Ellsworth–Whitmore Mountains, from the southern tip of South America (e.g. the Magallanes West Antarctica. Barriers to the delivery of sediment by long- Basin and the Fuegian Andes; Carter et al., 2017), due to distance gravity flows from the margins of the southern Wed- the more proximal location of the SOM to South America dell Sea further suggested that sediments may have been prior to its separation from Antarctica during the Eocene (Ea- transported to the SOM by icebergs (Carter et al., 2017). gles and Jokat, 2014). However, detrital zircon ages clearly In spite of this, the presence of in situ thermophilic taxa show a strong dissimilarity between Site 696 samples and within the early–late Eocene of Site 696 (37.6–35.5 Ma) sug- South America (Carter et al., 2017). Furthermore, the occur- gests mild and even ice-free conditions during this overlap- rence of well-preserved palynomorphs and moderate to well- ping time period. Furthermore, palaeo-sea-surface tempera- preserved in situ benthic foraminifera, with predominantly ture reconstructions (Douglas et al., 2014) indicate relatively angular to subangular terrigenous particles, does not support warm conditions (∼ 14 ◦ C), and fossil dinoflagellate cyst the notion of long-distance transport of sediments from adja- (Houben et al., 2013, 2019), calcareous nannofossils (Wei cent sources (e.g. Seymour Island and southern South Amer- and Wise, 1990), and smectite-dominated clay mineralogy ica; López-Quirós et al., 2021). These observations, together (Fig. 2: Robert and Maillot, 1990) support temperate deposi- with an expansion of gymnosperm conifers and cryptogams tional conditions (López-Quirós et al., 2021) not favourable recorded during the early Oligocene (33.5–32.2 Ma) at Site for transport by ice. Unequivocal evidence for ice transport, 696 but absent from Antarctic Peninsula and southern South in the form of ice-rafted debris, at Site 696 is observed within America floras (e.g. Askin, 1992; Anderson et al., 2011), two coarse-grained mudstone intervals within a fine-grained suggest that the vegetation of the SOM was unique in charac- transgressive sequence deposited around 34.1 Ma (Barker et ter. It is therefore likely that a significant proportion of detri- al., 1988; López-Quirós et al., 2021). However, these inter- tal material, including sporomorphs, was likely of local ori- vals contain altered glaucony grains most likely sourced from gin (e.g. exposed parts of the SOM), with some input from shallower SOM coastal and/or shelf areas (López-Quirós et the northern Antarctic Peninsula and possibly southern South al., 2019, 2021). Therefore, these observations and those of America during the late Eocene. this study suggest that transportation by ice from adjacent The SOM and the northern Antarctic Peninsula underwent land areas (e.g. Antarctic Peninsula and Ellsworth–Whitmore significant rifting during the late Eocene and early Oligocene Mountains) was unlikely before 34.1 Ma and that a major- (∼ 37–30 Ma; King and Barker, 1988; Eagles and Livermore, ity of sediments transported to Site 696 are likely of local 2002; van de Lagemaat et al., 2021), forming what would origin from exposed parts of the SOM as the Powell basin become the Powell Basin (Eagles and Livermore, 2002; Ea- opened isolating the microcontinent from the possible sedi- gles and Jokat, 2014; van de Lagemaat et al., 2021; López- ment supply of the Antarctic Peninsula and southern Weddell Quirós et al., 2021). This rifting resulted in the capture of Sea margins. terrigenous detritus likely from the northern Antarctic Penin- sula and exposed parts of the SOM (South Orkney Islands; Carter et al., 2017). However, throughout the latest Eocene 5.2 Palaeoenvironment and palaeoclimate (∼ 35.5–34.1 Ma), a decrease in the delivery of coarse ter- 5.2.1 Late Eocene palaeoenvironment and rigenous sediments and a decrease in sedimentation rates palaeoclimate by almost half is observed as the SOM became more distal from the Antarctic Peninsula due to the opening of the proto- Sediments from Site 696 record two distinct palaeoflo- Powell Basin (Eagles and Livermore, 2002; López-Quirós ras from the late Eocene Zone I to the early Oligocene et al., 2021). Deposition of moderately to intensely biotur- Zone II assemblage that evolved in response to an increase bated silty mudstones across the EOT (∼ 34.1–33.6 Ma) in- in environmental disturbance beginning around 34.1 Ma. dicate continued subsidence-related marine transgression at Throughout the Zone I assemblage (∼ 37.6–33.6 Ma) abun- Site 696 (López-Quirós et al., 2021). This subsequent and dant Nothofagus with secondary Podocarpaceae, minor an- continued isolation of the SOM may have resulted in Site giosperm, and cryptogam elements indicate the presence of 696 receiving a greater proportion of localized sediments a relatively humid Nothofagus-dominated temperate rainfor- from exposed parts of the SOM. This supports our sugges- est, growing under MATs between 10.1 and 15.3 ◦ C, and tion that the majority of sediments supplied to Site 696 at MAP of 1499 and 2043 mm (Fig. 4). Comparison with lipid this time were of local origin, perhaps still with some contri- biomarker n-alkane results (Fig. 5; López-Quirós et al., bution from the northern Antarctic Peninsula. 2021) indicates ACL indicative of temperate vegetation, sup- Conversely, however, Carter et al. (2017) suggested the porting this interpretation. In addition, marine palynomorphs majority of the late Eocene (∼ 36.5–33.6 Ma) sediments de- (Houben et al., 2013) and calcareous nannofossil (Wei and https://doi.org/10.5194/cp-18-209-2022 Clim. Past, 18, 209–232, 2022
220                          N. Thompson et al.: Vegetation change across the Eocene–Oligocene Drake Passage region

Wise, 1990) assemblages attest to temperate marine depo-          based climate estimates reveal coldest-month mean temper-
sitional conditions. Nothofagus (predominantly Fuscospora-        atures (CMMTs) between 6.2 and 11.9 ◦ C, well above freez-
type), together with less common Podocarpaceae, formed the        ing (Fig. 4). In addition, warmth-loving ferns including Gle-
forest canopy across much of the mid- to higher-altitude ar-      icheniaceae and rare Davalliaceae also occur together with
eas, with tracts perhaps dominated by one or the other due        moisture-loving conifers such as Dacrydium, which only oc-
to natural differences in shade tolerance (Poole, 1987; Ve-       cur in Subzone Ia, and Phyllocladus, further indicating warm
blen et al., 1996; Gallagher et al., 2008; Bowman et al.,         wet temperate conditions throughout this subzone. Today
2014). Microcachrys along with Araucariaceae, Ericaceae,          these taxa occur in subtropical to temperate regions in low-
Liliaceae, Chenopodioideae, and low-growing proteaceous           land sheltered environments, often thriving in wet humid
shrubs also reflect better drained higher-altitude habitats as    conditions and severely disturbed or pioneer habitats at the
well as coastal and marginal forest environments (Kühl et al.,    margins of rainforests and waterways (Specht et al., 1992;
2002; MacPhail, 1999; Kershaw and Wagstaff, 2001; Bow-            Chinnock and Bell, 1998; Bowman et al., 2014; Arias, 2015).
man et al., 2014). Prior to the opening of the Powell Basin       Similar conditions have also been documented in the late
the SOM was joined to the Antarctic Peninsula (King and           Eocene of southern New Zealand (Conran et al., 2016) sug-
Barker, 1988; López-Quirós et al., 2021), which was com-          gesting a longitudinal continuum of relatively high precipita-
parable in elevation to the Trans Antarctic Mountains and         tion and temperatures during this time interval.
Dronning Maud Land during the late Eocene (Wilson et al.,            The co-occurrence of prominent vegetation communities,
2012). This may suggest that exposed parts of the SOM also        each with very different temperature and moisture require-
had a similar mountainous elevation. Furthermore, the mod-        ments therefore suggests that late Eocene forests across the
ern topography of the South Orkney Islands reaches a maxi-        northern Antarctic Peninsula and SOM were subject to cli-
mum of 1265 m (∼ 4150 ft; USGS, 1998). Subsidence of the          matic gradients related to differences in elevation and prox-
SOM since the late Eocene (López-Quirós et al., 2021), to-        imity to the coastline. Furthermore, the presence of ther-
gether with erosion likely mean these exposed parts of the        mophilic taxa within Subzone Ia and the lack of cold-
SOM were once higher than today, supporting the recon-            temperature taxa reveal conditions were warmer, by around
struction of higher- and lower-altitude vegetation commu-         1.4 ◦ C between 37.6 and 35.5 Ma, compared to the rest
nities. Today, similar cool temperate Nothofagus-dominated        of Zone I, indicating a phase of latest Eocene cooling
mixed-podocarp forests occur in the temperate Valdivian re-       from 35.5 to 35 Ma. The cooling between 35.5 and 35 Ma
gion of southern Chile, between 37◦ 450 and 43◦ 200 S (Ve-        recorded by the terrestrial palynomorph assemblage coin-
blen et al., 1983, 1996; Poole et al., 2001, 2003; Cantrill and   cides with a slight decrease in the terrestrial n-alkane index
Poole, 2012a; Bowman et al., 2014) across elevations greater      (TI; Mahiques et al., 2017), which records absolute input of
than 2000 m to lowland areas (Kershaw, 1988; Punyasena            n-C27 +29 +30 -rich molecules present in vascular plants, in-
et al., 2011; Arias, 2015), where westerly trade winds from       dicating decreased input of terrestrial plant-derived organic
the Pacific result in high precipitation. Comparable mixed        matter (Fig. 5; López-Quirós et al., 2021). The latest Eocene
Nothofagus–podocarp forests are also found today in New           cooling recorded at Site 696 after 35.5 Ma corresponds with
Zealand (e.g. Wardle, 1984; Poole, 1987); however the geo-        large-scale changes in vegetation composition and decreas-
logical setting of southern South America, with oceanic crust     ing diversity from Antarctic Peninsula palaeoflora records
being subducted beneath a convergent continent margin, is         (e.g. Askin and Raine, 2000; Anderson et al., 2011; Warny
most similar to that of the Antarctic Peninsula region during     and Askin, 2011; Warny et al., 2011). Furthermore, an up-
the Cenozoic (Poole et al., 2001; Cantrill and Poole, 2012a).     wards increase in illite clay minerals (Robert and Maillot,
   Pollen taxa representing vegetation communities with very      1990) between approximately 36.4 to 33.9 Ma, signifying a
different temperature requirements exist within the early–late    shift in weathering regime from chemical to physical, sup-
Eocene (∼ 35.5–37.6 Ma) Subzone Ia. The presence of the           ports the idea of latest Eocene climate cooling.
thermophilic taxa Arecaceae (palms), Beauprea, and Myr-              An initial spike in reworked Mesozoic sporomorphs at
taceae, each occurring intermittently throughout this sub-        around 34.1 Ma at the onset of the EOT indicates an in-
zone (643.73–597.66 m b.s.f.), indicates the existence of a       crease in reworking. This coincides with increasing Eocene
temperate–thermophilic vegetation community. These com-           dinoflagellate cyst taxon percentages over Protoperidiniaceae
munities are not recorded in coeval Antarctic Peninsula as-       (Houben et al., 2013). Sediments within this EOT interval
semblages perhaps due to the Antarctic peninsulas high            also exhibit two coarsening-upward packages, within an oth-
mountainous palaeotopography (Wilson et al., 2012) and/or         erwise fine-grained sequence. Furthermore, these sedimen-
the lower latitude of the SOM. Thermophilic taxa likely oc-       tary packages contain the first evidence for ice-rafted de-
cupied sheltered lowland areas and favourable coastal mar-        bris (IRD; Barker et al., 1988; López-Quirós et al., 2021)
gins and would have required mild temperatures and the ab-        in conjunction with a high percentage of illite clay miner-
sence of winter frosts, owing to the frost sensitivity of ex-     als (Robert and Maillot, 1990). Based on these observations,
tant palms (Larcher and Winter, 1981; Tomlinson, 2006; Eis-       significant ice build-up around the northern Antarctic Penin-
erhardt et al., 2011; Reichgelt et al., 2018). Sporomorph-        sula and SOM is inferred during the latest Eocene, with a

Clim. Past, 18, 209–232, 2022                                                        https://doi.org/10.5194/cp-18-209-2022
N. Thompson et al.: Vegetation change across the Eocene–Oligocene Drake Passage region                                                 221

Figure 5. Distribution of key vegetation and dinocyst groups plotted against diversity index results, percentages of reworked terrestrial
palynomorphs, and n-alkane variables and ratios. From left to right: rarefaction analysis results at number of species per 50 and 100 speci-
mens, percentage of reworked terrestrial palynomorphs, DCA axis 1 results, percentage of cryptogam taxa, percentage of angiosperm taxa
(non-Nothofagus), percentage of gymnosperm taxa, percentage of Nothofagus, percentage of endemic Antarctic dinocyst taxa, percentage
of Protoperidiniaceae dinoflagellates, TOC, TI, ACL, Paq , and n-alkane n-C23 /n-C29 ratios. Dinoflagellate abundance from Houben et
al. (2013). Terrestrial biomarkers and n-alkane variables and ratios from López-Quirós et al. (2021).

period of continental ice expansion to the coast or beyond              5.2.2    Early Oligocene palaeoenvironment and
(López-Quirós et al., 2021). This is supported by the pres-                      palaeoclimate
ence of glacial surface textures on sand grains (Kirshner and
Anderson, 2011) and rare drop stones (Wellner et al., 2011)             Despite the evidence for a cooling of terrestrial climate
from late Eocene (34–37 Ma; Bohaty et al., 2013) sediments              between 35.5 and 35 Ma and latest Eocene glacial on-
offshore of James Ross Basin, as well as other sedimento-               set around 34.1 Ma, the terrestrial palynomorph assemblage
logical and geochemical evidence indicating late Eocene and             from Site 696 indicates that Nothofagus-dominated forests
early Oligocene cooling and ice expansion on the northern               did not change dramatically in composition until the early
Antarctic Peninsula (e.g. Robert and Maillot, 1990; Ivany               Oligocene, after the EOIS. An expansion of conifer trees and
et al., 2008). Furthermore, topographic reconstructions indi-           cryptogams accompanied by a rapid increase in taxon di-
cate the northern Antarctic Peninsula at the EOT was com-               versity is recorded between approximately 33.5 and 32 Ma.
parable in elevation to the Trans Antarctic Mountains and               This significant transformation of Antarctic flora in the early
Dronning Maud Land (Wilson et al., 2012). In model simu-                Oligocene is quantitatively reflected by the results of DCA
lations these are suggested nucleation points for late Eocene           analysis, as well as by a decrease in n-alkane ACL, which
and Oligocene glaciation (DeConto and Pollard 2003; De-                 in turn suggest herbaceous plants and/or conifer dominance
Conto et al., 2007), suggesting a glacial presence in the               (Fig. 5; López-Quirós et al., 2021). The diversity patterns
Antarctic Peninsula region is reasonable during this time               derived from the Shannon diversity index and rarefaction
(Carter et al., 2017; Lepp, 2018). However, the pollen and              analysis show that early Oligocene forests contained a sig-
spore assemblage from Site 696 as well as other late Eocene             nificantly higher number of taxa compared with the late
and Oligocene sporomorph assemblages from the Antarc-                   Eocene forest communities. Previous studies (e.g. Cantrill,
tic Peninsula (e.g. Anderson et al., 2011; Warny and Askin,             2001; Raine and Askin, 2001; Prebble et al., 2006; Griener
2011) indicate the region still retained some vegetation and            and Warny, 2015) suggest that significant cooling and dry-
therefore was never fully glaciated.                                    ing of the climate across the EOT led to decreasing diversity
                                                                        and a lowering of the forest canopy, with low-stature forests
                                                                        formed of scrubby dwarf Nothofagus and podocarps in shel-
                                                                        tered regions and low-altitude coastal zones. However, based
                                                                        on the relatively high diversity and frequency of cryptogam

https://doi.org/10.5194/cp-18-209-2022                                                                  Clim. Past, 18, 209–232, 2022
222 N. Thompson et al.: Vegetation change across the Eocene–Oligocene Drake Passage region taxa and non-Nothofagus angiosperms within the Zone II al., 2015). However, unlike podocarps, juvenile Nothofa- assemblage, these Nothofagus–podocarp forests would have gus also require shelter from frost and desiccation, find- been at least intermediate in stature and relatively open, al- ing it hard to establish themselves amongst other vegetation lowing the development of fern, shrub, and bryophyte com- in open and marginal forest environments until other veg- munities (e.g. Macphail and Truswell, 2004). When com- etation has been partially suppressed through overtopping pared to n-alkane results, an increase in the abundance of by Nothofagus (Wardle, 1964; Lusk et al., 2015 Rawlence cryptogams, specifically Sphagnum moss, is also supported et al., 2021). Thus, conifers are probably favoured by ex- by an increase in the aquatic plant n-alkane index (Paq ) and ogenous disturbance, providing a short-lived reprieve from n-C23 /n-C29 ratios throughout the early Oligocene (López- angiosperm competition (Enright and Hill, 1995; Lusk et Quirós et al., 2021). Sphagnum moss has been found in many al., 2015). Across the EOT and earliest Oligocene glacially Antarctic Oligocene and Miocene assemblages interpreted to related environmental disturbance and the development of represent low-diversity tundra vegetation (e.g. Raine, 1998; milder climates, possibly after the EOT (e.g. Liu et al., 2009; Askin, 2000; Askin and Raine, 2000; Prebble et al., 2006), Houben, 2012; Wilson et al., 2013), could have therefore suggesting a transition towards cooler tundra mosaic veg- facilitated the expansion of different vegetation types pre- etation at this time (e.g. Truswell and Macphail, 2009). viously suppressed by the dominance of Nothofagus. Fur- Furthermore, within the early Oligocene (∼ 33.5–32.2 Ma) thermore, a study by Galeotti et al. (2016), suggested that Zone II assemblage, the increase in Coptospora along with until ca. 32.2 Ma any Antarctic ice sheet would have been Stereisporites (Sphagnum), and some angiosperms such as extremely sensitive to orbitally paced, local insolation forc- Liliacidites and possibly Myricipites, likewise suggests the ing and would have been prone to large fluctuations. These progression towards colder environments. Coptospora and fluctuations in ice extent would have in turn resulted in envi- Liliacidites have been found in Oligocene and Miocene as- ronmental disturbance. Variability in ice volume during the semblages across Antarctica, including the Ross Sea region early Oligocene are also reflected by greatly varying ben- (e.g. Askin and Raine, 2000; Prebble et al., 2006), Meyer thic δ 18 O, confirming large fluxes in Antarctic ice during Desert Formation (e.g. Lewis et al., 2008), Wilkes Land (e.g. this time. Therefore, the unusual expansion of gymnosperms Sangiorgi et al., 2018), and the Antarctic Peninsula (e.g. and cryptogams seen at Site 696 is suggested to be related to Warny et al., 2011). These Oligocene–Miocene assemblages an increase in environmental disturbance caused by repeated have been inferred to represent tundra mosaic vegetation in glacial expansion and retreat, with the first major glacial ex- cold, possibly glacial, landscapes (Francis and Hill, 1996; pansion around 34.1 Ma, together with the competitive dom- Macphail and Truswell, 2004; Prebble et al., 2006). In ad- inance of podocarps on exposed disturbed sites (Fig. 6). dition, the presence of common millimetre-sized IRD be- A lack of evidence for marine reworking after the EOT tween approximately 564 and 560 m b.s.f. suggests phases of and good agreement between terrestrial biomarkers (López- continental ice expansion to coastal and possibly shelf ar- Quirós et al., 2021) and the fossil sporomorph record suggest eas (Barker et al., 1988; López-Quirós et al., 2021). Within that the changes in the terrestrial palynomorph assemblage this same interval, sporomorph-based climate reconstruc- during the early Oligocene (∼ 33.5 Ma) reflect true climate tions also reveal a cooling and drying step, with a decrease signals and increased environmental disturbance caused by in MAT and MAP from around 12.7 to 10.5 ◦ C and 1895 glacial onset. Moreover, the results of this study reveal that to 1471 mm, between ∼ 33.5 and 33.4 Ma. The initially rel- major changes in terrestrial vegetation took place after the atively high temperatures during the earliest Oligocene may onset of glaciation rather than after terrestrial climate cool- be associated with the reported return to near-Eocene climate ing that took place during the latest Eocene after 35.5 Ma. soon after the EOT (Liu et al., 2009; Houben, 2012; Wilson et al., 2013) and is possibly also reflected in a shift in some 5.3 Palaeoceanography organic matter indices across the EOT and after the EOIS (Fig. 5; López-Quirós et al., 2021). However, further inter- Concurrent to terrestrial cooling at 35.5 Ma, indicated by pretation of this sediment section is hampered by a gap in the loss of thermophilic taxa and a decrease in sporomorph- core recovery. The increase in typical tundra taxa together based MAT estimates, dramatic changes to marine environ- with common IRD indicates a potential phase of cooling ments at Site 696 are signalled by the appearance of glau- and glacial expansion during the earliest Oligocene, possi- conitic packstone (∼ 588.8 to 577.9 m b.s.f.; López-Quirós bly punctuated by the development of milder climates (e.g. et al., 2019). The formation of this mature glaucony-bearing Liu et al., 2009; Houben, 2012; Wilson et al., 2013). facies is suggested to be related to a decrease in the de- Warming and cooling phases with episodes of ice growth livery of terrigenous sediments to Site 696 and suboxic re- and retreat would have caused environmental disturbance, ducing conditions at the sediment–water interface (López- likely reducing the extent of Eocene Nothofagus-dominated Quirós et al., 2019, 2021). This change in oceanic environ- forested. In New Zealand modern Nothofagus seedlings are mental conditions may be explained by the opening of the able to capitalize on small canopy openings enabling them proto-Powell Basin and changes to ocean currents, with sev- to out-compete podocarps in old-growth stands (Lusk et eral studies (e.g. Lawver and Gahagan, 1998; Eagles and Liv- Clim. Past, 18, 209–232, 2022 https://doi.org/10.5194/cp-18-209-2022
You can also read


