Advanced Nuclear Reactor Systems and Future Energy Market Needs - Nuclear Technology Development and Economics 2021
←
→
Page content transcription
If your browser does not render page correctly, please read the page content below
Nuclear Technology Development and Economics
2021

                        Advanced Nuclear
                        Reactor Systems
                        and Future Energy
                        Market Needs

                                               NE A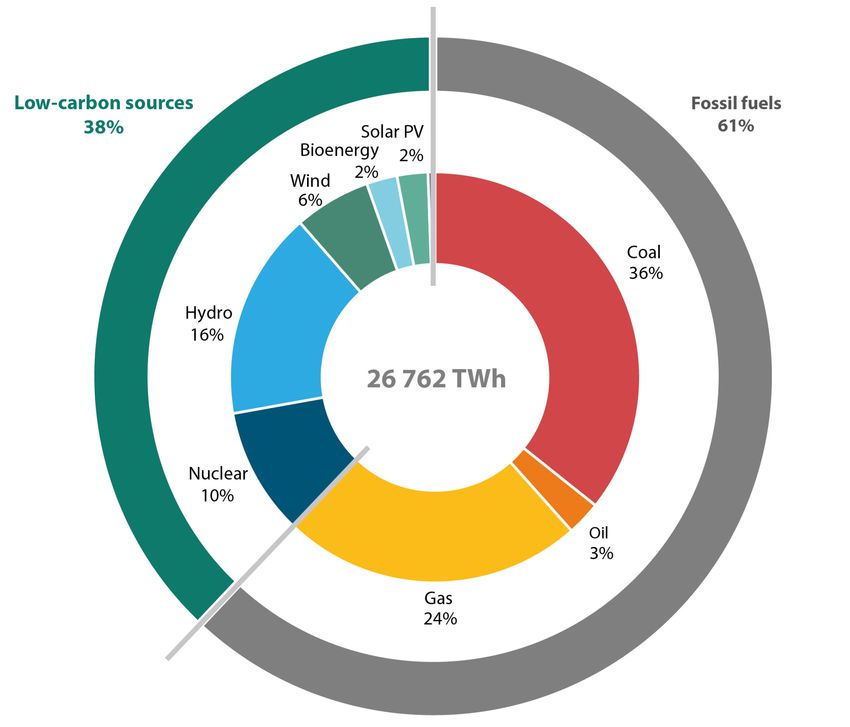
Nuclear Technology Development and Economics

            Advanced Nuclear Reactor Systems
             and Future Energy Market Needs

                                  © OECD 2021
                                  NEA No. 7566

                          NUCLEAR ENERGY AGENCY
         ORGANISATION FOR ECONOMIC CO-OPERATION AND DEVELOPMENT
ORGANISATION FOR ECONOMIC CO-OPERATION AND DEVELOPMENT

The OECD is a unique forum where the governments of 38 democracies work together to address the economic,
social and environmental challenges of globalisation. The OECD is also at the forefront of efforts to understand
and to help governments respond to new developments and concerns, such as corporate governance, the
information economy and the challenges of an ageing population. The Organisation provides a setting where
governments can compare policy experiences, seek answers to common problems, identify good practice and
work to co-ordinate domestic and international policies.
      The OECD member countries are: Australia, Austria, Belgium, Canada, Chile, Colombia, Costa Rica, the
Czech Republic, Denmark, Estonia, Finland, France, Germany, Greece, Hungary, Iceland, Ireland, Israel, Italy,
Japan, Korea, Latvia, Lithuania, Luxembourg, Mexico, the Netherlands, New Zealand, Norway, Poland, Portugal,
the Slovak Republic, Slovenia, Spain, Sweden, Switzerland, Turkey, the United Kingdom and the United States.
The European Commission takes part in the work of the OECD.
     OECD Publishing disseminates widely the results of the Organisation’s statistics gathering and research
on economic, social and environmental issues, as well as the conventions, guidelines and standards agreed by
its members.

   This work is published under the responsibility of the Secretary-General of the OECD. The opinions expressed and
   arguments employed herein do not necessarily reflect the official views of the member countries of the OECD or its
   Nuclear Energy Agency.

                                              NUCLEAR ENERGY AGENCY

     The OECD Nuclear Energy Agency (NEA) was established on 1 February 1958. Current NEA membership
consists of 34 countries: Argentina, Australia, Austria, Belgium, Bulgaria, Canada, the Czech Republic,
Denmark, Finland, France, Germany, Greece, Hungary, Iceland, Ireland, Italy, Japan, Korea, Luxembourg,
Mexico, the Netherlands, Norway, Poland, Portugal, Romania, Russia, the Slovak Republic, Slovenia, Spain,
Sweden, Switzerland, Turkey, the United Kingdom and the United States. The European Commission and the
International Atomic Energy Agency also take part in the work of the Agency.
       The mission of the NEA is:
       –   to assist its member countries in maintaining and further developing, through international
           co-operation, the scientific, technological and legal bases required for a safe, environmentally sound
           and economical use of nuclear energy for peaceful purposes;
       –   to provide authoritative assessments and to forge common understandings on key issues as input to
           government decisions on nuclear energy policy and to broader OECD analyses in areas such as energy
           and the sustainable development of low-carbon economies.
     Specific areas of competence of the NEA include the safety and regulation of nuclear activities,
radioactive waste management and decommissioning, radiological protection, nuclear science, economic and
technical analyses of the nuclear fuel cycle, nuclear law and liability, and public information. The NEA Data
Bank provides nuclear data and computer program services for participating countries.

This document, as well as any data and map included herein, are without prejudice to the status of or sovereignty over any territory, to
the delimitation of international frontiers and boundaries and to the name of any territory, city or area.
Corrigenda to OECD publications may be found online at: www.oecd.org/about/publishing/corrigenda.htm.

© OECD 2021
You can copy, download or print OECD content for your own use, and you can include excerpts from OECD publications, databases and
multimedia products in your own documents, presentations, blogs, websites and teaching materials, provided that suitable
acknowledgement of the OECD as source and copyright owner is given. All requests for public or commercial use and translation rights
should be submitted to neapub@oecd-nea.org. Requests for permission to photocopy portions of this material for public or commercial use
shall be addressed directly to the Copyright Clearance Center (CCC) at info@copyright.com or the Centre français d'exploitation du droit de
copie (CFC) contact@cfcopies.com.
Cover photo: High voltage electric tower (Shutterstock, Pand P Studio); GTHTR300 (Japan Atomic Energy Agency; Yan, X. et al. (2005), “GTHTR300
design variants for production of electricity, hydrogen or both”, Proceedings of Third Information Exchange Meeting on Nuclear Production of
Hydrogen, Nuclear Science Committee, OECD Nuclear Energy Agency, Oarai, Japan, 5-7 October 2005).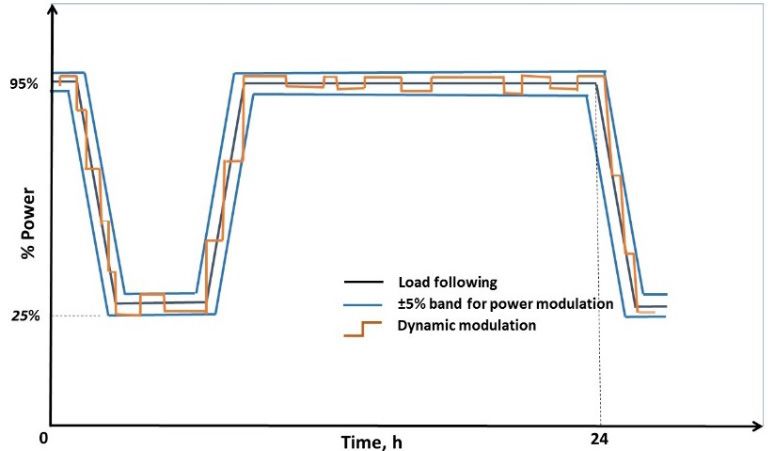
FOREWORD/ACKNOWLEDGEMENTS

                                                           Foreword

     Energy market needs are changing in the context of global efforts towards decarbonisation. The
     rapid increase of variable renewable energy sources in electricity systems has resulted in a
     commensurate increase in the needs or requirements for more flexible operation, for example
     through demands on the load-following capabilities of more conventional resources such as
     nuclear power plants. The development of energy storage capacities and demand smoothing
     could help to moderate these growing demands. Using nuclear power technologies for residential
     and industrial heat is another potential option that could contribute to further decarbonisation.
         Nuclear power plants have already contributed to load-following generation and to industrial
     and residential heat supply initiatives in some regions. In fact, several countries have decades of
     experience in load-following operations or cogeneration. More advanced generation III nuclear
     reactor designs have even greater flexibility than the previous generations of reactors in this
     regard, and the advanced nuclear reactor systems currently under development are expected to
     have even more preferential features such as inherent safety and the production of higher
     temperature heat. Small modular reactors are also of increasing interest for their potential
     advantages in terms of deployability and compatibility, as well as for their financial characteristics.
         Advanced Nuclear Reactor Systems and Future Energy Market Needs investigates the changing
     needs of energy markets, and the potential role of nuclear energy as a low-carbon energy source.
     Possible applications for advanced nuclear reactors under development today are examined in
     detail in the different chapters of this report, exploring to what extent these reactors can
     address future energy market needs.

                                                  Acknowledgements

     This report is a reflection of discussions that have taken place over a three-and-a-half-year
     period since July 2017, and over four meetings of the Nuclear Energy Agency (NEA) Expert Group
     on Advanced Reactor Systems and Future Energy Market Needs (ARFEM), chaired by
     Dr Aiden Peakman. The list of members of the ARFEM Expert Group can be found in the Annex
     of this report. Expert group members have participated in four meetings and two workshops
     with the advanced reactor stakeholder community, with representatives presenting relevant
     work in their individual countries. This report could not have been produced without their
     valuable contributions, or without the work of all of the many experts who helped to collect and
     assemble information for this report. The NEA would also like to express its sincere gratitude to
     the members of the NEA Committee for Technical and Economic Studies on Nuclear Energy
     Development and the Fuel Cycle (NDC) for their valuable comments.

ADVANCED NUCLEAR REACTOR SYSTEMS AND FUTURE ENERGY MARKET NEEDS, NEA No. 7566, © OECD 2021                          3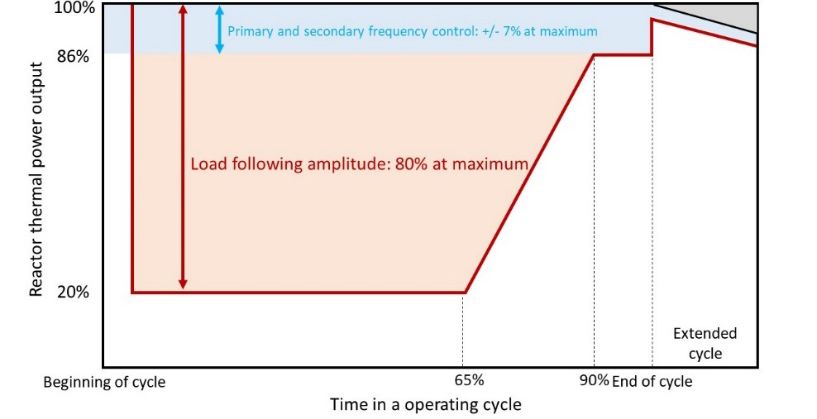
TABLE OF CONTENTS

                                                                Table of contents

     List of abbreviations and acronyms .................................................................................................... 7

     Executive summary ................................................................................................................................ 9
           Future market opportunities and requirements........................................................................... 9
           Policy recommendations ............................................................................................................... 10

     1. Introduction ....................................................................................................................................... 11
           References ........................................................................................................................................ 12

     2. Understanding future energy markets ......................................................................................... 13
           2.1 Electricity ................................................................................................................................... 13
           2.2 Heat ............................................................................................................................................. 30
           2.3 Hydrogen .................................................................................................................................... 33
           References ........................................................................................................................................ 36

     3. Overview of advanced reactor systems ........................................................................................ 41
           3.1 Features and development prospects .................................................................................... 42
           3.2 Opportunities and challenges ................................................................................................. 49
           References ........................................................................................................................................ 51

     4. Analysis of the flexibility of advanced reactor systems ............................................................ 55
           4.1 Flexibility .................................................................................................................................... 55
           4.2 Operational flexibility............................................................................................................... 56
           4.4 Product flexibility ...................................................................................................................... 62
           4.5 Summary .................................................................................................................................... 66
           References ........................................................................................................................................ 67

     5. Conclusions ....................................................................................................................................... 71
           5.1 Key findings ............................................................................................................................... 71
           5.2 Recommendations .................................................................................................................... 72
           References ........................................................................................................................................ 74

     Annex A: List of contributing experts ............................................................................................... 75

ADVANCED NUCLEAR REACTOR SYSTEMS AND FUTURE ENERGY MARKET NEEDS, NEA No. 7566, © OECD 2021                                                                             5
TABLE OF CONTENTS
List of figures
2.1.1: World annual electricity generation growth under three scenarios ............................ 13
2.1.2: World annual electricity generation by source in 2020 ................................................. 14
2.1.3: Evolution of power systems............................................................................................... 15
2.1.4: Changes in hourly demand during a two-week period in France ................................ 15
2.1.5: Steps in planning and scheduling to balance production and demand
in real time ........................................................................................................................... 16
2.1.6: Simplified schematic representation of hourly scheduling according to
ascending plant variable costs .......................................................................................... 16
2.1.7: Comparative life cycles lifecycles for greenhouse gas emissions from
electricity generation .......................................................................................................... 20
2.1.8: Comparison of energy storage systems by duration characteristics ........................... 21
2.1.9: Prices of battery packs in electric vehicles ...................................................................... 23
2.1.10: The growth of world energy consumption for space cooling in buildings .................. 27
2.1.11: Per capita Energy consumption for space cooling by country/region in 2016 ............ 28
2.1.12: Future increases of energy use by country/region ......................................................... 29
2.3.1: Outlook for hydrogen demand for energy applications ................................................. 33
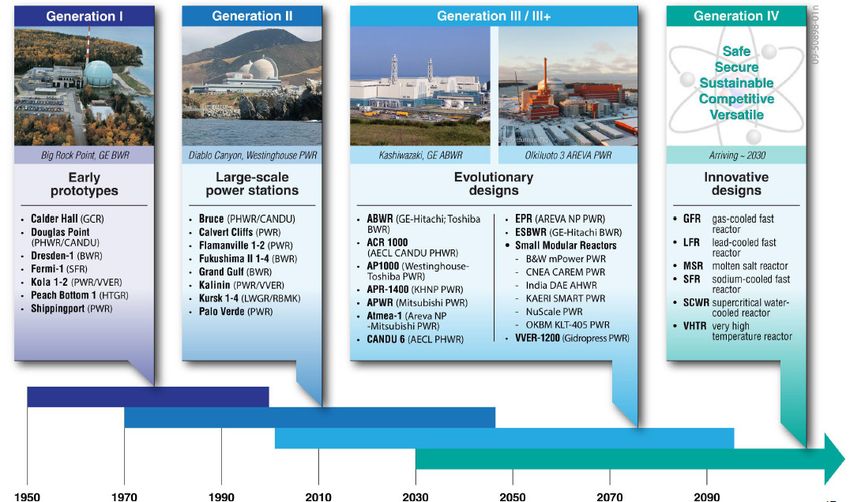
3.1.1: Nuclear evolution ................................................................................................................ 41
4.2.1: Typical daily power variation of a flexible reactor ......................................................... 58
4.2.2: Flexible operation of LWRs during the fuel cycle ........................................................... 59
List of tables
2.1.1: Needs for power system flexibility depending on VRE source integration ................. 18
2.1.2: Macro characteristics.......................................................................................................... 22
2.2.1: Global estimated process heat market size ..................................................................... 32
3.1.1: Examples of Gen III reactor Designs ................................................................................. 42
3.1.2: Temperature range of industrial heat demand and operational capability
of reactor systems ............................................................................................................... 47
List of boxes
1: A large blackout caused by a record heat wave in California in 2020............................. 19
2: Heat storage coupled with a nuclear power plant............................................................. 24
3: Cost-effective, flexible operation in France........................................................................ 60
6 ADVANCED NUCLEAR REACTOR SYSTEMS AND FUTURE ENERGY MARKET NEEDS, NEA No. 7566, © OECD 2021LIST OF ABBREVIATIONS AND ACRONYMS
List of abbreviations and acronyms
ARFEM Expert Group on Advanced Reactor Systems and Future Energy Market Needs (NEA)
ARS Advanced nuclear reactor system
BEV Battery electric vehicle
BNEF Bloomberg New Energy Finance
CAES Compressed air energy storage
CCUS Carbon capture, use and storage
CDF Core damage frequency
CO2 Carbon dioxide
CSP Concentrated solar power
DOE Department of Energy (United States)
EDF Électricité de France
EPRI Electrical Power Research Institute
EV Electric vehicle
FCEV Fuel cell electric vehicle
Gen-III/III+ Generation III and III+ (reactors)
Gen-IV Generation IV (reactors)
GFR Gas-cooled fast reactor
GHG Greenhouse gas
GIF Generation IV International Forum
HTR High-temperature reactor
HTTR High Temperature engineering Test Reactor
IAEA International Atomic Energy Agency
IEA International Energy Agency
JAEA Japan Atomic Energy Agency
ADVANCED NUCLEAR REACTOR SYSTEMS AND FUTURE ENERGY MARKET NEEDS, NEA No. 7566, © OECD 2021 7LIST OF ABBREVIATIONS AND ACRONYMS LFR Lead-cooled fast reactor LWR Light water reactor MSR Molten salt reactor NEA Nuclear Energy Agency NICE Future Nuclear Innovation: Clean Energy Future Initiative Initiative OECD Organisation for Economic Co-operation and Development PHS Pumped hydro storage Pref Rated power (reference power) PV Photo-voltaic PWR Pressurised water reactor R&D Research and development RD&D Research, development and deployment RES Renewable energy sources SCWR Supercritical water-cooled reactor SFR Sodium-cooled fast reactor SMR Small modular reactor VHTR Very high-temperature reactor VRE Variable renewable energy 8 ADVANCED NUCLEAR REACTOR SYSTEMS AND FUTURE ENERGY MARKET NEEDS, NEA No. 7566, © OECD 2021
EXECUTIVE SUMMARY

                                                  Executive summary

     The needs of energy markets are continuously changing in the context of the global movement
     towards a carbon neutral economy, increased liberalisation of energy markets and the
     development of various energy-related technologies. Electricity systems are also changing with
     increasing penetration of variable renewable energy sources, the enhancement of interconnection
     capacities and the development of storage technologies. Development of demand-side
     management technologies and changes in electricity consumption patterns affect not only
     electricity generation capacity needs but also the needs for reserve and frequency control
     capacities. In addition to their role in electricity systems, low-carbon energy sources can also help
     to unlock hard-to-abate sectors, such as heavy industry and transport, and various efforts are
     underway around the world to develop these alternative energy sources, including low-carbon
     heat supply and hydrogen production technology.
         Currently, various advanced nuclear reactor systems – evolutions of today’s generation III
     and III+ reactors, small modular reactors and generation IV reactors – are under development
     and are capable of offering more flexible options with respect to energy supply. In order to
     analyse how and to what extent these technologies will be able to address future energy market
     needs and conditions, as well as the possible environmental and regulatory constraints that
     might arise as a result of such technologies, the OECD Nuclear Energy Agency (NEA) established
     the Expert Group on Advanced Reactor Systems and Future Energy Market Needs (ARFEM). The
     expert group investigated the current situation and future prospects of energy market needs, as
     well as the characteristics and prospects in relation to the development of advanced reactor
     systems. It also identified several key factors that would help maximise the potential benefits
     of advanced reactor systems in future energy markets.

     Future market opportunities and requirements
     The needs for flexible power operation from power plants, which cover both shorter-term and
     longer-term flexibility, are growing as variable renewable sources are increasingly penetrating
     into electricity grids, with utilities in the United States and Europe recently issuing a new set of
     requirements regarding the flexibility of future light water reactors. 1 Current generation III/III+
     reactor technologies are already compliant with the latest grid operators’ requirements. Future
     advanced reactor system concepts, including small modular reactors and generation IV reactors,
     have different characteristics (advantages and challenges) for flexible operation, making it
     important for flexibility requirements to be taken into account by developers.
         The role of nuclear power in the electricity system may be more diverse than ever in future,
     depending on the regional characteristics of the system to which it belongs. While the increasing
     share of variable renewable energy sources could create further needs or requirements for
     flexible power operation, the development of electric vehicles, demand-side management and
     storage technologies could allow conventional plants such as nuclear power plants to operate at
     high-capacity factors, even under scenarios with significant variable renewable sources
     deployment. Advanced reactor systems are capable of providing not only firm capacity to help
     the electricity system ensure sufficient supply and system stability (e.g. inertia) but also to ensure
     manoeuvrability over a wide range of timescales, from very-short-term (frequency response) to
     seasonal dispatchability. Ultimately, the benefits that advanced reactor systems will provide to
     electricity systems will depend on their individual characteristics.

     1.   For further details, see Section 4.2.1 on manoeuvrability.

ADVANCED NUCLEAR REACTOR SYSTEMS AND FUTURE ENERGY MARKET NEEDS, NEA No. 7566, © OECD 2021                    9
EXECUTIVE SUMMARY
The heat sector, which accounted for about 50% of final energy consumption globally in
2018 and about 40% of energy related carbon dioxide (CO2) emissions, is another area where
advanced reactor systems can make a significant contribution to decarbonisation. Low-
temperature heat (INTRODUCTION
1. Introduction
With the adoption of the United Nations Sustainable Development Goals and the Paris
Agreement in 2015, many countries are making major efforts to decarbonise their economies.
The electricity sector is said to be the vanguard for decarbonisation because of the commercial
availability of a diverse suite of low-emission technologies. The average carbon intensity of
electricity improved by 10% between 2010 and 2018 as the result of efforts including energy
efficiency improvements and low-carbon technology deployment (IEA, 2019a). However, the
electricity sector is still the largest emitter of carbon dioxide (CO2), accounting for around 40%
of energy related CO2 emissions in 2020. CO2 emissions from the global electricity sector have
been increasing even as global deployment of low-carbon energy technologies have expanded,
largely because growth in demand has offset the gains associated with the reduced emission
intensity of grids (IEA, 2021).
Electricity systems across the world are rapidly changing, with an increasing share of
renewable or decentralised electricity sources such as solar photo-voltaic (PV) and wind power
plants (IEA, 2018). The high penetration of renewables has however led to considerable
challenges. The intermittent characteristics of renewable energy sources, for example, increase
the need for flexibility from other power supply sources, leading to questions about the
resiliency of the electric grid associated with variable supply and demand need scenarios. Under
these circumstances, the majority of advanced nuclear reactor systems (ARSs) under
development are taking into account such elements in order to provide the required support to
the grid. Conventional nuclear power plants, for their part, have recently been re-evaluated in
relation to their actual and/or potential contributions to grid stability through inertia and
frequency responses (EDF, 2018; Tielens, 2019).
In this context, the world nuclear community has been raising some important questions.
For example, what is the role of the advanced nuclear reactor system in the future electricity
system? How are current designs under development taking into account future energy market
considerations? What are the challenges, including with respect to flexibility, to be resolved in
order for nuclear power to fulfil its role in future electricity systems?
In addition to potential contributions to the electricity system, there is growing interest in
the diverse uses of nuclear energy for decarbonising the energy sector. Heat represents a
significant proportion of final energy consumption and CO2 emissions globally (IEA, 2019b).
Existing nuclear power plant technology has already proven that it can supply district heat, with
several countries having extensive experience in this sector, although the overall contribution of
nuclear energy to this sector is negligible to date (IAEA, 2017; IEA, 2014). Hydrogen is considered
to have great potential for decarbonisation in various sectors, and particularly as an energy
carrier that can replace fossil fuels. Different means of low-carbon hydrogen production are
currently under development, including ones employing nuclear power (IEA, 2019c).
Given that the future potential of nuclear power extends beyond electricity systems to the
various energy sectors mentioned above, in May 2017, the Nuclear Energy Agency (NEA) created
the Expert Group on Advanced Reactor Systems and Future Energy Market Needs (ARFEM) to
analyse what the future energy market would look like. The ARFEM was tasked with examining
how and to what extent the technical features of ARSs, such as flexible operation and non-
electricity applications, could address future energy market needs. The expert group would also
examine external conditions, including regulations and policies. Apart from expert group
meetings, two NEA workshops were held in April 2017 and September 2019, with experts
attending from around the world. These experts represented industry (vendors, utilities),
research institutions, regulatory authorities, grid operators, energy analysts and economists.
ADVANCED NUCLEAR REACTOR SYSTEMS AND FUTURE ENERGY MARKET NEEDS, NEA No. 7566, © OECD 2021 11INTRODUCTION
Advanced Nuclear Reactor Systems and Future Energy Market Needs is the result of these
discussions. The report aims to provide non-technical readers with an understanding of the
overall characteristics and potential advantages of advanced nuclear reactor technologies under
development for the future energy system. It is divided into the following chapters:
• Chapter 2: Understanding future energy markets, including the electricity system, non-
electric market and energy storage.
• Chapter 3: Overview of advanced reactor systems, including generation III and III+
reactors, small modular reactors, and generation IV reactors.
• Chapter 4: Analysis of the flexibility of advanced reactor system, exploring flexible
operations that include load following and frequency control, flexible deployment such
as scalability and siting, and flexible products, including non-electric applications.
• Chapter 5: Conclusions, including key findings and recommendations for future actions.
References
Feutry, S. (2018), “Flexible nuclear and renewables alliance for low carbon electricity generation”,
EDF (presented at the NEA Expert Group on Advanced Reactor Systems and Future Energy
Market Needs on 18-19 July 2018).
IAEA (2017), Opportunities for Cogeneration with Nuclear Energy, IAEA Nuclear Energy Series No. NP-
T-4.1, International Atomic Energy Agency, Vienna.
IEA (2021), World Energy Outlook 2021, International Energy Agency, Paris.
IEA (2019a), Global Energy & CO2 Status Report: The latest trends in energy and emissions in 2018,
International Energy Agency, Paris.
IEA (2019b), Renewables 2019 Analysis and forecast to 2024, International Energy Agency, Paris.
IEA (2019c), The Future of Hydrogen, International Energy Agency, Paris.
IEA (2018), Status of Power System Transformation 2018: Power system flexibility, International Energy
Agency, Paris.
IEA (2014), Heating Without Global Warming: Market Developments and Policy Considerations for
Renewable Heat, International Energy Agency, Paris.
Sadhankar, R. (2019), “Position paper on flexibility of Gen IV systems”, Economic Modelling
Working Group, Generation IV International Forum.
Tielens, P. (2019), “Operation and control of power systems with reduced synchronous inertia”,
(presented at the NEA Workshop Electricity system (r)evolution: What role for baseload and
dispatchable technologies, 4 September 2019). www.oecd-nea.org/jcms/pl_31059/workshop-
esr-4-operation-and-control-of-power-systems-with-reduced-synchronous-inertia.
12 ADVANCED NUCLEAR REACTOR SYSTEMS AND FUTURE ENERGY MARKET NEEDS, NEA No. 7566, © OECD 2021UNDERSTANDING FUTURE ENERGY MARKETS
2. Understanding future energy markets
This chapter provides an overview of the current situation and future prospects for energy
market needs, more specifically in relation to electricity and heat markets, which the NEA
Expert Group on Advanced Reactor Systems and Future Energy Market Needs (ARFEM) found to
be the most relevant markets where advanced nuclear reactor systems (ARSs) could participate
in the future. The potential of hydrogen as a future energy carrier that can be produced by either
electricity or process heat is also discussed.
2.1 Electricity
Electricity consumption has been increasing steadily around the world, and this trend is expected
to continue in the future (see Figure 2.1.1). Recent years have seen a remarkable increase in this
consumption in non-OECD countries as global access to electricity increases alongside new uses,
such as transport and digital technologies. Worldwide, electricity generation represented
26 762 terawatt hours (TWh) in 2020, with almost two-thirds produced from fossil fuels, 10% from
nuclear, 16% from hydro, 3% from biomass and 9% from wind and solar (see Figure 2.1.2),
accounting for around 20% of total energy consumption and 40% of global energy related carbon
dioxide (CO2) emissions (IEA, 2021).
Figure 2.1.1: World annual electricity generation growth under three scenarios
Stated policies scenario
Sustainable developmemt scenario
60,000
Annual electricity generation (TWh)
50,000
40,000
30,000
20,000
10,000
2000 2010 2020 2030 2040 2050
Year
Note: The stated policies scenario considers current and planned policies, including nationally determined
commitments under the Paris Agreement on climate change. The sustainable development scenario is aligned with
the Paris Agreement and the goals of providing energy access to all while ensuring cleaner air, which involves sharp
cuts in emissions across all sectors to limit the global temperature rise below 2ºC.
Source: IEA (2021), World Energy Outlook 2021.
ADVANCED NUCLEAR REACTOR SYSTEMS AND FUTURE ENERGY MARKET NEEDS, NEA No. 7566, © OECD 2021 13UNDERSTANDING FUTURE ENERGY MARKETS
Figure 2.1.2: World annual electricity generation by source in 2020
Source: IEA (2021), World Energy Outlook 2021.
2.1.1 Today’s power system
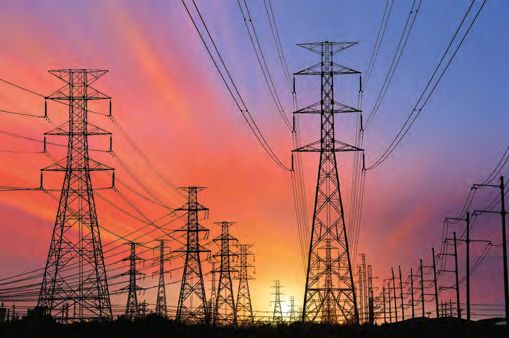
As shown in Figure 2.1.3, a power system is a complex system composed of three main
components: power generators, networks (transmission and distribution) and consumers, with
the overarching goal of delivering electricity to consumers in real time. The left side of Figure 2.1.3
demonstrates how power systems have traditionally worked (also see Section 2.1.2), and the right
side explains how power systems are changing.
In power systems, most power plants are generally centralised, dispatchable 1 units with a
sizeable production connected directly to high-voltage transmission lines, as is the case for coal,
gas, nuclear or hydro power plants. These plants use fuel to produce electricity, and that fuel acts
as a large, long-term storage that contributes to the resilience 2 of the system. Electricity in plants
is produced through a synchronous, rotating alternator that contributes to the stability of the
system. As a result of public policies and a sharp drop in the cost of solar panels and wind farms,
these energy sources are developing rapidly in power systems. Such technologies differ from
previous power plants in several ways. Their fuel (i.e. wind and solar radiation) cannot be directly
stored. They are connected either to the distribution or the transmission networks through power
electronics and are not able to provide the same inertia 3 response as synchronous generators in
the case of a system disturbance.
1. A dispatchable plant is a plant that has a predictable production and can adjust its production to the
needs of the power system operator.
2. Resilience describes the property of a power system that is able to cope with most uncertainties so as
to deliver power with a good level of quality and with very few hours of loss of load.
3. Inertia refers to the tendency to remain unchanged. Inertia provides the ability to autonomously
moderate frequency changes in power systems.
14 ADVANCED NUCLEAR REACTOR SYSTEMS AND FUTURE ENERGY MARKET NEEDS, NEA No. 7566, © OECD 2021UNDERSTANDING FUTURE ENERGY MARKETS
Figure 2.1.3: Evolution of power systems
Power generation is linked to end consumers through a network consisting of several levels.
When applicable, a transmission, high voltage network meshes a country or a balancing zone
with interconnections to neighbouring zones. The distribution network then lowers the voltage
and delivers the power to the consumer in a tree-like network. The use of a large-scale network
increases the resilience of the system as well as the quality of the service and ensures cost
optimisation, making room for baseload plants and thereby reducing the overall price paid by
consumers.
Throughout the day, consumers use electricity for very diverse needs, and overall
consumption fluctuates greatly. It also varies between workdays, weekends and holidays, as
well as between seasons in most areas of the world, depending on climate and heating or
cooling needs as shown in Figure 2.1.4. Power production must nonetheless match the demand
in real time since electricity cannot be stored by the grid. In other words, the energy injected by
production needs to be immediately withdrawn by consumers.
Figure 2.1.4: Changes in hourly demand during a two-week period in France
Day
90
80 28.5 GW
70
Hourly demand (GW)
60
50
40
Night
30
Weekend Weekend
20
10
0
Mon Tues Wed Thurs Fri Sat Sun Mon Tues Wed Thurs Fri Sat Sun
Source: RTE eCO2Mix (2016), www.rte-france.com/eco2mix.
ADVANCED NUCLEAR REACTOR SYSTEMS AND FUTURE ENERGY MARKET NEEDS, NEA No. 7566, © OECD 2021 15UNDERSTANDING FUTURE ENERGY MARKETS
Achieving a real-time balance of supply and demand needs to be anticipated many years in
advance to the planning of investment to ensure that enough generation capacity is available,
as well as network reinforcements, such as increases in transmission capacity or in grid density
and grid interconnections. A few months ahead of time, plant maintenance, as well as fuel
procurement and reloading, is planned to ensure availability when needed. A day ahead of real
time, several iterations of successive scheduling of production are made to match plant
generation with increasingly finer predictions of demand, taking into consideration the
increasingly accurate forecasted generation for wind and solar generation, as depicted in
Figure 2.1.5. The scheduling is carried out taking into account ascending plant variable costs,4
which differ widely depending on technologies, so as to minimise the final price of electricity
as shown in Figure 2.1.6. The last step of the scheduling process is carried out in real time with
reserves ensuring a balance of production and demand.
Figure 2.1.5: Steps in planning and scheduling to balance
production and demand in real time
Planning of Scheduling of Scheduling of Scheduling of
Real-time
generation and generation generation generation
balancing
network capacity (long term) (day ahead) (intra-day)
Years ahead A few months ahead ~ Day ahead to within the day Minutes to seconds
Investment decisions are Generation/maintenance Generation schedule is adjusted Real-time balancing of
made for securing schedule is developed successively as the projected electricity generation and
generation and network considering seasonal demand and reserves become more demand is carried out
capacity. variation of demand. accurate. by deploying reserves.
Figure 2.1.6: Simplified schematic representation of hourly scheduling
according to ascending plant variable costs
Variable cost
EUR/MWh
Marginal
cost
Oil
Nuclear Coal Gas
Solar Available generation
Wind Biomass Demand (GW)
Hydro
Notes: The marginal cost for the power system is the cost associated with producing an additional megawatt hour (MWh).
4. Variable costs include fuel costs, as well as operation and maintenance costs. They do not include fixed
costs, such as capital (investments) costs.
16 ADVANCED NUCLEAR REACTOR SYSTEMS AND FUTURE ENERGY MARKET NEEDS, NEA No. 7566, © OECD 2021UNDERSTANDING FUTURE ENERGY MARKETS
2.1.2 Tomorrow’s power system
In 2020 electricity represented 20% of final energy consumption (IEA, 2021). This share has been
growing steadily and is set to continue growing in the future with more people getting access to
electricity in non-OECD countries. New uses of electricity worldwide will also contribute to this
increasing share. These new uses of electricity will include electric vehicles, heat pumps for
heating and cooling and green hydrogen obtained through electrolysis, for example, using
decarbonised sources of electricity. The electricity sector is at the forefront of ongoing
decarbonisation efforts to migrate the energy sector from fossil-fuel based to net zero emissions.
Low-carbon technologies to produce electricity are indeed readily available today: renewable
energies (hydro, biomass, wind and solar) and nuclear energy. The share of electricity could
therefore reach upwards of 50% of final energy consumption with fossil fuel usage ultimately
being replaced partially by electricity (IRENA, 2019).
2.1.2.1 Large-scale development of renewable energy sources and impacts on the power
system
A massive development of low-carbon electricity generation from variable renewable energy
(VRE) sources is currently underway in most of the world’s electricity systems and is largely
based on the development of hydro, wind and solar photo-voltaic (PV) energy sources. In OECD
countries, where hydro is already well exploited, deployment mainly relies on wind and PV
development (IEA, 2019a).
VRE generation is mostly decentralised and depends on atmospheric conditions controlling
the availability of their primary energy source (i.e. the wind and sun). Their generation can
therefore only be forecasted, adding new uncertainties and challenges for power systems.
Wind speeds and solar radiation highly depend on location. Generation at the farm level is
very irregular, but generation at a larger scale, such as by region or country, yields a smoother
profile. Adding a large share of intermittent VRE into the power system therefore requires a
simultaneous and co-ordinated development of transmission and distribution networks, or
reinforcements when necessary. Appropriate development of interconnections will make it
easier to find a balance between supply and demand, mainly via two means: 1) by allowing more
power to be transported from one area to another, and 2) by transforming the issue of managing
intermittency at the local distribution network level to handling variability at the level of the
interconnected system. This represents an incentive for the aggregation of VRE generation. At
the same time, self-supply is a trend that is currently being developed at the level of a building
or a neighbourhood in OECD countries where the scale of installations remains small (kilowatts
[kW] versus megawatts [MW] for large plants or farms). It is already the norm in countries where
the power network is not yet developed.
Aggregating VRE sources over large geographical areas (at a national or a continental level)
will allow grids to benefit from geographical diversity, with smart grids 5 further easing the
integration of VRE sources. Variability will nevertheless remain high due to both climate effects
and the correlation between wind and solar regimes across large geographical areas. With a
high share of VRE sources, the exposure of a network to climate conditions and their associated
uncertainties will increase significantly.
Large-scale simulations (Burtin and Silva, 2015) show that the traditional generation mix
must be adapted because integrating renewable energy yields a reduction of baseload
generation and an important increase in the peaking plants that are used as back up. New VRE
capacity does not replace conventional plants with a ratio of 1 to 1, as a result of both a low-
capacity factor and of the high dependence on atmospheric conditions for VRE sources. The
ratio is in fact closer to 1 to 7, i.e. 100 MW of conventional capacity is removed for 700 MW of
newly connected VRE sources – these results are based on the European grid, with 60% of VRE
sources and an additive of 100 MW of wind turbines.
5. Smart grid: the electricity network system that can control and optimise the flow of electricity from
both sides of supply and demand. It is often supported by digital technologies.
ADVANCED NUCLEAR REACTOR SYSTEMS AND FUTURE ENERGY MARKET NEEDS, NEA No. 7566, © OECD 2021 17UNDERSTANDING FUTURE ENERGY MARKETS
The power system will need to be generally more flexible with timescales depending on VRE
source integration as shown in Table 2.1.1 (IEA, 2017a, 2017b). For early phases, the system will
need to cope with flexibility on short timescales. Conventional plants are thus necessary to
achieve a balance of supply and demand at times when VRE sources cannot, and will be, asked
to be more flexible so as to adjust to an increasing net demand 6 variability. For later phases of
VRE penetration, the need for flexibility moves both to increasingly longer timescales (to meet
demand when the availability of wind and solar is low) and to shorter timescales (e.g. frequency
response and ramping). Because conventional plants with native, long-term storage and reserves
through fuel are being replaced by wind and solar, for which fuel cannot be stored, external
storage will become a requirement. The interface of VRE sources with power electronics displaces
system inertia and could create more frequent stability issues on the grid after a power
imbalance. To ensure adequate system inertia, new services like fast frequency response 7 and
kinetic energy supply 8 have become necessary. To a certain extent, storage and active demand
may also supplement generation so as to balance supply and demand. During the final stages of
VRE penetration, seasonal displacements of generation will become necessary, and low-carbon
generation, such as nuclear and hydro, as well as seasonal storage through synthetic fuels such
as hydrogen, permits a shift in the generation to times when VRE sources are not available.
During the VRE integration process, an optimisation of the pace of deployment will limit the costs
of storage or excessive curtailment.
Table 2.1.1: Needs for power system flexibility depending on VRE source integration
Phase 1 Phase 2 Phase 3 Phase 4 Phase 5 Phase 6
No relevant Impact on net Flexibility Short-term Demand Seasonal
impact load key stability problems shifting storage
Ultra-short-term
flexibility (seconds)
Short-term flexibility
(minutes to hours)
Typically, no Medium-term flexibility
system
(hours to days)
flexibility issues
Long-term flexibility
(days to months)
Very long-term flexibility
(months to years)
India, Mexico Australia, Greece, Ireland, Denmark.
People’s Republic Germany, Italy, South Australia.
of China, Japan, Portugal, Spain,
United States. Sweden, United
Kingdom.
California, Texas
(United States).
Source: IEA (2017a), Getting Wind and Sun onto the Grid: A Manual for Policy Makers. IEA (2017b), Renewables 2017: Analysis and
Forecasts to 2022.
The 2020 heatwave in California highlights some of the difficulties that power systems may
encounter in the transition to higher shares of renewables (see Box 1). The need for a global
increase in the flexibility of the power system calls for adequate market designs and investment
frameworks to ensure that power plants, grids, energy storage and new services, such as
demand response, can meet evolving power system requirements.
6. Net demand: total demand minus VRE production.
7. Fast frequency response: the technology that prevents frequency interference in the power grid by
injecting power, or reducing the load in less than a minute in response to a system frequency
disturbance. It is often equipped with large-scale batteries.
8. Kinetic energy supply: the technology that provides power grids with inertia to absorb fluctuations in
power supply and demand and stabilise the frequency, for example through flywheels.
18 ADVANCED NUCLEAR REACTOR SYSTEMS AND FUTURE ENERGY MARKET NEEDS, NEA No. 7566, © OECD 2021UNDERSTANDING FUTURE ENERGY MARKETS
Box 1: A large blackout caused by a record
heat wave in California in 2020
California has set ambitious renewable energy targets, and renewable installed capacities have increased
sharply in between 2009 and 2019 as seen in Figure B.1.1 below, reaching 13 GW of solar and 6 GW of wind in
2019. In 2019, renewables represented 49% of the total in-state power generation, with 21% from wind and
solar, while Figure B.1.1 shows that the total in-state power generation has remained fairly constant since
2001. At the same time, California relies heavily on imports from neighbouring states, from the northwest and
the southwest, for about a third of its power consumption.
Figure B.1.1: California in-state installed capacity (GW) and
electricity generation (TWh) from 2001 to 2019
100
Hydro Other RES Solar Wind Nuclear Fossil Fuel
California installed capacity
80
60
(GW)
40
20
0
2001 2002 2003 2004 2005 2006 2007 2008 2009 2010 2011 2012 2013 2014 2015 2016 2017 2018 2019
250
California in-state power
generation (TWh)
200
150
100
50
0
2001 2002 2003 2004 2005 2006 2007 2008 2009 2010 2011 2012 2013 2014 2015 2016 2017 2018 2019
Source: California Energy Commission.
California experienced a record heatwave between 14 and 19 August 2020, increasing the demand for air-
conditioning. The power demand was therefore higher than usual as temperatures soared across the west. In
addition, the stay-in-place order in effect in California at the time, because of the COVID-19 pandemic, further
increased demand. However, the supply could not safely match demand, and several independent events led
the Californian Independent System Operator to activate rolling blackouts, leaving hundreds of thousands of
California homes and businesses in the dark. The lack of solar generation at night, an abrupt loss of 1 GW of
wind, low hydro resources because of the drought and the low snow cover of the previous year all combined
with outages on gas power plants and limited availability of import volumes from neighbouring states that
needed to supply the higher demand in their own states. Californians were also asked to reduce their power
demand so as to minimise the need for further blackouts. A stage-3 emergency had to be issued on Saturday,
15 August at 6:28 p.m. and lifted at 6:48 p.m. when wind generation picked up again. A stage-3 emergency
means that the system operator is unable to meet the minimum contingency reserve requirements, and a loss
of power is either imminent or already in progress. During the different episodes, deficits in generation were
significant. The shortfall was of roughly 1 000 MW on Friday, 500 MW on 15 August and 4 400 MW on the
afternoon of 17 August 2020. The system operator had been warning that shortfalls would be imminent
following the decommissioning of conventional power plants, including gas thermal and nuclear power plants
in California. After the blackout event, plans to shut down high-carbon emitting power plants in southern
California, scheduled for the end of the year, were postponed to minimise the impact associated with the
further loss of conventional power plants.
This episode highlights the additional challenges that variable renewable energies introduce in terms of
management of the power system. It also demonstrates the important role that dispatchable plants (nuclear,
hydro, thermal) have to play in ensuring the overall safety of the power system.
ADVANCED NUCLEAR REACTOR SYSTEMS AND FUTURE ENERGY MARKET NEEDS, NEA No. 7566, © OECD 2021 19UNDERSTANDING FUTURE ENERGY MARKETS
2.1.2.2 Towards the goal of decarbonisation
CO2 is a greenhouse gas (GHG) that contributes to the increase in global temperature, and
sharply lowering CO2 emissions is essential to hold this temperature increase to below 2°C, as
stipulated in the Paris Agreement, or even to under 1.5°C in order to limit the ill-effects on large
populations in exposed areas. Europe, for example, is targeting a carbon-neutral power sector
by 2050, with a patchwork of starting points for each country depending on local resources and
political choices. Some countries have large natural resources, such as hydro or biomass, and
others rely on nuclear power plants that result in a much lower level of carbon emissions in
their power system compared to other countries. The contributions of these different
generation sources are shown in Figure 2.1.7. However, worldwide CO2 emissions continue to
steadily rise, and energy related emissions are hitting record high levels, led by coal power
generation in Asia. Coal is the largest source of emissions worldwide and is associated with one-
third of global warming to date (IEA, 2021).
Figure 2.1.7: Comparative life cycles lifecycles for greenhouse
gas emissions from electricity generation
Lifecycle emission intensity of electricity [gCO2eq/kWh]
400 600 800 1 000
Currently commercially available technologies 0 200
Coal (pulverised coal)
Gas (combined cycle)
Biomass (cofiring1,3)
Biomass (dedicated2,3)
Geothermal 2 200
Hydro4
Nuclear
Concentrated solar power
Solar PV - rooftop
Solar PV - utility
Wind - onshore
Wind - offshore
Pre-commercial technologies
CCS - coal (oxyfuel) 25th percentile 75th percentile
CCS - coal (pulverised coal)
Minimum Median Maximum
CCS – coal - IGCC*
CCS –Gas (combined cycle)
Ocean (wave & tidal)
1) Assuming biomass feedstocks are dedicated energy plants and crop residues and 80-95% coal input. 2) Assuming feedstocks are dedicated
energy plants and crop residues. 3) LifecycleLife cycle emissions include albedo effect. 4) Emissions of about 2 000 gCO2eq/kWh come from
a few reservoirs with a large area in relation to electricity production and low power intensity. * Integrated coal gasification combined cycle.
Source: Reproduced from IPCC (2014), Climate Change 2014: Mitigation of Climate Change. Figure 7.7 (p. 541, 542), by extracting
information related to life cycle emission intensity and adjusting the appearance.
Renewable energies are being introduced massively in the power system as a way to lower
CO2 emissions from the power sector. This solution benefits existing power systems with high
levels of CO2 emissions, but not those with already low CO2 emissions. Evidence provided in
large scale-simulations (Burtin and Silva, 2015; Tapia-Ahumada et al., 2019) has confirmed that
the high penetrations of VRE sources in sufficiently interconnected networks will permit
significant reductions in CO2 emissions, and that a very low emission factor could only be
achieved with a mix combining VRE sources with carbon-free firm capacity plants.
20 ADVANCED NUCLEAR REACTOR SYSTEMS AND FUTURE ENERGY MARKET NEEDS, NEA No. 7566, © OECD 2021UNDERSTANDING FUTURE ENERGY MARKETS
In terms of economic impacts, the increasing share of VRE sources on the grid could increase
the cost of electricity for consumers. An NEA report examining the full costs of electricity (NEA,
2018) concluded that the grid-level system costs associated with VRE generation are large and
increase with the penetration level of VRE sources. In comparison, the system costs of
dispatchable technologies, such as nuclear power, are at least one order of magnitude lower.
A later NEA study on the costs of decarbonisation (NEA, 2019) assessed the costs of low-carbon
electricity systems capable of achieving strict carbon emission reductions to 50 g of CO2 per kWh
with different shares of renewable and nuclear sources. The study shows that the system costs of
electricity provision increase with a greater share of VRE sources in the electricity mix.
In addition to the existing electricity grids, there will be a growing need to decarbonise
remote and off-grid energy applications, such as remote mining operations and remote
communities. Micro modular reactors, which are certain types of advanced nuclear reactors
with small output of up to 20 MWe, have been proposed for remote applications and are being
pursued by some developers (NEA 2021).
It is evident from the above studies that the two pillars for decarbonisation of the power
system are renewables along with low-carbon, dispatchable energy sources. A mix of solutions
can provide the necessary additional flexibility through demand response, storage at different
scales, including long-term seasonal storage (see Table 2.1.1), power-to-X, 9 and carbon capture,
use and storage (CCUS). Nuclear energy can therefore provide an important contribution
towards a power system with very low levels of CO2 emissions (FTI-CL ENERGY, 2018), in
particular in countries with no or very limited hydro resources. In the short term, nuclear power
keeps CO2 emissions low and avoids locking in fossil fuel investments. In the long term, it
provides carbon-free, flexible electricity (see Sections 3.1.1, 3.1.2, and 4.2.1).
2.1.3 Energy storage
This section provides an overview of power storage technologies and costs, as well as their uses.
Figure 2.1.8 and Table 2.1.2 compare the key attributes of different storage technologies.
Figure 2.1.8 shows that the range of services provided by electricity storage have different time
horizons, and therefore different applications, i.e. frequency control, congestion management,
peak shaving 10 and load shifting.
Figure 2.1.8: Comparison of energy storage systems by duration characteristicsUNDERSTANDING FUTURE ENERGY MARKETS
Table 2.1.2: Macro characteristics
Round-trip Timescale of Power capital Energy capital
Type of storage Maturity
efficiency storage cost (USD/kW) cost (USD/kWh)
30%-40% power
Hydrogen Hours to weeks Med-high Low Medium
to power
Pumped storage 75-80% Hours to days Medium Low High
Lithium-ion 1 hour to
~85% Med Med Med-high
battery 4 hours
Redox flow
~70% ~10 hours Med-high Low-med Medium
battery
Flywheel 90% ~1 minute Low Med-high High
There are several technologies well-suited to electricity storage, namely:
• Pumped hydro storage (PHS)
PHS was one of the most common storage methods in service until 2012, contributing more
than 90% of current storage capacity (Luo, et al., 2015). The role of PHS is to provide daily
and weekly load following capability in order to maintain balance between supply and
demand, as well as to provide reserves for the power system. Pumped storage is already
widely deployed in many countries, but it is likely to prove difficult to develop new sites
since most of the suitable geological sites have already been exploited.
• Flywheels
Flywheels are mechanical devices that can store energy in the form of rotational kinetic
energy. They are generally considered to offer very limited storage capacity but are a mature
and well-established technology. While the storage capacity of flywheels is limited, they
have been successfully deployed as a means to minimise fluctuations associated with PV
farms, and they act as a small buffer during cloud cover.
• Compressed Air Energy Storage (CAES)
CAES has received considerable attention historically, but it has been superseded by the
technologies listed in Table 2.1.2. It is generally seen to offer storage for relatively short
timescales and has few secondary service benefits. The relatively low efficiency of CAES and
high operation and maintenance costs are significant drawbacks.
• Hydrogen
Hydrogen storage is currently the only means to offer storage capacity to cover changes in
energy demand over relatively long periods of time (i.e. weeks). Hydrogen storage is
considered relatively mature given the current commercial demands and some deployment
in early trials of refuelling stations.
• Lithium-ion batteries
One of the first impacts of the integration of variable renewable energy sources has been
the need for short-term flexibility. In scenarios with far higher deployment rates of VRE
sources, essentially replacing conventional power plants, long-term storage needs have
become a critical technology. Lithium-ion batteries working on short timescales are
therefore increasingly being deployed to provide frequency response, guaranteeing system
stability. Their price also has significantly decreased in recent years (see Figure 2.1.9).
As Figure.2.1.9 demonstrates, the mass production of large batteries for electric vehicles
(EVs) – with the datasets for large-scale mass production relating to batteries from Tesla and
Nissan electric vehicles – has resulted in a large initial gain, with battery costs dropping by
around 60% (from around USD 1 200/kWh to USD 500/kWh). It is important to place realistic
22 ADVANCED NUCLEAR REACTOR SYSTEMS AND FUTURE ENERGY MARKET NEEDS, NEA No. 7566, © OECD 2021You can also read