Advice on Water Reform Opt-Out - Report to Whangārei District Council - Whangarei District Council
←
→
Page content transcription
If your browser does not render page correctly, please read the page content below

Advice on Water Reform
Opt-Out

Report to Whangārei District Council

AUGUST 2021

Copyright Castalia Limited. All rights reserved. Castalia is not liable for any loss caused by reliance on this document.
Castalia is a part of the worldwide Castalia Advisory Group.
CONFIDENTIAL

Table of contents
Executive summary                                                                                   5
1    Introduction                                                                                  10
2    Government’s Reform Scenario produces implausible household bill estimates                    10
           2.1    Required investment estimate is overstated                                       10
                  2.1.1      WICS approach to estimating required investment is unsound            11
                  2.1.2      Required investment level is based on inappropriate Scottish
                             comparators                                                           13
                  2.1.3      WICS’ required investment estimate is much higher than WDC’s
                             investment plans                                                      16
           2.2    Efficiency estimates for Reform Scenario are implausible                         17
                  2.2.1      Capex efficiency estimates are implausible                            17
                  2.2.2      Opex efficiency estimates are implausible                             21
           2.3    WICS analytical approach has other methodological flaws                          24
3          WDC’s Opt-Out household bills are likely to be much lower than government
           estimates                                                                               26
           3.1    WICS overlooks WDC’s current high relative performance                           26
           3.2    Improved regulatory regimes will incentivise improved performance by
                  WDC                                                                              27
                  3.2.1      Water quality regulation will likely lead to improved
                             performance by WDC                                                    27
                  3.2.2      Possible improvements from economic regulation regime have
                             been overlooked                                                       28
                  3.2.3      WDC management and operational competence likely to
                             improve with competition between entities for staff                   30
           3.3    WDC can increase access to finance to lower short-term costs                     30
4          WDC residents face risks and costs from Reform Scenario                                 32
           4.1    Local accountability for significant public asset and public service will be lost 32
           4.2    Local variability in service and quality levels will be lost                      32
           4.3    Loss of economies of scope increases average cost of remaining council
                  services by $1.9 million per annum                                                32
5          Recommended next steps                                                                  33

Tables
Table 2.1: WICS modelling approaches for required investment                                       12
Table 2.2: Urban population statistics of New Zealand and Scotland                                 16
Table 3.1: Average bill per household under different financing options for WDC in Opt-
            Out Scenario                                                                           30
Table 3.2: Average bill per household under different financing options for Reform
            Scenario                                                                               31

Castalia                                                                                             2
CONFIDENTIAL
Figures
Figure 0.1: Government’s predicted outcomes in Reform Scenario and Opt-Out
Scenario 6
Figure 0.2: Net investment scenarios for Whangārei under WICS models and WDC’s
own plan 7
Figure 0.3: Asset value per connected citizen for selected water utilities 8
Figure 2.1: New Zealand’s asset gap according to WICS 14
Figure 2.2: Asset value per connected citizen for selected water utilities 15
Figure 2.3: Total Net Investment scenarios 17
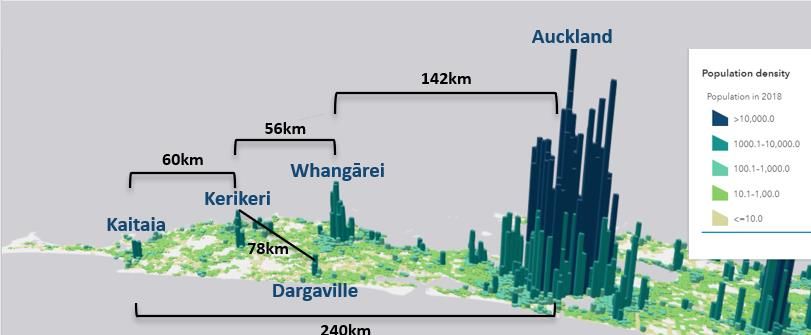
Figure 2.4: Major cities within the proposed Entity A and the distances between them 19
Figure 2.5: Population density (persons per square kilometre) in Scotland 19
Figure 2.6: WDC three waters operating expenditure breakdown 22
Figure 2.7: Operating expenditure cost per connected property 23
Figure 2.8: Impact of time-profile adjustment on new investment path under the
reform scenario 25
Castalia 3CONFIDENTIAL Definitions WDC Whangārei District Council WICS Water Industry Commission for Scotland RFI Request for Information DIA Department of Internal Affairs LGNZ Local Government New Zealand IPART Independent Pricing and Regulatory Tribunal Castalia 4
CONFIDENTIAL

Executive summary
The government is proposing to reform the drinking, waste and storm water (three waters)
sector. The reform will involve amalgamating the water services of the 67 local authorities into
four new regional statutory corporations, with centralised management and a new governance
structure. The structure will have indirect Board appointment rights for local authorities to be
shared with mana whenua representatives.
The government proposes to amalgamate Whangārei District Council (WDC) into a new
statutory corporation called “Entity A” together with the water services of Far North District
Council, Kaipara District Council and Watercare Services Limited (owned by Auckland Council)
(the Reform Scenario).
The government has given WDC two choices, join the Reform Scenario or Opt-Out. WDC, along
with other local authorities, has been asked by the government to consider the evidence and
whether the government’s proposal to reform the water sector will deliver benefits to its
residents. The government also committed to providing Whangārei with $38 million in funding
under the “better off” package, an additional $5 million for stranded overhead costs under the
“no worse off” package, and further compensation for any loss in WDC’s debt headroom.
These amounts are to be part-funded from the balance sheet of the new entity.
Key question: will the Reform Scenario deliver the claimed benefits?
The key question for this report is whether the benefits for WDC that are claimed by the
government are robust, and whether the Whangārei community is likely to be better off with
the Reform Scenario.
The Reform Scenario uses analysis provided by Water Industry Commission for Scotland
(WICS), the Scottish government’s regulator of its monopoly water provider Scottish Water.
The WICS analysis and modelling underpins the case for reform. The government has relied on
WICS for the claims that significant capital investment is needed in the New Zealand water
sector, and that amalgamation into four separate entities with accompanying institutional
changes is the only way to achieve the cost-efficiencies to make the reform affordable.
The government is promising that household bills will be four times lower in Reform Scenario than in
Opt-Out
The government is promising that the Reform Scenario will deliver household bills that are
more than four times lower than the bills that would exist in the Opt-Out Scenario. The
government claims that the Reform Scenario will deliver Whangārei residents:
    ▪ Household bills that average $803 by 2051
    ▪ Improvements in service delivery and affordability
    ▪ Improvement in the ability to raise finance
In contrast, the government’s WICS analysis claims that if WDC provides water services as an
opt-out provider, household bills will rise to $4,055 by 2051.

Castalia                                                                                               5
CONFIDENTIAL
Figure 0.1: Government’s predicted outcomes in Reform Scenario and Opt-Out Scenario
Reform Scenario is based on faulty assumptions and flawed analysis
The Reform Scenario is based on faulty assumptions and flawed analysis. The government has
not shown with sufficient certainty to WDC that the claimed benefits of the Reform Scenario
will materialise.
The benefits of the Reform Scenario rest on three key claims:
▪ That WDC (and New Zealand as a whole) needs to invest to match Scottish levels of
water sector capital stock per resident
▪ The amalgamated entity will be able to halve its opex and capex relative to existing opt-
out entities
▪ WDC as an opt-out entity will not improve over the next 30 years.
Required investment for WDC and for New Zealand as a whole is overstated
The Reform Scenario rests on WICS’ modelling and manual adjustments that assume New
Zealand will need significantly higher levels of capital investment over the next 30 years than is
currently estimated in local authorities’ own 10-year plans. The required capital investment,
compared to WDC’s own planned investment is illustrated below.
Castalia 6CONFIDENTIAL
Figure 0.2 shows how WICS models a significant difference in net investment for WDC in the
Opt-Out Scenario compared to WDC’s own planned capital investment. 1 However, when the 0F0F0F
capital investment attributable to WDC in Entity A is calculated using WICS’ model, the profile
of planned investment is almost identical to WDC’s own investment plans. 2 1F1F1F
Figure 0.2: Net investment scenarios for Whangārei under WICS models and WDC’s own plan
300
250
NZD (millions)
200
150
100
50
0 2036
2037
2022
2023
2024
2025
2026
2027
2028
2029
2030
2031
2032
2033
2034
2035
2038
2039
2040
2041
2042
2043
2044
2045
2046
2047
2048
2049
2050
2051
Year
WICS standalone Capex for WDC
WDC 10YP and Castalia modelling for 20+
Amalgamated Entity Capex attributatble to Whangārei (by connections)
However, in modelling the Opt-Out Scenario, WICS claims that WDC needs large capital
investment increases from 2021 because WICS selectively and mechanistically applies a model
based on Scotland, that WICS suggests shows that New Zealand requires water asset capital
stock of up to $70,000 per capita. However, there is no strong evidence that Scottish asset
levels are relevant to New Zealand in general, or to Whangārei in particular. When we
compare asset levels per capita to a wider range of water entities in Australia, which has closer
similarities to New Zealand’s urban geography than Scotland, the choice of the Scottish model
is less clear.
1
Total investment for WDC unconstrained scenario is derived from their Long-Term plans until 2031. After 2031, the investment
requirements for years moving forward are projected as an average of total investment from 2022-2031 adjusted for inflation.
It has been noted in the RFI that a further investment of $226 million, $78 million, and $55 million will be required for
wastewater, water, and stormwater projects respectively. These figures have also been added to the projected investment
requirements for 2031-2050.
2 Amalgamated entity investment attributable to Whangārei has been calculated by attributing the net investment from the WICS
models for Entity A proportionate to the total number of connections for Whangārei.
Castalia 7CONFIDENTIAL Figure 0.3: Asset value per connected citizen for selected water utilities Note: Castalia could not reconcile WICS’ estimated asset value per connected citizen for Scottish Water and Yorkshire Water based on those entities’ annual reports. It is possible that WICS may be using undepreciated replacement values for the assets of those entities. For our analysis, we used asset values from the relevant entities’ annual reports. As a result, the asset value per connected citizen in this figure for Scottish Water and Yorkshire Water do not match the WICS figures illustrated in Figure 2.1. We included all vertically integrated Australian water utilities where recent replacement values were available. Efficiency assumptions are implausible WICS’ modelling makes implausible assumptions about the efficiency in the Reform Scenario. The government assumes that the Reform Scenario will deliver 50 percent capital expenditure (capex) savings and 53 percent operating expenditure (opex) savings. The capex saving is not grounded in any actual evidence, but rather on WICS’ observations. The implausibility of capex savings has also been addressed in previous analysis by Castalia for Local Government New Zealand and the Joint Steering Committee. Economies of scale in capex are not available in New Zealand water services, except for minor potential cost savings in procurement. The opex saving is also derived from Ofwat and Scottish observations. However, for WDC the opex efficiency is implausible because WDC already has comparable opex to Watercare. Furthermore, the government and LGNZ representatives have assured councils that no jobs will be lost in the water sector. Given the profile of WDC’s opex (mostly power, labour and outsourced services), it seems unlikely that significant further savings are possible. WDC is likely to improve water service delivery if it opts out, yet WICS assumes no such improvements In any case, WDC is likely to improve its services over the next 30 years, yet WICS’ modelling assumes that WDC will make no efficiency gains under the Opt-Out scenario. As a result, the Opt-Out scenario, as modelled by WICS, likely overstates WDC’s costs. WDC will be subjected to water quality regulation, and obtain guidance and expertise from Taumata Arowai. Corporatisation and improved performance of other water service providers will lead to changes at WDC that drive better performance as WDC seeks to match the benchmarks set. Castalia 8
CONFIDENTIAL

Economic regulation is likely to apply across the sector, not just to four amalgamated entities.
The government’s assumption that it cannot regulate all council-owned water services is
inconsistent with the Commerce Commission’s regulation of electricity distribution businesses
and inconsistent with the experience in multiple overseas jurisdictions where economic
regulators are capable of regulating many entities. Economic regulation is also likely to enable
benchmarking and comparisons.
WDC should examine how it can provide a constructive counter-proposal to the government
Water services are critical to wellbeing, so it is very important that options are considered that
are locally appropriate. Water services should be safe, resilient, reliable, and customer
responsive, at least cost. Some reform of the sector is necessary in some parts of New Zealand.
However, the analysis needs to done to determine where water services fall short of this
objective, and for what reasons.
Other than opting out, the Reform Scenario is the only option that has been presented to WDC
and other local authorities.
This report has shown that the Reform Scenario is founded on unsound evidence and faulty
analysis. The promised benefits of reform are unlikely to materialise. There are risks to the
Whangārei community from losing control of water services, and accountability of those
tasked with governance to local customers.
We recommend that WDC carry out a proper net benefit analysis, potentially with other local
authorities that have a similar viewpoint. This is likely to be many councils, since the WICS
analysis has consistent faults that apply to all local authorities. Such an analysis should include
the full range of options together with transparent data and sound and contestable analysis so
these options can be properly evaluated. There is plenty of analysis, evidence and now a rich
data set in the RFI responses for WDC and like-minded local authorities to be able to identify
alternative and better reform options. WDC could prepare a constructive counterproposal that
achieves desirable objectives, while avoiding the risks and costs of the Reform Scenario.

Castalia                                                                                           9
CONFIDENTIAL

1               Introduction
The New Zealand government is proposing to reform the drinking, waste and storm water
(three waters) sector. It proposes to amalgamate the three waters services of the 67 local
authorities into four regional public corporations.
The government is proposing to amalgamate WDC’s water services into a new statutory
corporation called “Entity A” together with the water services of Far North District Council,
Kaipara District Council and Watercare Services Limited, owned by Auckland Council (the
Reform Scenario). The government has presented the only alternative to the Reform Scenario
as being a situation where WDC remains as a standalone water service provider under council
control (the Opt-Out Scenario).
This report analyses the evidence underpinning both the Reform Scenario and the Opt-Out
Scenario as follows:
    ▪ The Reform Scenario is analysed, and its underlying assumptions tested to determine
      whether the stated level of household bills is robust (section 2). Specifically the analysis
      reviews:
           – The estimates of the required level of assets for the Reform Scenario (section 2.1)
           – The estimated efficiencies apparently available in the Reform Scenario (section 2.2)
           – Other aspects of the methodology that raise questions (section 2.3).
    ▪ The Opt-Out Scenario is analysed and its underlying assumptions tested to determine
      whether the stated level of household bills is robust (section 3)
    ▪ Finally, the risks and costs to the WDC community with the Reform Scenario are
      examined (section 4).

2               Government’s Reform Scenario
                produces implausible household bill
                estimates
The Reform Proposal predicts household bills for 2051. The WICS analysis rests on two key
assumptions: First, that the capital stock invested in New Zealand water services needs to
increase by a very large amount. Second, that the Reform Scenario will deliver large efficiency
gains compared to the Opt-Out Scenario. In our view, WICS’ assumed scale of required
increase in capital stock, and of the achievable efficiency gains under the reforms, are both
implausible.

2.1             Required investment estimate is overstated
The government’s case for reform rests on a claim that New Zealand water services require a
significant capital investment over the next 30 years. The government relies on WICS advice
and analysis to set the level of investment for the Reform Scenario from 2021 to 2051.
WICS’ modelling is entirely based on a top-down, New Zealand-wide assumption that a
massive nationwide investment programme is necessary for all council water services. This is

Castalia                                                                                             10
CONFIDENTIAL
despite WDC and all other local authorities submitting detailed bottom-up information about
planned capital investment.
Capital investment is needed in some parts of New Zealand now and in the next 30 years to
meet the demands of growth and due to historical deferred and underinvestment. There have
been high-profile asset failures. However, it is not clear that the investment is needed in all
places, at the scale WICS claim.
WICS are selective in estimating the nationwide required investment amount. WICS also use
inappropriate Scottish comparators to support its claim that New Zealand needs to invest at
equivalent levels. WICS’ estimate of required investment is significantly higher than the levels
of investment that asset-owner WDC has estimated will be required.
WICS used projected investment requirements across three investment types that include
replacement or renewal investment, enhancement investment, and growth investment
projections. These projections are based on assumptions relating to asset lives, replacement
costs, inflation, population density, and projected connections growth.
2.1.1 WICS approach to estimating required investment is unsound
In order to estimate the required investment, WICS uses English and Scottish comparators.
WICS allocated New Zealand-wide investment requirements for councils based on statistical
relationships and observed experiences in England and Scotland. The total investment
required is made up of two key components that include ‘enhancement and growth’ and ‘asset
replacement and refurbishment’.
WICS modelled the required investment using three approaches. WICS then cross-checked the
modelled investment against information gathered from councils’ RFI responses. The modelled
investment from the three approaches, plus investment specified in councils’ RFI responses are
summarised in Table 2.1.
WICS took three steps with each of its three modelling approaches:
▪ Step 1 is to apply econometric models to predict New Zealand’s investment needs
▪ Step 2 is to manually adjust the Step 1 estimate for differences in growth
▪ Step 3 is to apply a cap of $70,000 to reflect an assumption about the ability to pay for
the investment.
Castalia 11CONFIDENTIAL
Table 2.1: WICS modelling approaches for required investment
Approach Enhancement and Growth Investment ($ billions) Asset Total
replacement and Investment 3 2F2F2F
refurbishment ($ ($, billions)
Step 1: Step 2: Manual Step 3: Apply
billions)
Unadjusted adjustment for cap of $70,000
model output “differences in per connected
(NZ $, billions) growth” citizen
1 Great Britain 49 – 69 63-83 57-77 63-77 120-154
comparative
Models
2 Scotland only 73- 99 87 -113 77-100 70-86 148-185
comparative
models (WICS
preferred)
3 Asset value 52-57 81-85 77-81 70-79 148-160
comparisons
with UK 43F3F3F
Information 53 N/A N/A 61-69 115-122
included in
councils’ RFI
Source: WICS Final Report
WICS makes no adjustment for the overlapping nature of growth and replacement investment
We note that, in practice, when enhancement and growth investment takes place, the new
upgraded assets often replace at least some ageing assets, thus reducing the need for
replacement expenditure. WICS’ approach appears to have made no adjustment for this, since
the total investment is calculated as the simple sum of ‘enhancement and growth' and ‘asset
replacement and refurbishment’, and the estimates for the two categories are derived
separately, with no consideration of interaction between the two. This means that WICS’ total
investment estimate will be overstated.
WICS’ preferred model appears highly selective
WICS’ models in approaches ‘1’ (Great Britain comparative) and ‘3’ (comparing asset values)
produce a level of enhancement and growth investment in Step 1 that is broadly consistent
with councils’ RFI responses.
Yet despite the consistency with councils’ own estimates of investment, WICS’ preferred
model is approach ‘2’. Approach ‘2’ reports significantly higher required levels of investment.
3 Total investment is calculated adding enhancement and growth estimates taken from estimates after applying a cap of
NZ$70,000 per connected citizen and the asset replacement and refurbishment expenditures. The range represents the
modelled low and high values of investment requirements.
4 This approach is briefly explained by WICS to use projected investment that is required to match the levels of asset values per
connected citizen in the UK and Scotland for 2020 after adjusting for depreciation and connection differences.
Castalia 12CONFIDENTIAL
WICS Step 2 and Step 3 adjustments to its models are unsound
WICS’ ‘enhancement and growth investment’ models in approaches ‘1’ and ‘2’ are apparently
driven by population density. 5 That is to say, the models should automatically predict the
4F4F4F
required level of investment, given population density in New Zealand. However, WICS has
manually increased the required level of investment to “adjust for differences in growth”.
WICS then make a further manual adjustment and impose an investment constraint cap of
$70,000 per connected citizen due to affordability concerns, because mechanistically applying
the Scotland comparator (Step 1) and manual adjustments (Step 2) leads to even higher and
even more implausible levels of investment.
WICS ignored local authorities’ own estimates of required investment
All local authorities in New Zealand agreed to provide the government with comprehensive
information about water services during the Request for Information (RFI) phase in mid-2020.
The RFI responses included a full picture of all local authorities’ planned water sector
investment.
Local authorities, as asset owners with accountability to local communities, have a sound
understanding of the investment needs required in three waters’ services. WICS could have
used this detailed and rich data source to estimate the required investment levels. WICS could
have made adjustments to the RFI data to account for any conservatism, or to account for
differences in the sophistication of management in estimating investment needs. However,
WICS preferred top-down modelling using overseas comparators.
2.1.2 Required investment level is based on inappropriate Scottish
comparators
WICS estimate of New Zealand's water investment needs is based on an assumption that it
must match investment levels in Scotland. This is justified on the grounds that NZ has a
relatively lower level of urbanisation. 6 However, WICS does not use urbanisation figures in its
5F5F5F
analysis. Instead, it uses population density, which is a different concept.
WICS concludes that Scotland is the most appropriate guide for the required level of
investment because of New Zealand’s low population density compared to other areas in the
United Kingdom.
WICS predicts New Zealand’s water investment needs based on correlation with population density
WICS identifies a correlation between English and Scottish drinking water and wastewater
asset value levels and population density. This is illustrated in Figure 2.1, which we reproduced
from WICS report. Based on the correlation between asset value levels and population density,
WICS suggests that NZ investment needs to rise significantly. According to this correlation,
New Zealand’s top-down, national-level required investment is $10,000 lower than it should
be.
5 WICS supporting material 1 – required investment (slide 33), https://www.dia.govt.nz/diawebsite.nsf/Files/Three-waters-
reform-programme/$file/wics-supporting-material-1-required-investment.pdf
6 WICS supporting material 1 – required investment (slide 19), https://www.dia.govt.nz/diawebsite.nsf/Files/Three-waters-
reform-programme/$file/wics-supporting-material-1-required-investment.pdf
Castalia 13CONFIDENTIAL Figure 2.1: New Zealand’s asset gap according to WICS Source: WICS final report Population density is not a good predictor of required asset value levels However, WICS does not show how the weak correlation in Scotland and England might predict water investment needed in New Zealand. No causal link is drawn. We were also unable to reconcile WICS’ Asset value per connected citizen figures for Scottish Water and Yorkshire. They are much higher than what is implied by the asset values listed in those entities’ annual accounts. It is possible that WICS may be using undepreciated replacement values for the assets of those entities, which should not be compared to the optimised depreciated replacement values submitted by WDC. We analysed other regulated water utilities, including in Australia, to determine whether there was a clear relationship between asset level per connected citizen and population density. Australia has some similarities with New Zealand in that its population is highly urbanised, but overall population density is quite low, because towns are far from each other. Australia’s towns developed at a similar time to New Zealand’s and therefore follow the same typical geography (detached houses on suburban sections). Figure 2.2 shows a plot of asset value per connected citizen for water utilities in Australia, Scottish Water, Yorkshire Water and WDC. For our analysis, we used asset values from the relevant entities’ annual reports. As a result, the asset value per connected citizen in this figure for Scottish Water and Yorkshire Water do not match the WICS figures in Figure 2.1. There is a very weak relationship between population density and asset value per connected citizen as identified by WICS. Figure 2.2 shows that by adding or removing comparator water providers, the correlation line could change markedly. Castalia 14
CONFIDENTIAL

Figure 2.2: Asset value per connected citizen for selected water utilities

Note: Castalia could not reconcile WICS’ estimated asset value per connected citizen for Scottish Water and Yorkshire Water based
on those entities’ annual reports. It is possible that WICS may be using undepreciated replacement values for the assets of those
entities. For our analysis, we used asset values from the relevant entities’ annual reports. As a result, the asset value per connected
citizen in this figure for Scottish Water and Yorkshire Water do not match the WICS figures illustrated in Figure 2.1. We included all
vertically integrated Australian water utilities where recent replacement values were available.

There are significant differences between Scotland and New Zealand geographies
Scotland is not a relevant comparator for New Zealand water services because of fundamental
differences between the two countries’ geography. In water services, geography is important
for the cost and quality of service. Denser urban areas tend to have lower average costs of
service. Water services with more dispersed customers have to distribute drinking water, and
pump wastewater over longer distances with more pipes, dispersed treatment infrastructure
and higher costs. Aside from some high-level discussion of available water sources, and similar
populations, WICS has not investigated why Scotland’s geography is a good predictor of New
Zealand’s water investment needs.
The total land area and the geographical distribution of the populations are very different.
WICS incorrectly assumes that lower population density in New Zealand implies lower levels of
urbanisation. Table 2.2 illustrates how New Zealand’s population is more urbanised than
Scotland’s, but despite this, New Zealand still has a lower population density. A larger majority
of New Zealand’s population live in urban areas and the urban population is more likely to
grow in New Zealand as compared to Scotland.

Castalia                                                                                                                             15
CONFIDENTIAL

Table 2.2: Urban population statistics of New Zealand and Scotland

                                  Population            Urban population                    Population in the    Urban population
                                  Density(people per    (% of population)                   largest city (% of   growth (annual %)
                                  sq. km of land are)                                       urban population)
     New Zealand                  18.6                  86.7                                36.4 (Auckland)      2.2

     Scotland                     65                    83.04        6F6F6F
                                                                              7             11.6 (Glasgow)       -0.06   7F7F7F
                                                                                                                                  8

Source: World Bank Indicator Database, 2020

2.1.3              WICS’ required investment estimate is much higher than WDC’s
                   investment plans
WDC’s investment plans in its 10-year plan and longer-term investment planning are
significantly lower than the WICS estimates for the Opt-Out Scenario. WDC’s RFI response
reveals that its planned investment is orders of magnitude below the level that WICS’ model
predicts. This is despite the WDC having a similar level of asset value per connected property
as Auckland’s Watercare, the largest water provider and, according to WICS, the most
sophisticated. The net assets per connected property was $23,732 for Auckland and $22,831
for WDC in 2020. 9 Moreover, WDC compares even more favourably than Scottish Water in
                         8F8F8F

terms of asset values per connected citizen, as illustrated in Figure 2.2
Figure 2.3 illustrates the significant difference between WICS’ modelled net investment needs
for WDC, and WDC’s own planned capital investment. 10 We also calculated the capital
                                                                                   9F9F9F

investment attributable to WDC in Entity A using WICS’ model and find that it is remarkably
similar to WDC’s own investment plans. 11               10F10F10F

7     https://www.gov.scot/publications/rural-scotland-key-facts-2018/pages/2/
8     Urban population as a percent of total population has decreased by 0.06 percent between 2018 and 2019.
      https://www.nrscotland.gov.uk/statistics-and-data/statistics/statistics-by-theme/population/population-estimates/2011-
      based-special-area-population-estimates/population-estimates-by-urban-rural-classification
9     Calculated from WDC and Auckland Council’s RFI responses.
10
      Total investment for WDC unconstrained scenario is derived from their Long-Term plans until 2031. After 2031, the investment
      requirements for years moving forward are projected as an average of total investment from 2022-2031 adjusted for inflation.
      It has been noted in the RFI that a further investment of $226 million, $78 million, and $55 million will be required for
      wastewater, water, and stormwater projects respectively. These figures have also been added to the projected investment
      requirements for 2031-2050.
11   Amalgamated entity investment attributable to Whangārei has been calculated by attributing the net investment from the WICS
      models for Entity A proportionate to the total number of connections for Whangārei.

Castalia                                                                                                                              16
CONFIDENTIAL
Figure 2.3: Total Net Investment scenarios
300
250
NZD (millions)
200
150
100
50
0
2022
2023
2024
2025
2026
2027
2028
2029
2030
2031
2032
2033
2034
2035
2036
2037
2038
2039
2040
2041
2042
2043
2044
2045
2046
2047
2048
2049
2050
2051
Year
WICS standalone Capex for WDC
WDC 10YP and Castalia modelling for 20+
Amalgamated Entity Capex attributatble to Whangārei (by connections)
2.2 Efficiency estimates for Reform Scenario are
implausible
WICS uses efficiency assumptions in its analysis of the amalgamated entity (Entity A). The
efficiency assumptions drive significant cost savings for the Reform Scenario. WICS assumes
that:
– Capital expenditure (capex) efficiency will reach 50 percent
– Operating expenditure (opex) efficiency will reach 53.3 percent
It also assumes a total factor productivity efficiency improvement of 0.4 percent per annum for
the Reform Scenario but not for WDC as an opt-out entity. These efficiency estimates are
highly implausible.
2.2.1 Capex efficiency estimates are implausible
WICS claims that the Reform Scenario will result in 50 percent lower capital costs. WICS claims
that Entity A will progressively improve its capex efficiency so that by 2041 it is saving 50
percent per annum. That is, by 2041, for each $0.50 invested, Entity A will get $1.00 of capex
value. This is an implausible assumption for the following reasons:
▪ The assumption is not sourced to any credible authority or from any observed experience
that is relevant to New Zealand
▪ WICS has not shown how Scottish Water capex has any bearing on New Zealand water
services and geography
Castalia 17CONFIDENTIAL
▪ Only very minor economies of scale are available in New Zealand water services
▪ The assumption has been criticised by government-appointed peer reviewers
▪ The assumption does not consider diseconomies of scale.
The Entity A model results are highly sensitive to this assumption, so if it is wrong, the benefits
of the Reform Scenario change drastically.
WICS capex efficiency is based on a single source of information
WICS capital expenditure assumption is based solely on a belief that it “seems reasonable to
expect a reformed three waters industry in New Zealand to match the efficiency improvement
of the industry in Scotland and by the water and sewerage companies in England and Wales.”
The only quantitative analysis WICS says it has undertaken to support this belief is an
observation that Scotland improved capital expenditure efficiency from 2002-2021. This
quantitative analysis has not been substantiated in any documents released to WDC. There are
many reasons why Scottish Water may have improved reported capital expenditure efficiency.
These reasons are likely to be specific to Scottish Water. Decision-makers need an explanation
of those reasons to understand whether the same improvements can be achieved in New
Zealand entities. WICS provides no such explanation.
The citation used in the Entity A model 12 is also misleading. WICS incorrectly cites the source
11F11F11F
for the capital efficiency improvement as “based on observed experience from GB”. However,
the actual source of WICS’ capital efficiency assumption is not Great Britain at all. Rather WICS
cites 13 the single observation of claimed efficiency improvements by Scottish Water from
12F12F12F
2002-2021.
WICS claims that the capex efficiency will come from:
▪ Economies of scale
▪ Clarity of policy priority
▪ Robust water quality and environmental regulation
▪ Economic regulation
▪ Excellence in management.
WICS does not disclose the relative contribution of these factors to the total 50 percent
efficiency gain. In section 3 below, we discuss how water service providers in the Opt-Out
Scenario are likely to improve as a result of the improved water quality regulatory regime, how
management may improve, and how it is possible that economic regulation could apply to
other water services (not just the amalgamated entities).
Scotland is an inappropriate model for Entity A—Auckland, Whangārei, Kaipara and Far North
The population within the Entity A boundaries almost all live in urban areas. There are
significant distances between each urban area. Figure 2.4 illustrates the population densities
and distances between Entity A towns.
12 And in the models for Entity B, Entity C and Entity D.
13 WICS slidedeck “Entity A: the use and analysis of the RFI information and other benchmarks”, available at:
https://www.dia.govt.nz/Three-Waters-Reform-Individual-council-models-and-slidepacks
Castalia 18CONFIDENTIAL Figure 2.4: Major cities within the proposed Entity A and the distances between them Source: NZ Population in 3D, Stats NZ This is different from Scotland, where most of the population lives in the narrow band that is between and around Glasgow and Edinburgh (Figure 2.5). There is potential for agglomeration efficiencies and for networks to achieve some scale benefits based on proximity alone. Figure 2.5: Population density (persons per square kilometre) in Scotland Data Source: https://www.worldpop.org/ (3D map generated by Castalia) In contrast, almost 99 percent of the total population of proposed Entity A live in urban areas with significant distances between them. This means that the “asset optimisation” (that is, the ability to consolidate water networks between towns) is likely to be much lower than as claimed by WICS due to significant distances between New Zealand towns. Economies of scale are not available in water services from amalgamations at the level WICS claims Castalia has previously advised DIA, LGNZ and the Joint Steering Committee that the economies of scale claimed in WICS’ 2020 slidedecks from administrative amalgamations were Castalia 19
CONFIDENTIAL

implausible. In New Zealand, only minor economies of scale are achievable through
institutional reform, and these will be mostly in management and procurement (not
infrastructure capex). 14 Castalia showed that economies of scale are unlikely to be available in
                               13F13F13F

New Zealand on the basis of the evidence presented by WICS, Frontier Economics and in the
economic literature relied on by the government. The findings in Castalia’s 2020 Economies of
Scale report have not been rebutted.
WICS claims that the 50 percent capex efficiency gain emerges when water entities achieve a
population of 800,000 or more. It also claims that entities serving a minimum population of
59,000 increase capex efficiency as they approach the 800,000 population number. This claim
has no basis in the economic literature.
In fact, the literature that looks at the specific question of whether economies of scale are
available from administrative amalgamations find that there are none except in highly specific
circumstances, not present in New Zealand. Economies of scale estimate is based on non-
credible evidence
When preparing the 2020 Economies of Scale report, Castalia reviewed the WICS 2020
slidedecks. Access to the underlying models and assumptions was refused. In the 2020
Economies of Scale report, we were advised 15 that the economies of scale assumption was
                                                              14F14F14F

based on England, Wales and Scotland observations. However, we now know that the
supporting evidence for the 53 percent capex efficiency is a single Scottish observation from
2002-2021. 16    15F15F15F

WICS economies of scale claims are rejected by peer reviewers FarrierSwier
FarrierSwier peer-reviewed WICS’ approach and had access to the underlying models. It found
that “WICS analysis cannot be used to definitively conclude that amalgamation in and of itself
will lead to material efficiency gains in New Zealand”. 17 Its review did not assess whether the
                                                                           16F16F16F

outputs from the WICS analysis are reasonable or free from error. 18                        17F17F17F

FarrierSwier also state “significant care should be taken when relying on the capital efficiency
gaps estimated by WICS. This is particularly important, given the significant step up in
investment forecast for the 30-year period and the role that the capex efficiency assumption
plays when estimating benefits from amalgamation and associated reform.” Like Castalia,
FarrierSwier express concern with the sensitivity analysis approach.
Diseconomies of scale not considered
Diseconomies of scale can emerge from administrative amalgamations in water services. This
was not considered in WICS’ modelling.
WICS has overlooked a relevant case from Australia. In 1992, Melbourne and Metropolitan
Board of Works merged with several smaller urban water authorities to form Melbourne

14   Castalia (2020), Analysing Economies of Scale in New Zealand Water Services: Report to Local Government New Zealand
15   Conference call between Castalia and WICS (Alan Sutherland) on 20 August 2020
16   WICS (2021), Slidedeck “Entity A: the use and analysis of the RFI information and other benchmarks”, available at:
     https://www.dia.govt.nz/Three-Waters-Reform-Individual-council-models-and-slidepacks
17   FarrierSwier (2021), Three Waters Reform: Review of the methodology and assumptions underpinning economic analysis of
     aggregation, page 29
18   FarrierSwier (2021), Three Waters Reform: Review of the methodology and assumptions underpinning economic analysis of
     aggregation, pp. iv-v

Castalia                                                                                                                     20
CONFIDENTIAL
Water. However, in 1995, the entity was disaggregated, and Melbourne Water reformed to
become a wholesale water company only. City West Water, South East Water and Yarra Valley
Water became separate retail water companies. 19 Several studies confirm that the three
18F18F18F
disaggregated retail water entities achieved significant cost efficiencies and service level
improvements compared to Australian and international water companies since the
disaggregation of Melbourne Water. 20 A benchmarking analysis using data from 2002-2003
19F19F19F
concluded that the three separate retailers performed “at or near the determined efficiency
frontier”. 21 It also made major improvements in customer services in comparison to major
20F20F20F
urban water authorities in Australia. Melbourne’s disaggregated water entities even
performed better than UK water companies, according to Ofwat. 22 21F21F21F
2.2.2 Opex efficiency estimates are implausible
Efficiency estimates derived from econometric studies in the UK are used in the Reform
Scenario to drive a claimed 53.3 percent saving in opex.
WICS use econometric models to claim that opex efficiencies of 50 percent are possible
WICS has used an Ofwat 2004 econometric model to estimate that, after reform, larger New
Zealand water entities can achieve up to a 53.3 percent efficiency improvement to operating
expenditure (opex).
To estimate the opex efficiencies, WICS combined 2003-2004 data from the UK with recent
data from New Zealand councils to estimate a performance baseline to measure New Zealand
water entities against. To ensure compatibility of the estimates with New Zealand’s operating
environment, the gaps in efficiency between New Zealand entities and the benchmark were
adjusted with ‘special factors’ related to regulatory, geographic and environmental factors that
were considered unique to New Zealand.
Based on observed efficiency gains from UK water reforms, WICS assumes that New Zealand
water reforms may achieve the same operating efficiency results – roughly a 50 percent
improvement.
It is important to note that these estimates are an assumed benchmark that provides a guide
to what might be possible based on experiences in the UK water sector but, as peer reviewer
FarrierSwier notes, care needs to be taken as it is not possible to conclude that those
efficiencies can be realised. 23 22F22F22F
From observations of UK data, larger water entities – those serving populations greater than
800,000, realised larger efficiency improvements than smaller entities. As such, WICS assumes
19 https://www.melbournewater.com.au/water-data-and-education/water-facts-and-history/history-and-heritage/timeline-our-
history
20 Water Ways: Inquiry into Reform of the Metropolitan Retail Water Sector (2007).
https://www.dtf.vic.gov.au/sites/default/files/2018-02/reform-of-the-metropolitan-retail-water-sector-inquiry.pdf
21 Coelli and Walding (2006), "Performance measurement in the Australian water supply industry: A preliminary analysis."
Performance measurement and regulation of network utilities, 29-61.
22 Annual Report 2007-08 (Ofwat)
https://assets.publishing.service.gov.uk/government/uploads/system/uploads/attachment_data/file/250280/0589.pdf
23 FarrierSwier (2021), Three Waters Reform: Review of the methodology and assumptions underpinning economic analysis of
aggregation, page 60
Castalia 21CONFIDENTIAL
that given the small size of individual councils in New Zealand, the councils will not be able to
fully realise the predicted efficiency improvements if they do not amalgamate.
WDC does not appear to have significant opportunity for opex savings
A 50 percent reduction in WDC’s opex costs appears implausible given the nature of those
costs. Approximately 58 percent of WDC’s opex costs are made up of employment, hired and
contracted services, power, and materials and consumables. Power costs will not reduce
significantly as a result of administrative amalgamations. Some minor cost savings are possible
for materials and consumables in the Reform Scenario (for example, as a result from buying in
bulk). However, none of the opex costs are likely to fall by 50 percent.
Labour cost reductions, including direct employment costs and hired and contracted services,
would not be expected to decrease, based on promises of no job losses from government
representatives and Three Waters Steering Committee members:
▪ Rachel Reese, Mayor of Nelson and Three Waters Steering Committee member stated:
“all of our staff in our organisations… you will have a guaranteed role in the new service
entities. The role will retain the features of your current role; your salary, your terms,
and your location.” 24 23F23F23F
▪ Grant Robertson, Minister of Infrastructure said, “The recognition of the workforce… the
current workforce involved in this space… this is more work here, more jobs here, higher
paid jobs here, that transitional process must include that workforce and must include
you, and I want to give that commitment to you today.” 25 24F24F24F
Figure 2.6: WDC three waters operating expenditure breakdown
Employment Power Hired and contracted services
Materials and Consumables Other direct costs General and support costs
Scientific services Local Authority rates Other
$270
NZD (thousands)
$2,799 $1,888 $3,231 $1,225 $1,202 $4,451 $594 $8
0% 10% 20% 30% 40% 50% 60% 70% 80% 90% 100%
Percent of operating expenditure
Source: Whangārei District Council RFI, averaged data from 2019-2021
24 Rachel Reese, Mayor of Nelson and Three Waters Steering Committee member – Thursday 15th July 2021, LGNZ Conference
Speech [00:23:12:00], available at https://www.lgnz.co.nz/about/lgnz-conference/2021-lgnz-conference/videos-conference-
2021/
25 Grant Robertson, Minister of Infrastructure – Thursday 15th July 2021, LGNZ Conference Speech [00:33:40:00], available at
https://www.lgnz.co.nz/about/lgnz-conference/2021-lgnz-conference/videos-conference-2021/
Castalia 22CONFIDENTIAL
WDC’s opex costs are similar to Watercare’s suggesting WDC is already performing efficiently
Despite serving a significantly smaller customer base compared to Auckland (~25,000
compared to ~525,000 connected properties) WDC has similar opex per connected property
for water as Watercare in Auckland: $284 compared to $224. The relative difference in opex
per connected property for wastewater is even lower for WDC and Watercare: $322 compared
to $310.
This suggests that Whangārei is already operating to a level of efficiency close to that of
Watercare, which already represents 95 percent of the connections of the Reform Scenario
Entity A. It is difficult to understand how scale could improve opex efficiency at WDC given that
it has comparable opex costs to Watercare.
Figure 2.7: Operating expenditure cost per connected property
Auckland (Watercare) Whangarei (WDC)
Wastewater
Water
0 50 100 150 200 250 300 350
Cost ($) per connected property
Source: Whangārei and Auckland RFI
WDC, and other local authorities already outsource operational capability to scale providers
Many New Zealand water companies already outsource operational capability to specialist
providers. Several large-scale providers deliver services across all of New Zealand, such as
Downer, CityCare Water and Veolia (a global specialist water services company). Other large-
scale providers operate on a regional basis, such as Watercare (which provides services around
Auckland).
Outsourced services amount to around 20 percent of WDC’s annual opex costs. Outsource
providers already achieve economies of scope and scale across regions and New Zealand. This
is because outsourced service providers can offer specialist expertise on a contracted basis,
where full-time employment of staff may not be warranted. Outsource providers also compete
with one another for council contracts. This ensures prices tend towards costs and it
incentivises efficiency improvements. Cost reductions of up to 50 percent in the already
competitive outsource service provider market is implausible.
Castalia 23CONFIDENTIAL
2.3 WICS analytical approach has other methodological
flaws
WICS’ analytical approach has a range of other flaws.
WICS uses an unconventional method that back-solves the revenue path
Typical best practice for calculating the cost of service and tariff levels for water utilities and
other regulated services in developed and developing countries is to use the “building blocks
approach”. The building blocks approach is used by the New Zealand Commerce Commission
for a range of regulated infrastructure industries, Australian water economic regulators such as
IPART and Essential Services Commission, and by Ofwat in the UK. The building blocks
approach reveals a more accurate cost of service, and therefore the revenues required to meet
costs.
However, WICS uses a novel method to estimate household bill levels. The projected revenues
which result in the “household bills” are calculated based on a hard coded revenue path.
Typically, a model used to predict costs (and therefore revenues required to cover costs)
should determine the revenue path as an output of the model, informed by the assumptions.
However, the revenue path is back solved and has been hard-coded to align with the debt
ratios (250 percent of revenue for the Opt-Out Scenario).
Key discretionary assumptions made by WICS inevitably lead to the Reform Scenario demonstrating
superior results
WICS modelling approach uses a number of key discretionary assumptions that are highly
favourable for the Reform Scenario and highly unfavourable for the Opt-Out Scenario. With
such assumptions, it was inevitable that WICS modelling would reach the conclusions that it
did.
The model assumes that capex efficiency can only begin to be realised if the council’s
population size is greater than 59,000. The efficiency factor increases progressively to 50%
when a threshold of 800,000 population is crossed. This ‘limit’ set by WICS automatically
assumes that many councils, including WDC, will not realize any efficiency gains, while every
amalgamated entity will realize efficiency gains of over 50%.
Further, the net investment profile is modelled differently in the Reform Scenario compared to
the Opt-Out Scenario. In the Reform Scenario, WICS has only included the large investment
requirements after 2031. Yet, in the Opt-Out Scenario, WICS included the large investment
requirements from 2021. The effect is that, in the Reform scenario, the benefits of the new
investment are delayed by up to a decade, while the costs arrive just in time to be reduced by
the maximum efficiency gains assumed in the model. We note that 2031 is the first year when
the WICS model allows maximum efficiency gains to be realised.
The figure below demonstrates the effect of WICS’ time-profile adjustment on the Reform
Scenario. The solid black line shows WICS’ stated new investment path, while the blue dashed
line shows what that path would have been without the manual adjustment WICS made to the
time-profile of the investment. For illustrative purposes, the black dashed line also shows what
the new investment path looks like before WICS applies efficiency gains.
Castalia 24CONFIDENTIAL
Figure 2.8: Impact of time-profile adjustment on new investment path under the reform scenario
5000
4500
4000
3500
NZD (Millions)
3000
2500
2000
1500
1000
500
0
2020 2025 2030 2035 2040 2045 2050 2055
Year
Reform Scenario (timing profile removed) with efficiency gains
Reform Scenario with Efficiency gains removed
Reform Scenario as modelled by WICS
Castalia 25CONFIDENTIAL
3 WDC’s Opt-Out household bills are
likely to be much lower than
government estimates
The government’s analysis of the benefits of reform compares the Reform Scenario to a
situation where no reform and no service improvement takes place (the Opt-Out Scenario).
This is an incorrect assumption and leads to significant overstatement of the modelled and
claimed benefits. In the Opt-Out Scenario, several factors are likely to lead to improved water
services, as well as efficiencies, even if more investment is required.
3.1 WICS overlooks WDC’s current high relative
performance
WICS have overlooked WDC’s current performance relative to other water service providers
across a range of measures. Because WICS’s analysis is conducted at a top-down, national
level, it cannot incorporate WDC’s current high relative performance. WICS prediction of
WDC’s performance under the Opt-Out Scenario is much worse than the performance WDC
can actually expect, given its track record.
WDC is performing well compared to other Entity A water providers
WDC is already meeting high performance standards for drinking water quality, environmental
outcomes and economic performance. WDC had only 9 drinking water complaints per 1,000
properties compared to 7, 13 and 78 for Watercare, Kaipara District and Far North District
respectively. WDC has significantly fewer wastewater complaints than Watercare, Kaipara
District and Far North District per 1,000 properties in FY2020 26. WDC water services
25F25F25F
“continued to produce A-grade water from all seven water treatment plants” 27 achieving 26F26F26F
100% Health Act compliance in FY 2020. WDC had 88.9% discharge permit compliance
compared to 50% in Auckland in FY 2020. Non-compliance was related to smaller schemes
reflected by a 2.3% population equivalent metric. WDC also recorded 0 wastewater sewer
collapses in FY2020 28. 27F27F27F
Whangārei has significantly lower levels of three waters debt compared to Auckland Far North
and Kaipara. WDC retained a Standard and Poors credit rating of AA+, on par with the
Crown. 29 WDC is expected to increase capex by $231 million until 2031 under current capital
28F28F28F
expenditure plans.
WDC has close to 100 percent metering—unlike other parts of New Zealand and unlike Scotland
Water meters enable service providers to monitor consumption, detect leaks, and target
investment where it is most needed. Water meters enable opex efficiency savings and can
lower overall capex. Demand management initiatives are enabled. Demand management can
26 Castalia review of local authority and water provider annual reports.
27 Whangārei District Council 2020 Annual Report, p. 50
28 Castalia review of local authority and water provider annual reports.
29 Local Government Funding Authority, List of LGFA Guarantors, available at:
https://www.lgfa.co.nz/files/documents/List%20of%20LGFA%20Guarantors%2016%20March%202021%20CURRENT.pdf
Castalia 26CONFIDENTIAL
include peak demand pricing, or pricing during periods of drought or other water scarcity.
Demand-side management can reduce a provider’s need to invest in additional capacity,
thereby reducing overall investment requirements.
Very few households have water meters in Scotland. 2016/17 data reported to the Scottish
Parliament states that only 0.016 percent of all households in Scotland had water meters (400
out of 2.4 million households). 30 In England (which has been subject to regulation and a
29F29F29F
privatised sector since 1989) and Wales (subject to regulation, owned by a not-for-profit
corporation) only around half of all households have water meters. 31 30F30F30F
Therefore, the claim that WDC cannot match the improvements WICS claims to observe in
Scotland and elsewhere in the UK is likely wrong.
3.2 Improved regulatory regimes will incentivise improved
performance by WDC
The New Zealand regulatory regime for water services has been suboptimal. The government
is reforming water quality regulation to improve compliance and lift the performance of water
providers. The Reform Scenario also proposes to create a new economic regulator.
Environmental outcome regulation will remain the responsibility of regional councils.
The government and WICS have assumed that WDC and other councils that opt-out of the
Reform Scenario will not improve performance because of the new regulatory regimes, or that
regulation will not apply. These underlying assumptions are flawed.
3.2.1 Water quality regulation will likely lead to improved performance by
WDC
The New Zealand water reforms also involve significant change to the water quality regulatory
regime. The Ministry of Health has been responsible for water quality regulation over the past
60 years (and pursued a solitary prosecution). The government introduced the Water Services
Bill in July 2020. It is at the second reading stage. The Bill will formally establish the drinking
water quality regulator Taumata Arowai.
The governments' objective for the Bill is to set a clear national policy direction for the three
waters sector, ensure people can access water that is safe to drink, effectively manage risks to
drinking water safety, and strengthen compliance, monitoring and enforcement 32. 31F31F31F
The government claims the new regulator will provide sector leadership, technical and
scientific expertise, greater clarity on what is expected of councils and increased support for
compliance. Specifically, the government claims that WDC, and other water service providers
will improve performance as a result of Taumata Arowai’s assistance and intervention. The
government notes that Taumata Arowai will:
30 Commitee on Climate Change (2016), Scottish Climate Change Adaptation Programme: An Independent Assessment for
Scottish Parliament, available at: https://www.climatexchange.org.uk/media/3578/bw-briefing-note-uptake-of-water-
metering-2018.pdf
31 Water UK website: https://www.water.org.uk/advice-for-customers/water-meters/
32
1 July 2019, Cabinet Paper: Strengthening the Regulation of Drinking Water, Wastewater and Stormwater, Offices of the
Ministers of/for Local Government, Health and Environment, pg 2, available at: Cabinet-Paper-and-minute-Strengthening-
regulation.pdf (dia.govt.nz)
Castalia 27You can also read