Aeromagnetic Map of Burney and the Surrounding Area, Northeastern California - By Victoria E. Langenheim
←
→
Page content transcription
If your browser does not render page correctly, please read the page content below
Aeromagnetic Map of Burney and the Surrounding Area,
Northeastern California
By Victoria E. Langenheim

Pamphlet to accompany
Open-File Report 2021–1006

2021

U.S. Department of the Interior
U.S. Geological Survey
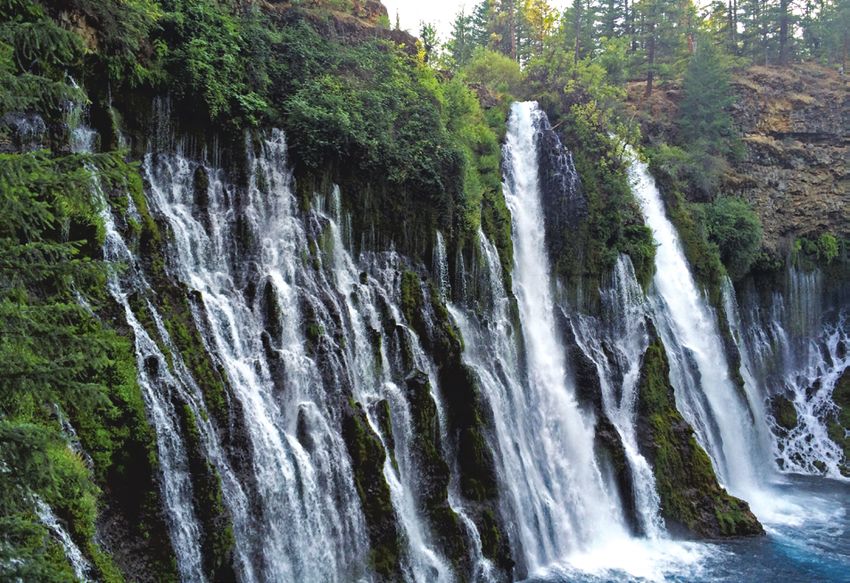
U.S. Geological Survey, Reston, Virginia: 2021

For more information on the USGS—the Federal source for science about the Earth, its natural and living
resources, natural hazards, and the environment—visit https://www.usgs.gov or call 1–888–ASK–USGS.
For an overview of USGS information products, including maps, imagery, and publications,
visit https://store.usgs.gov.

Any use of trade, firm, or product names is for descriptive purposes only and does not imply endorsement by the
U.S. Government.

Although this information product, for the most part, is in the public domain, it also may contain copyrighted materials
as noted in the text. Permission to reproduce copyrighted items must be secured from the copyright owner.

Suggested citation:
Langenheim, V.E., 2021, Aeromagnetic map of Burney and the surrounding area, northeastern California: U.S.
Geological Survey Open-File Report 2021–1006, 8 p., 1 sheet, scale 1:250:000, https://doi.org/10.3133/ofr20211006.

Associated data for this publication:
Langenheim, V.E., 2019, Aeromagnetic data, grid data, and magnetization boundaries of a survey flown in the Burney
region, northeastern California: U.S. Geological Survey data release, https://doi.org/10.5066/P9PUFYDD.

ISSN 2331-1258 (online)

Cover. View to west of Burney Falls. Photograph by Victoria Langenheim, July 30, 2015.
Acknowledgments
The U.S. Geological Survey (USGS) National Cooperative Geologic Mapping program provided
funding for this study. We thank Chris Evans and the rest of the crew at New-Sense Geophysics
Ltd., who flew the survey and processed the data to total-field anomalies. Geoffrey Phelps and
Donald Sweetkind (both USGS) provided constructive reviews and Aditya Navale provided a
skilled edit.

                                                             iii
Contents
Abstract............................................................................................................................................................1
Introduction.....................................................................................................................................................1
Data ..................................................................................................................................................................1
Filtering and Magnetization Boundaries.....................................................................................................6
Preliminary Results.........................................................................................................................................6
References Cited............................................................................................................................................8
Figures
1. Simplified geologic map of area surrounding Burney, California, showing location and
focal mechanism of M5.7 2013 Canyondam earthquake discussed in text............................2
2. Map of area surrounding Burney, California, showing heights of magnetic sensor
above ground surface measured by radar altimetry...................................................................3
3. Colored shaded-relief-aeromagnetic maps of area surrounding Burney, California........4
4. Colored shaded-relief-aeromagnetic map of area surrounding Burney, California,
filtered to enhance shallow sources..........................................................................................7
Map Sheet
1. Aeromagnetic Map of Burney and the Surrounding Area, Northeastern California
Conversion Factors
U.S. customary units to International System of Units
Multiply By To obtain
Length
foot (ft) 0.3048 meter (m)
mile (mi) 1.609 kilometer (km)
ivAeromagnetic Map of Burney and the Surrounding Area,
Northeastern California
By Victoria E. Langenheim
Abstract dispersed, three historical earthquakes of about M6.2 in the late
1800s between Honey and Eagle Lakes produced widespread
An aeromagnetic survey was conducted to improve shaking (as much as Modified Mercalli Intensity (MM) 6; Cali-
fornia Geological Survey, 2019). More recently, the 2013 M5.7
understanding of the geology and structure in the area around
Canyondam earthquake near Lake Almanor (see fig. 1 for loca-
Burney, northeastern California. The new data are a substantial
tion) produced more damage than expected for the magnitude of
improvement over existing data and reveal a prominent north-
the earthquake (Chapman and others, 2016).
northwest-trending magnetic grain that allows extension of
This area is of interest to geologists because it lies at or
mapped faults, delineation of plutons within the Mesozoic
near the intersection of multiple geologic provinces in northern
basement in the northern Sierra Nevada, and linear anomalies
California (Langenheim and others, 2016). The southern part of
that limit the amount of strike-slip offset along various faults in
the aeromagnetic survey encompasses the northernmost expo-
the area.
sures of the Sierra Nevada Batholith, which is part of the larger
Sierra Nevada–Great Valley Block. The aeromagnetic survey
covers the area east of Lassen Peak and Mount Shasta, located at
Introduction the south end of the Cascade arc, and possibly across the poorly
delineated south end of the Oregon Coast Block. The survey
An aeromagnetic survey was conducted to promote further also extends across the westernmost part of the extensional
understanding of the geology and structure in the area of Burney Basin and Range geologic province. The Walker Lane, a zone of
in northeastern California, serving as a basis for geophysical right-lateral shear east of the Sierra Nevada–Great Valley Block,
interpretations and supporting geologic mapping, water-resource encroaches into the area of the survey. The amount of right-lateral
investigations, and volcanic- and seismic-hazard assessments. offset for the shear zone is unknown in this area, although faults
Although this area is sparsely populated, it contains some of the in the northern Walker Lane have been suggested to have as much
largest fresh-water springs in the United States (Meinzer, 1927). as 30 kilometers (km) of displacement (Wesnousky, 2005; Faulds
These springs contribute more than 50 percent of the peren- and others, 2005). A linear, uninterrupted aeromagnetic boundary
nial flow of the Pit River (Davisson and Rose, 2014), which is in the eastern Klamath Mountains was used to preclude substan-
the largest tributary to Shasta Lake, which in turn is the largest tial, discrete right-lateral offsets along individual faults in that
reservoir in California. The Pit River is a substantial tributary area (Langenheim and others, 2016), but the existing aeromag-
of the Sacramento River, which is the largest and longest river netic data at that time lacked sufficient resolution to address that
in the state. The springs are hosted within the areally extensive question in the main survey area.
volcanic rocks of mostly Tertiary and Quaternary age that blanket
the survey area (fig. 1). The volcanic rocks are of tholeiitic and
calc-alkaline affinity, reflecting the influence of Basin and Range Data
extension and the Cascade Subduction Zone in this area (Clynne
and Muffler, 2017). A couple of the flows are young, with flows The aeromagnetic survey (fig. 1) was flown over parts of
of the Hat Creek Basalt and the basalt of Giant Crater dated at the McArthur, Burney, Eagle Lake, Susanville, Alturas, and
24±6 (thousand years ago) ka (Turrin and others, 2007; refined to Lake Almanor 1:100,000-scale quadrangles, totaling an area of
23.8±1.4 ka by Rood and others, 2015) and 12,430 years before approximately 13,190 square kilometers (km2). Data-collection
present (yr B.P.) (Donnelly-Nolan, 2010), respectively. and -processing to total-field anomalies was carried out by
Seismic hazards are a concern in this area, as many of New-Sense Geophysics Ltd., on contract to the U.S. Geologi-
these Quaternary volcanic rocks, including the Hat Creek and cal Survey. Total-field aeromagnetic data were collected along
Giant Crater flows, are offset by faults (fig. 1). Despite the east-west-oriented flight lines, spaced 800 meters (m) apart, from
area’s low population, substantial infrastructure, including dams October to December 2017. Distance between measurements
along the Pit River, are at risk. Although seismicity is generally along a flight line was about 8 m. North-south-oriented tie lines
1−122° −121°
41°30'
River Alturas
Pit
299
89
395
Big
Valley
KLAMATH
MOUNTAINS
b c
a
41°
Fall River
Mills Ma
del
ine
Burney Plains
Hat Cre
89
299
ek Fau
lt
Eagle
Lake
44 Lassen
40°30' Peak 44
Susanville
36
Chester
36
Lake Di Honey
am Lake
Almanor on
dM
ou
nta
ins
ADA
SA VA
RA NEV 395
CR LL
SIER
AM EY
TH ERN
NOR
EN
40°
TO
99
EXPLANATION 0 10 20 KILOMETERS
Quaternary sediments Paleozoic and Mesozoic Major springs 0 5 10 MILES
rocks
Quaternary volcanic rocks Focal mechanism of 2013
Granitic rocks Canyondam earthquake CALIF.
Tertiary volcanic rocks
Ultramafic rocks Fault
Tertiary sedimentary rocks
Meta-volcanic rocks Highway MAP LOCATION
Cretaceous sedimentary
rocks
Figure 1. Simplified geologic map of area surrounding Burney, California (modified from Jennings and others, 2010), showing location
and focal mechanism of M5.7 2013 Canyondam earthquake discussed in text. White line shows extent of aeromagnetic survey in this
report. Red lines show faults (from U.S. Geological Survey and California Geological Survey, 2006). Offset pairs of half arrows show
location of magnetic anomalies that are not disrupted by strike-slip offset discussed in text. Magnetic anomalies (a, b, c) are discussed
in text. Abbreviations: BB, Bogard Buttes; Br, Brush Mountain; BS, Burney Spring Mountain; CM, Chalk Mountain; RM, Roop Mountain;
SM, Saddle Mountain; WPP, West Prospect Peak. Shaded-relief base, drainage, and roads from U.S. Geological Survey (2019).
were spaced 8,000 m apart. Although the specified survey height considerations due to steep slopes and inclement weather, most
of the aircraft above the ground was 305 m, the average height of notably south of latitude 40°20' (fig. 2). In this area, and in other
the aircraft was approximately 430 m (fig. 2); locally, the aircraft areas adjacent to steep slopes, anomalies are smoother because of
was flown substantially higher than 305 m because of safety the higher flight elevation.
2−122° −121°
41°30'
River Alturas
Pit
Big
Valley
KLAMATH
MOUNTAINS
41°
Fall River
Mills
Burney
Hat Cre
ek fault
Eagle
Lake
Lassen
40°30'
Peak
Susanville
Chester
Lake
Almanor Honey
Lake
ADA
NEV
SA VA
RA
CR LL
SIER
AM EY
N
THER
NOR
40° 0 5 10 15 20 KILOMETERS
EN
TO
0 5 10 MILES
EXPLANATION
270 305 340 375 410 445 480 515 550 585 620 655 690 725 760 795 830 865 900 935 meters above ground
Major springs Fault
Figure 2. Map of area surrounding Burney, California, showing heights of magnetic sensor above ground surface measured by radar altimetry.
Faults (red lines) are from U.S. Geological Survey and California Geological Survey (2006). Drainage from U.S. Geological Survey (2019).
The aeromagnetic measurements were collected using a adjusted for tail sensor lag and diurnal field variations. The base
cesium-vapor magnetometer (Scintrex CS-3) mounted in the magnetometer used to correct the diurnal field variations was a
tail boom of the aircraft. Measurements were corrected for Scintrex CS-3 magnetometer located in magnetically quiet areas
the magnetic effect of the airplane using a triaxial fluxgate at the Fall River Mills and Susanville Municipal Airports (lat
magnetometer. The measurements were adjusted so that the 41.024782° N., long 121.427823° W. and lat 40.375920° N.,
resulting magnetic field shown in the map and in figure 3 is long 120.574952° W., respectively). Further processing included
relatively free of artifacts owing to the plane itself. Data were microleveling using the tie lines and correction for the Earth’s
3A
−122° −121°
41°30'
River Alturas
Pit
299
89
395
Big
Valley
KLAMATH
MOUNTAINS
b c
a
SM
41°
Fall River Ma
Mills del
ine
Burney
Hat Cre Plains
299
ek fault
Eagle
Lake
44 Lassen
40°30'
Peak
Susanville
Chester
36
Lake Di
Almanor am Honey
on
dM Lake
ou
nta
ins
ADA
SA
RA NEV 395
CR ALL
SIER
AM EY
N
V
THER
40°
NOR
EN
TO
99
0 5 10 15 20 KILOMETERS
EXPLANATION 0 5 10 MILES
−1,200 −1,050 −900 −750 −600 −450 −300 −150 0 150 300 450 600 750 900 1,050 1,200 1,350 1,500 1,650 nT
Major springs Fault Highway
Figure 3. Colored shaded-relief-aeromagnetic maps of area surrounding Burney, California (nT, nanotesla[s]); shaded
relief highlights the grain of magnetic anomalies. Thick white line shows extent of aeromagnetic survey in this report. Red
lines show faults (from U.S. Geological Survey and California Geological Survey, 2006). Offset pairs of half arrows show
location of magnetic anomalies that are not disrupted by strike-slip offset discussed in text. Magnetic anomalies (a, b,
c) are discussed in text. Abbreviations: BB, Bogard Buttes; Br, Brush Mountain; BS, Burney Spring Mountain; CM, Chalk
Mountain; RM, Roop Mountain; SM, Saddle Mountain; WPP, West Prospect Peak. Drainage and roads from U.S. Geological
Survey (2019). A, Aeromagnetic map that is based on previous surveys (North American Magnetic Anomaly Group, 2002). B,
Aeromagnetic map from data collected in this report and, in southwest corner (thin white outline), from Langenheim (2015).
4B
−122° −121°
41°30'
River Alturas
Pit
299
89
395
Big
Valley
KLAMATH
MOUNTAINS
b c
a
41°
Fall River Ma
Mills del
ine
Plains
Burney
Hat Cre
299
ek fault
Eagle
Lake
44 Lassen
40°30'
Peak
Susanville
Chester
36
Lake Di
Almanor am Honey
on
dM Lake
ou
nta
ins
ADA
NEV
SA VA
395
RA
CR LL
SIER
AM EY
N
THER
40°
NOR
EN
TO
99
0 5 10 15 20 KILOMETERS
EXPLANATION 0 5 10 MILES
−1,200 −1,050 −900 −750 −600 −450 −300 −150 0 150 300 450 600 750 900 1,050 1,200 1,350 1,500 1,650 nT
Major springs Fault Highway
Figure 3. Continued
main magnetic field (International Geomagnetic Reference Field; The new data provide a considerable improvement on
see Langel, 1992), updated to the period during which the data preexisting data (fig. 3A), which consisted of profiles flown 1.6
were collected (October 3 to December 1, 2017). km apart at a constant altitude of 2,740 m (Couch and Gemperle,
The resulting data from the survey were transformed to a 1982). The dataset was compiled from information collected
Universal Transverse Mercator projection (base latitude, 0°; central at too high of an elevation over valley areas to measure short-
meridian, 123° W.) and interpolated to a square grid, using a grid wavelength anomalies associated with near-surface or exposed
interval of 200 m and the principle of minimum curvature (Briggs, sources, such as volcanic rocks. Although aeromagnetic profiles
1974). Accuracy of these survey data is 1 nanotesla (nT) or better. were flown closer to the ground (120 m) by the National Uranium
5Resource Evaluation Program (Hill and others, 2009), these lines Burney Springs Mountain, Chalk Mountain, and Saddle Moun-
were flown too far apart (4,800 m) to effectively map the magnetic tain (figs. 1 and 3); the magnetic polarity of the rocks that form
field between the lines. The map (on map sheet; see also, fig. 3B) these volcanoes determines whether the edifice is marked by a
reveals substantially more short-wavelength magnetic anomalies, positive or negative anomaly and may help constrain the age
which are associated with Cenozoic volcanic rocks. of the feature (Langenheim and others, 2016). Another semi-
circular low at Roop Mountain (figs. 1, 3) is consistent with a
nearby age of 3.9±0.2 millions of years ago (Ma) (Grose and
others, 2014). However, a prominent volcano does not always
Filtering and Magnetization Boundaries correspond to a simple magnetic high or low, which perhaps is
indicative of complexity within the volcanic stratigraphy that
To help delineate structural trends and gradients expressed makes up the volcano.
in the magnetic fields, a computer algorithm was used to locate These semicircular anomalies are considerably sharper in the
the maximum horizontal gradient (Cordell and Grauch, 1985; new data. For example, the magnetic low associated with Brushy
Blakely and Simpson, 1986). Faults beneath valley areas or thin Mountain is more elongate; furthermore, the filtered data reveal
basalt flows can be mapped using horizontal gradients in the a very small magnetic high within the low. This small magnetic
magnetic fields, particularly where Cenozoic volcanic rocks are high, which was not discernible in the earlier, lower resolution
offset by faults. Magnetization boundaries were calculated on a data, supports the interpretation from paleomagnetic data that the
filtered version of the magnetic field to isolate anomalies caused bulk of the volcano is reversed polarity, except for the top of the
by shallow sources (Blakely, 1995). First, the magnetic field was edifice, which consists of normal-polarity flows.
upward-continued in elevation by100 m and subtracted from the The new data also reveal that some of these semicircular
original magnetic field. This procedure emphasizes those parts of anomalies are, in fact, more complicated; in this case, they are
the magnetic field that are caused by the shallow (generally, in the bisected by narrow, linear magnetic highs (see, for example,
uppermost 1 km) parts of the magnetic bodies, which are most anomaly b in figs. 3, 4, and Langenheim and others, 2016). The
closely related to the mapped geology. This residual magnetic narrow anomaly is likely fault related and may be related to a
field emphasizes more subtle features (fig. 4), which may not short, mapped Quaternary fault a few kilometers to the south.
be readily apparent in the unfiltered aeromagnetic map. Second, Linear, narrow magnetic anomalies are often associated with
the resulting residual aeromagnetic field was mathematically mapped Quaternary faults, most notably along the Hat Creek
transformed into magnetic potential anomalies (Baranov, 1957); Fault. Similar linear magnetic highs across Fall River Valley can
this procedure effectively converts the magnetic field to the be interpreted as faults concealed beneath the young sedimen-
equivalent “gravity” field that would be produced if all magnetic tary deposits.
material were replaced by proportionately dense material. This Sedimentary rocks are, in general, weakly magnetic. A
procedure also removes the dipolar effect of the Earth’s magnetic
relatively smooth magnetic field coincides with areas of sedi-
field and shifts the anomalies over their sources, using an inclina-
mentary cover, such as Fall River Valley and Big Valley and,
tion and declination of the main magnetic field of 64° and 15°,
to some extent, the Madeline Plains (figs. 1, 3B). Big and Fall
respectively. The horizontal gradient of the magnetic potential
River Valleys coincide with gravity lows that have amplitudes of
field was then calculated everywhere by numerical differentia-
20 milligals (mGal) (Langenheim and others, 2016), indicating
tion. The locations of the locally steepest horizontal gradient
that these areas are underlain by thick sedimentary fill. This is
(see map sheet) were determined by numerically searching for
consistent with the attenuation of the magnetic anomalies in these
maxima in the horizontal gradient grid (Blakely and Simpson,
areas because the magnetic source rocks are concealed by thick,
1986). Gradient maxima are present approximately over steeply
nonmagnetic sedimentary fill. A gravity low of about 10 mGal
dipping contacts that separate rocks of contrasting magnetiza-
coincides with part of the Madeline Plains, although the mea-
tions. For moderate to steep dips (45˚ to vertical), the horizontal
surements are widely spaced and, thus, the amplitude and areal
displacement of a gradient maximum from the top edge of an
extent of the gravity anomaly are poorly constrained. Smoother
offset horizontal layer is always less than or equal to the depth to
magnetic anomalies also coincide with extensive outcrops of
the top of the source (Grauch and Cordell, 1987).
Paleozoic and Mesozoic metasedimentary rocks in the northern
Sierra Nevada and eastern Klamath Mountains, although the
greater height of the survey above both areas also contributes to
Preliminary Results the smoothing and broadening of magnetic anomalies. As in the
eastern Klamath Mountains, magnetic highs in the northern Sierra
Magnetic anomalies are generally caused by magnetite- Nevada generally coincide with Mesozoic metavolcanic rocks.
bearing rocks, which are often igneous. Much of the area is Granitic rocks in the Diamond Mountains are associated with
characterized by short-wavelength, narrow, north-northwest- broad magnetic highs that are encircled by narrow magnetic highs
trending magnetic anomalies (parallel to the structural and topo- of even greater amplitude. These narrow highs may have origins
graphic grain) that are present over extensive areas of volcanic similar to the intense magnetic highs that encircle other Sierra
rocks. The structural grain is interrupted locally by prominent Nevada Plutons, such as the Bald Rock Pluton about 60 km to the
semicircular magnetic highs and lows. Several of these highs southwest, attributed to contact metamorphism and intermingling
and lows are ascribed to young lava cones or shield volcanoes, of magnetic country rock. The semicircular rings suggest that at
such as Bogard Buttes, West Prospect Peak, Brush Mountain, least two plutons are present within the Diamond Mountains.
6−122° −121°
41°30'
River Alturas
Pit
Big
Valley
KLAMATH
MOUNTAINS
b c
a
41°
Fall River Ma
Mills del
ine
Plains
Burney
Hat Cre
ek fault
Eagle
Lake
Lassen
40°30'
Peak
Susanville
Chester
Lake Di
Almanor am Honey
on
dM Lake
ou
nta
ins
ADA
NEV
SA
RA
CR ALL
SIER
AM EY
N
V
THER
40°
NOR
EN
TO
0 5 10 15 20 KILOMETERS
EXPLANATION 0 5 10 MILES
−48 −42 −36 −30 −24 −18 −12 −6 0 6 12 18 24 30 36 42 48 54 60 66 nT
Major springs Fault
Figure 4. Colored shaded-relief-aeromagnetic map of area surrounding Burney, California, filtered to enhance shallow
sources (nT, nanotesla[s]). Red lines show faults (from U.S. Geological Survey and California Geological Survey, 2006).
Offset pairs of half arrows show location of magnetic anomalies that are not disrupted by strike-slip offset discussed in
text. Magnetic anomalies (a, b, c) are discussed in text. Abbreviations: BB, Bogard Buttes; Br, Brush Mountain; BS, Burney
Spring Mountain; CM, Chalk Mountain; RM, Roop Mountain; SM, Saddle Mountain; WPP, West Prospect Peak. Drainage
from U.S. Geological Survey (2019).
7The new data also reveal a couple of long, linear, east- the Pacific-North American plate boundary: Geology, v. 6, p.
west-trending magnetic anomalies that do not coincide with 505–508.
topographic and geologic features (figs. 1, 3, 4). The southern- Grauch, V.J.S., and Cordell, L., 1987, Limitations of determining
most of these is not evident in the older data. These anoma- density or magnetic boundaries from the horizontal gradient of
lies cross several mapped Quaternary faults without showing gravity or pseudogravity data: Geophysics, v. 52, p. 118–121.
substantial (>2 km) apparent right-lateral offset. A possible Grose, T.L.T., Saucedo, G.J., and Wagner, D.L., 2014, Preliminary
exception is the fault zone that cuts across the western part of geologic map of the Susanville 30'×60' quadrangle, California:
the Madeline Plains, where a magnetic high appears to be offset California Geological Survey, Preliminary Geologic Map, scale
by about 5 km. 1:100,000, 25 p.
Hill, P.L., Kucks, R.P., and Ravat, D., 2009, Aeromagnetic and
aeroradiometric data for the conterminous United States and
Alaska from the National Uranium Resource Evaluation Pro-
References Cited gram of the U.S. Department of Energy: U.S. Geological Survey
Open-File Report 2009–1129, accessed May 22, 2015, at https://
Baranov, V.I., 1957, A new method for interpretation of aeromag-
doi.org/10.3133/ofr20091129.
netic maps—Pseudo-gravimetric anomalies: Geophysics, v. 22,
Jennings, C.W., Gutierrez, C., Bryant, W., Saucedo, G., and Wills,
p. 359–383.
C., 2010, Geologic map of California: California Geologi-
Blakely, R.J., 1995, Potential theory in gravity and magnetic
cal Survey, California Geological Survey Data Map 2, scale
applications: Cambridge, England, Cambridge University Press,
1:750,000.
441 p.
Langel, R.A., 1992, International geomagnetic reference field—
Blakely, R.J., and Simpson, R.W., 1986, Approximating edges of
The sixth generation: Journal of Geomagnetism and Geoelec-
source bodies from magnetic or gravity anomalies: Geophysics,
tricity, v. 44, p. 679–707.
v. 51, p. 1494–1498.
Langenheim, V.E., 2015, Aeromagnetic survey map of Sacramento
Briggs, I.C., 1974, Machine contouring using minimum curvature:
Valley, California: U.S. Geological Survey Open-File Report
Geophysics, v. 39, p. 39–48.
2015-1186, scale 1:400,000, accessed January 15, 2016 at
California Geological Survey, 2019, Historic Earthquake Online
https://doi.org/10.3133/ofr20151186.
Database: California Geological Survey website, accessed July
Langenheim, V.E., Jachens, R.C., Muffler, L.P.J., and Clynne,
2, 2017, at https://maps.conservation.ca.gov/cgs/historicearth-
M.A., 2016, Implications for the structure of the Hat Creek
quakes/.
graben and transfer of right-lateral shear from the Walker Lane
Chapman, K., Gold, M.B., Boatwright, J., Sipe, J., Quitoriano,
north of Lassen Peak, northern California, from gravity and
V., Dreger, D., and Hardebeck, J., 2016, Faulting, damage,
magnetic anomalies: Geosphere, v. 12, p. 790–808.
and intensity in the Canyondam earthquake of May 23, 2013:
Meinzer, O.E., 1927, Large springs in the United States: U.S. Geo-
U.S. Geological Survey Open-File Report 2016–1145, 49
logical Survey Water-Supply Paper 557, 94 p.
p., accessed February 20, 2019 at https://doi.org/10.3133/
North American Magnetic Anomaly Group, 2002, Digital data
ofr20161145.
grids for the magnetic anomaly map of North America: U.S.
Clynne, M.A., and Muffler, L.J.P., 2017, Geologic field-trip guide
Geological Survey Open-File Report 02-0414, accessed Decem-
to the Lassen segment of the Cascades Arc, northern Califor-
ber 15, 2020 at https://pubs.usgs.gov/of/2002/ofr-02-414.
nia: U.S. Geological Survey Scientific Investigations Report
Rood, D., Amidon, W., McKeon, R., Baldwin, J., Gray, B., Page,
2017–5022–K2, 65 p., accessed June 6, 2019 at https://doi.
W., and Farley, K., 2015, Paleoseismic assessment of the Hat
org/10.3133/sir20175022K2.
Creek fault using cosmogenic He-3 surface exposure dating in
Cordell, L., and Grauch, V.J.S., 1985, Mapping basement magne-
basalt, northeastern California—A proof of concept study [abs.]:
tization zones from aeromagnetic data in the San Juan Basin,
San Francisco, Calif., December 14–18, 2015, American Geo-
New Mexico, in Hinze, W.J., ed., The utility of regional gravity
physical Union, Fall Meeting, abstract T42A-01.
and magnetic anomaly maps: Tulsa, Okla., Society of Explora-
Turrin, B.D., Muffler, L.J.P., Clynne, M.A., and Champion, D.E.,
tion Geophysicists, p. 181–197.
2007, Robust 24±6 ka 40Ar/39Ar age of a low-potassium tholei-
Couch, R., and Gemperle, M., 1982, Aeromagnetic measurements itic basalt in the Lassen region of NE California: Quaternary
in the Cascade Range and Modoc Plateau of northern Califor- Research, v. 68, p. 96–110.
nia—Report on work done from June 1, 1980, to November 30, U.S. Geological Survey, 2019, The National Map, accessed Febru-
1980: U.S. Geological Survey Open-File Report 82–932, 23 p. ary 15, 2019, at https://viewer.nationalmap.gov/basic.
Davisson, M.L., and Rose, T.P., 2014, Recharge and flow in the U.S. Geological Survey and California Geological Survey, 2006,
Medicine Lake volcano—Fall River Springs groundwater basin, Quaternary fault and fold database for the United States: U.S.
California: Environmental Forensics, v. 15, p. 66–77. Geological Survey website, accessed February 22, 2012, at
Donnelly-Nolan, J.M., 2010, Geologic map of Medicine Lake https://doi.org/10.5066/F7S75FJM.
volcano, northern California: U.S. Geological Survey Scientific Wesnousky, S.G., 2005, The San Andreas and Walker Lane fault
Investigations Map 2927, 2 sheets, scale 1:50.000, pamphlet 48 systems, western North America—Transpression, transtension,
p., accessed May 15, 2019 at https://doi.org/10.3133/sim2927. cumulative slip and the structural evolution of a major trans-
Faulds, J.E., Henry, C.D., and Hinz, N.H., 2005, Kinematics of form plate boundary: Journal of Structural Geology, v. 27, p.
the northern Walker Lane—An incipient transform fault along 1505–1512.
8You can also read