Alteration of immune profiles is associated with pulmonary function and symptoms in patients with chronic obstructive pulmonary disease
←
→
Page content transcription
If your browser does not render page correctly, please read the page content below

Molecular Medicine REPORTS 24: 742, 2021

                         Alteration of immune profiles is associated with
                         pulmonary function and symptoms in patients
                          with chronic obstructive pulmonary disease
                  SIXIANG LI1*, SHUANG ZHAO1*, ZHENRU WU2, FANGFANG WANG3 and WEIMIN LI1

                     1
                   Department of Respiratory and Critical Care Medicine, 2Pathology Research Laboratory and
         3
          Hematology Research Laboratory, West China Hospital, Sichuan University, Chengdu, Sichuan 610041, P.R. China

                                         Received October 30, 2019; Accepted June 10, 2021

                                                    DOI: 10.3892/mmr.2021.12382

Abstract. Inflammation serves a key role in chronic obstruc‑           pulmonary function, and a negative correlation with smoking
tive pulmonary disease (COPD). However, changes in the                 and exacerbations. Furthermore, neutrophils and MPS were
immune profiles of patients with COPD remain unclear. The              negatively associated with pulmonary function, and IL‑8 was
present prospective observational study aimed to determine the         positively associated with cough. There was also a negative
expression profiles of immune cells and inflammatory factors           association between CRP and IL‑17A with pulmonary function
of patients with COPD and healthy controls, and to analyze the         but a positive correlation with symptoms and exacerbation.
relationship between immune profiles and smoking history. A            Club cell secretory protein was also negatively associated
total of 140 subjects were enrolled in the present study between       with emphysema parameters. In conclusion, the present find‑
September 2018 and April 2019 at West China Hospital                   ings revealed significant differences in profiles of immune
of Sichuan University (Chengdu, China). These included                 factors among patients with COPD, smokers and non‑smoking
87 patients with stable COPD and 24 patients with acute                controls and their association with clinical characteristics.
exacerbated COPD, as well as 29 healthy controls. Baseline             The clinical trial registration number of the present study is:
characteristics were recorded during the screening period, and         ChiCTR1800015700 (registered with http://www.chictr.org.
levels of immune cells were examined using flow cytometry.             cn/index.aspx, 2018/04/16).
In addition, levels of inflammatory factors were measured
using ELISAs. The results revealed increased expression of             Introduction
the CD64 +/CD14 + mononuclear phagocyte system (MPS)
and CD16+CD66+ neutrophils, and decreased expression of                Chronic obstructive pulmonary disease (COPD) ranks fourth
CD3+CD4+ T cells and CD3+ CD8+ T cells (all P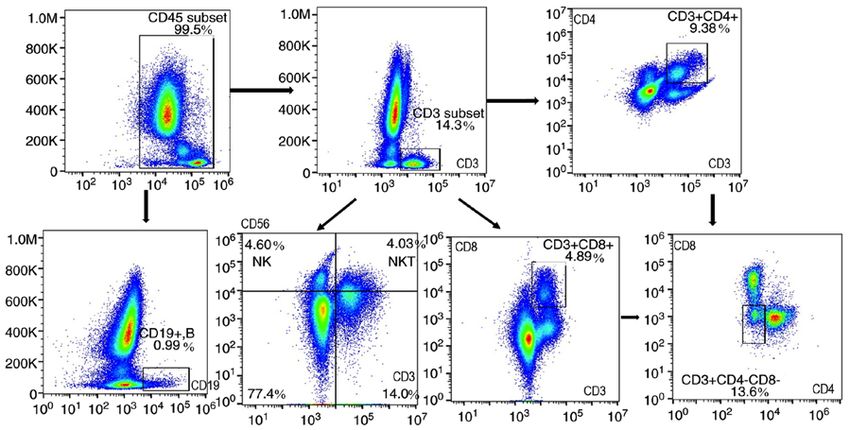
2                LI et al: immune profiles ARE associated with pulmonary function in patients with copd

enabled identification of several positive feedback loops,          respiratory disease. For those patients for whom pulmonary
such as M1 and M2 transformation and balance, as well as            function test and chest CT scan were not performed, medical
network elements, and these have served a determinant role in       reports for the past year were required. COPD was defined
CS‑induced immune response and COPD progression (10,11).            according to international guidelines (2), while severity of
An increased proportion of infiltrating macrophages, as             airflow obstruction was graded using current Global Initiative
well as a reduction of CD4 + and CD8 +T cells, are both             for Chronic Obstructive Lung Disease criteria (2). A total of
independently associated with smoking status or the level of        29 healthy controls (18 non‑smokers and 11 smokers, 18 male,
airflow limitation (10,11). CRP is associated with elevation        11 female, age: Mean ± SEM 64.15±1.34) were recruited at
of acute exacerbated COPD (AECOPD), while CRP‑guided                the Physical Examination Center of West China Hospital
prescription of antibiotics for AECOPD results in less use of       (Chengdu, China) using the following inclusion criteria:
antibiotics with no evidence of harm (12). Levels of IL‑6 are       i) Pulmonary function test (FEV1/FVC
Molecular Medicine REPORTS 24: 742, 2021                                               3

CD3 Monoclonal Antibody, PE, human, cat. no. 12‑0038‑42;            variables among different groups. Kruskal Wallis and Dunn's
C D 8 M o n o clo n a l A n t i b o d y, A P C ‑ c y7, h u m a n,   post hoc test were used for comparisons of non‑normally
cat. no. A15448; CD4 Monoclonal Antibody, FITC, human,              distributed continuous variables among different groups. In
cat. no. 11‑0049‑42; CD56 Monoclonal Antibody, PE‑cy7,              addition, χ2 and Bonferroni's correction were used for cate‑
human, cat. no. 25‑0567‑42; CD19 Monoclonal Antibody,               gorical variables. Pearson's correlation was used to assess the
APC, human, cat. no. 17‑0199‑42; CD45 Monoclonal                    relationship among continuous variables, while Spearman's
Antibody, PE‑cy 5.5, human, cat. no. 35‑0459‑42), and cells         correlation test was used for categorical data. Figures were
were stained according to the manufacturer's recommenda‑            generated using FlowJo version 10.0.7 software (FlowJo LLC)
tions. All the antigens were human source and stored at 4˚C         and GraphPad Prism 8 (GraphPad Software, Inc.). P
4                LI et al: immune profiles ARE associated with pulmonary function in patients with copd

Table I. Clinical baseline characteristics of patients with COPD, patients with AECOPD and healthy controls.

Baseline features                                  COPD (n=87)         AECOPD (n=24)           Healthy controls (n=29)        P‑value

Age, years (mean ± SEM)                 64.94±0.97   67.00±2.13   64.15±1.34 0.519
Male, n (%)                              62 (76.7)    17 (75.0)    18 (62.7) 0.444
BMI (mean ± SEM)                        22.05±0.58   19.70±1.75   21.23±1.48 0.299
Smoking history, n (%)                   66 (75.9)    15 (62.5)    11 (37.9) 0.001a
Smoking amount, pack‑year (mean ± SEM)  31.59±3.26   22.38±4.23    9.71±3.57 0.001a
Exacerbation, n (%)                      51 (58.62)    24 (100)		            0.001a
Pulmonary function
 No. of patients analyzed (n)                78           16           22
 FEV1/FVC (mean ± SEM)                  50.94±1.24   46.74±2.32   78.91±1.37 0.001a
 FEV1% (mean ± SEM)                     51.83±2.44   40.22±4.47   96.23±2.27 0.001a
 RV/TLC (mean ± SEM)                   142.14±8.61  145.06±14.72 110.58±4.34 0.281
 MMEF75/25 (mean ± SEM)                 22.45±1.78   13.49±1.87   71.52±3.42 0.001a
GOLD stage
              b

 No. of patients analyzed                    84           22
 A, n (%)                                23 (27.38)    0 (0.00)		            0.001a
 B, n (%)                                22 (26.19)   3 (13.64)		            0.001a
 C, n (%)                                 8 (9.52)     1 (4.54)		            0.001a
 D, n (%)                                31 (36.9)   18 (81.82)		            0.001a
Stage of Airflow limitation
                           b

 No. of patients analyzed                    80           18
 I (mild), n (%)                         12 (15)       1 (5.56)		            0.001a
 II (moderate), n (%)                    27 (33.75)    1 (5.26)		            0.001a
 III (severe), n (%)                     18 (22.5)     7 (38.89)		           0.001a
 IV (very severe), n (%)                 23 (28.75)    9 (50)		              0.001a
Assessments
 No. of patients analyzed                    84           20
 mMRC (mean ± SEM)                       2.24±0.11    3.61±0.14		            0.001a
 Cough (mean ± SEM)                      1.88±0.14    2.09±0.45		            0.528
 Sputum (mean ± SEM)                     5.22±0.33    5.64±0.28		            0.724
Drug therapy
 No. of patients analyzed                    84           20
 0 (none), n (%)                         15 (17.86)     0 (0)
 1 (LAMA/LABA), n (%)                      8 (9.52)     0 (0)
 2 (LABA+ICS), n (%)                     13 (15.48)     3 (15)
 3 (LAMA+LABA+ICS), n (%)                53 (63.29)     9 (45)
 4 (LAMA+LABA), n (%)                      3 (3.57)     8 (40)
a
 P
Molecular Medicine REPORTS 24: 742, 2021 5 Figure 1. Flowchart of mononuclear phagocyte system antigen staining of flow cytometry. Ratio of CD14+, CD64+ monocyte and CD16+CD66+ neutrophils among CD45+ leukocytes (%). FSC, forward scatter; SSC, side scatter; MON, monocyte; NEU, neutrophil. Figure 2. Flowchart of lymphocytes antigen staining of flow cytometry. Ratio of CD3+CD4+ T cells, CD3+CD8+T cells, CD3+CD4 ‑CD8‑T cells (γδT cells), CD3+CD56+ NKT cells, CD3‑CD56+NK cells and CD19+ B cells among CD45+ leukocytes (%). NKT, natural killer T; NK, natural killer. with COPD and smoking controls compared with non‑smoking non‑smoking control, 3.58 vs. 2.03%). Furthermore, the levels controls (smoking COPD vs. non‑smoking COPD vs. smoking of CD19+ B lymphocytes, CD3+CD56+ NKTs and CD3‑CD56+ controls vs. non‑smoking controls: 5.15 vs. 5.98 vs. 5.33 vs. NKs were not significantly different among the four groups. 9.11%). While CD66+CD16+ neutrophils (smoking COPD vs. non‑smoking COPD vs. smoking controls vs. non‑smoking Inflammatory biomarkers. Higher IL‑6 (COPD vs. AECOPD vs. controls: 68.83 vs. 64.99 vs. 66.41% vs. 56.04%) MON (CD14+ controls, 6.95 vs. 20.51 vs. 3.82), IL‑1β (COPD vs. AECOPD vs. and CD64+ subsets) were more highly expressed in patients controls, 6.69 vs. 7.24 vs. 4.09) and TGF‑α (COPD vs. AECOPD with COPD and smoking controls compared with non‑smoking vs. controls, 2.15 vs. 2.20 vs. 1.46) levels were observed in the controls (Table III). CD14+CD64+ MON levels were increased COPD and AECOPD groups compared with healthy controls. in smokers compared with non‑smokers (smoking COPD The levels of TNF‑α (AECOPD vs. COPD vs. controls, 21.71 vs. non‑smoking COPD, 3.49 vs. 2.86%; smoking control vs. vs. 11.23 vs. 8.56), IFN‑γ (AECOPD vs. COPD vs. controls,
6                 LI et al: immune profiles ARE associated with pulmonary function in patients with copd

Table II. Peripheral blood immune profiles of patients with COPD, patients with AECOPD and healthy controls.

                                                             COPD                 AECOPD              Healthy control
Immune profiles                                           (mean ± SEM)          (mean ± SEM)          (mean ± SEM)           P‑value

Immune cellsa, %
 CD3+ T cell                                      14.01±1.08    11.90±0.9         20.11±2.04b,c                               0.001e
 CD3 CD4 T cell
      +   +
                                                    9.04±0.53c
                                                                  6.50±0.89b
                                                                                  12.36±1.06b,c                               0.001e
 CD3 CD8 T cell
      +   +
                                                    5.55±0.36     4.70±0.47         7.85±0.97b,c                              0.004
 CD4/CD8                                            1.97±0.13c
                                                                  1.47±0.21b
                                                                                    1.89±0.17                                 0.160
 CD3+CD4‑CD8‑γδT cell                              1.13±0.17     1.46±0.45         1.40±0.23                                  0.586
 CD3+CD56+ NKT                                      2.88±0.24     3.01±0.32         2.93±0.48                                 0.976
 CD3‑CD56+ NK                                      5.85±0.42     5.90±0.71         6.27±0.76                                  0.877
 CD19+ B cell                                       2.11±0.25c    1.69±0.20b        2.01±0.34                                 0.723
 CD66+CD16+ NEU                                   67.82±1.29    68.21±2.6         59.36±1.18b,c                               0.011
 CD14+ MON                                         4.19±0.26     4.57±0.33         3.04±0.41b,c                               0.027
 CD64 MON
        +
                                                   3.94±0.26     4.53±0.53         2.85±0.37b,c                               0.026
 CD14 CD64
        +    +
                                                    3.19±0.23     3.82±0.38         2.53±0.37c                                0.070
Inflammatory factors, pg/ml (by multi‑plex panel)
 IL‑6                                               6.95±1.16   20.51±3.59b,d       3.82±1.14b,c                              0.001e
 TNF‑α                                            11.23±1.79    21.71±3.31b,d       8.56±2.09c                                0.023
 IL‑1β                                              6.69±1.33     7.24±1.20         4.09±1.00c                                0.044
 IFN‑γ                                            11.91±1.80     29.1±10.79  b,d
                                                                                  10.32±1.45c                                 0.032
 IL‑8                                             17.58±3.71    53.39±14.61  b,d
                                                                                  12.87±3.11c                                 0.008e
 IL‑33                                            11.10±2.27    25.56±11.17d        6.11±1.98c                                0.029
 IL‑17A                                             4.57±0.60     9.56±0.89b,d
                                                                                    4.15±1.02c                                0.047
 IL‑4                                             18.58±3.29    12.23±1.28        17.08±2.55                                  0.595
 IL‑5                                             12.18±1.04    12.71±1.13          11.5±0.6                                  0.843
 IL‑13                                            19.27±0.87    20.27±1.71        17.15±1.92                                  0.296
 TGF‑α                                              2.15±0.57     2.20±0.73         1.46±0.25b,c                              0.006
 GRO‑α                                            223.3±33.5 c
                                                                382.7±135 4
                                                                          . b
                                                                                  323.1±78.1                                  0.065
 SP‑D                                              6671±926.7    7122±2273         7767±1948                                  0.800
 MPO                                               8856±843.8    7201±1084         8911±1156                                  0.405
 MMP‑9                                           10627±1901    6852.9±1367       7019.7±905                                   0.377
Inflammatory factors, pg/ml (by ELISA)
 CC16                                             18.77±1.31c   34.03±12.43b      19.43±3.76                                  0.342
 Fibrinogen                                       841.2±55.65   716.4±76.07       778.7±71.67                                 0.211
 NE                                               499.3±80.34   742.5±267.1       634.8±178.6                                 0.432
 CRP                                               1882±412.4   4395±915.9b,d      2020±958.6c                                0.010
 TGF‑β                                            40.61±3.8     39.51±7.53        55.44±10.00                                 0.193
a
 P
Molecular Medicine REPORTS 24: 742, 2021 7
Table III. Peripheral blood immune cells of smoking and non‑smoking subjects.
Smoking Non‑smoking Smoking Non‑smoking
Characteristics COPD (n=73) COPD (n=24) control (n=8) control (n=17) P‑value
Age, years (mean ± SEM) 65.81±0.96 64.27±2.04 63.18±2.94 65.15±1.23 0.715
Male, n (%) 68 (93.15) 8 (33.33) 8 (100.00) 7 (41.18) 0.001a
Pack‑years (mean ± SEM) 40.78±2.88 31.56±7.02 0.327
CD3+ T cell (mean ± SEM) 12.88±0.65 15.43±1.67 15.82±2.57 22.25±2.66b‑d 0.001a
CD3+CD4+ T cell (mean ± SEM) 8.16±0.48 9.42±1.24 11.58±1.95 12.75±1.29b,c 0.003
CD3+CD8+ T cell (mean ± SEM) 5.15±0.31 5.98±0.74 5.33±1.01 9.11±1.30b‑d 0.001a
CD4/CD8 (mean ± SEM) 1.89±0.12 1.82±0.16 2.45±0.40 1.61±0.13 0.296
CD3+CD4‑CD8‑ (mean ± SEM) 1.14±0.19 1.41±0.33 1.06±0.31 1.57±0.30 0.675
CD3+CD56+ NKT (mean ± SEM) 2.91±0.24 2.87±0.39 2.41±0.49 3.19±0.68 0.854
CD3‑CD56+ NK (mean ± SEM) 6.26±0.42 4.71±0.64 5.82±1.41 6.50±0.93 0.268
CD19+ B cell (mean ± SEM) 1.74±0.13c 2.41±0.34b 1.58±0.63 2.23±0.41 0.125
CD66+CD16+ NEU (mean ± SEM) 68.83±1.24 64.99±2.73 66.41±2.85 56.04±4.29b‑d 0.002
CD14+ MON (mean ± SEM) 4.42±0.27 3.85±0.25 4.05±0.69 2.56±0.47b‑d 0.014
CD64+ MON (mean ± SEM) 4.18±0.27 3.75±0.48 3.96±0.73 2.32±0.37b‑d 0.020
CD14+CD64+ (mean ± SEM) 3.49±0.24 2.86±0.32b 3.58±0.66 2.03±0.40b,d 0.029
a
P8 LI et al: immune profiles ARE associated with pulmonary function in patients with copd
Figure 4. Levels of inflammatory factors in patients with COPD, patients with AECOPD and healthy controls. (A) Levels of CRP were increased in the
AECOPD group. (B) Levels of TNF‑α, IFN‑γ and IL‑8 were increased in the AECOPD group. (C) Levels of GRO‑α were increased in the AECOPD group
compared with COPD. (D) Levels of IL‑6 and IL‑17A were increased in the AECOPD group. Data were analyzed using the Kruskal Wallis test and Dunn's post
hoc test. COPD, chronic obstructive pulmonary disorder; AE, acute exacerbated; MPO, myeloperoxidase; SP‑D, pulmonary surfactant‑associated protein D;
CC16, club cell secretory protein; GRO‑α, human growth‑regulated oncogene α; NE, neutrophil elastase.
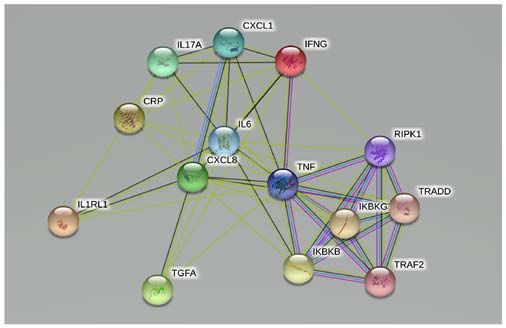
Figure 6. Expansion of protein‑protein interaction network of significant
inflammatory factors. Network‑associated proteins IKBKG, IKBKB,
RIPK1, TRADD and TRAF2 (expanded search) were closely associated
with other factors. IKBKG, including inhibitor of NF‑κ B kinase regulatory
subunit γ; IKBKB, inhibitor of kappa light polypeptide gene enhancer in
B‑cells, kinase β; RIPK1, receptor‑interacting serine/threonine kinase 1;
TRADD, TNF receptor superfamily member 1A associated via death
domain; TRAF2, TNF receptor‑associated factor 2.
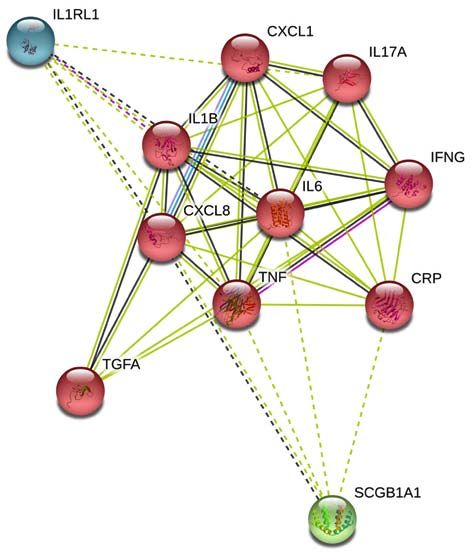
Figure 5. Protein‑protein interaction network of significant inflammatory that immune profiles were different among patients with COPD,
factors (IL‑6, IL‑1β, TNF‑α, IFN‑γ, IL‑8, IL‑33, IL‑17A, TGF‑α, GRO‑α and patients with AECOPD and healthy controls, CRP and IL‑17A
CRP). Network nodes represent proteins (colored nodes: Query proteins and were associated with smoking status.
first shell of interactors), while edges represent protein‑protein associations
A previous study reported an increase in the proportion
[from STRING website, 10 items (human)‑STRING interaction network
(string‑db.org)]. IL‑6, TNF‑α and IL‑8 were predominant in the network of of macrophages (M1‑M2) and a decrease in T‑lymphocytes
significantly different inflammatory factors (triangle). (mainly CD4+T) in lung tissues of current smokers with COPDMolecular Medicine REPORTS 24: 742, 2021 9 Table IV. Pearson correlation coefficient between immune profiles and clinical features. Correlation (r) FEV1/FVC FEV1 FVC RV/TLC TLC MM75/25 CD3+ T cell 0.33 0.27 0.14 0.13 ‑0.10 0.34 CD4+ T cell 0.35 0.28 0.24 ‑0.01 ‑0.15 0.38 CD8+ T cell 0.24 0.13 0.05 0.19 0.02 0.23 CD14+ MPS ‑0.22 ‑0.24 ‑0.19 ‑0.07 ‑0.01 ‑0.24 CD64+ MPS ‑0.14 ‑0.12 ‑0.10 ‑0.12 ‑0.47 ‑0.22 CD16+CD66+ ‑0.26 ‑0.20 ‑0.01 ‑0.17 0.06 ‑0.25 IL‑6 ‑0.19 ‑0.15 0.20 0.02 0.11 ‑0.14 CRP ‑0.21 ‑0.24 ‑0.23 ‑0.04 0.02 ‑0.26 CC16 ‑0.03 ‑0.02 ‑0.07 ‑0.41 ‑0.44 ‑0.05 IL‑8 ‑0.09 ‑0.08 ‑0.18 ‑0.17 0.21 ‑0.07 IL‑17A ‑0.24 ‑0.31 ‑0.28 ‑0.44 0.41 ‑0.26 Fibrinogen ‑0.05 ‑0.04 ‑0.01 ‑0.13 ‑0.13 ‑0.11 MPS, mononuclear phagocyte system; CC16, club cell secretory protein; FEV1, forced expiratory volume in 1 sec; FVC, forced vital capacity; RV, residual volume; TLC, total lung compacity; MMEF75/25, maximal mid expiratory flow. Table V. Spearman's correlation coefficient between immune profiles and clinical features. Correlation coefficient Smoking Exacerbation mMRC Cough CD3+ T cell ‑0.29a ‑0.24a ‑0.04 0.06 CD4+ T cell ‑0.20a ‑0.21 ‑0.17 0.03 CD8+ T cell ‑0.23a ‑0.15 0.20 ‑0.05 CD14+ MPS 0.27a 0.16 0.13 ‑0.04 CD64+ MPS 0.31a 0.10 0.10 ‑0.07 CD16+CD66+ 0.24a ‑0.09 ‑0.06 ‑0.07 IL‑6 0.15 0.22 0.16 0.24a CRP ‑0.62 0.26a 0.26a 0.28a CC16 ‑0.04 0.16 0.18 ‑0.13 IL‑8 0.12 0.14 0.20 0.33a IL‑17A ‑0.24 0.30a 0.14 0.31a Fibrinogen 0.07 ‑0.24 ‑0.21 ‑0.20 MMP‑9 0.07 0.02 ‑0.06 ‑0.33a P
10                LI et al: immune profiles ARE associated with pulmonary function in patients with copd

CD14+/CD64+ MPS) indicated poorer lung function in smokers            The functional and dynamic evolution of various immune
with COPD compared with non‑smoking controls. However, the            components at different stages will need to be explored in
trigger of immune composition changes in non‑smoking patients         future studies. The biomarker panel used was selected from
with COPD remains unclear.                                            available assays, based on possible mechanisms in COPD.
     Blood biomarkers have a significant value in diagnosis and       This panel was heavily weighted towards systemic inflam‑
prognosis of COPD (14). A study on COPD Gene and SPIROMCIS            matory markers, not lung‑specific biomarkers. In addition, a
measured 114 candidate plasma and serum biomarkers using              larger population of participants would be helpful in identi‑
the 13 panel Luminex assays (30). A total of nine cytokines and       fying subgroups to help decrease the heterogeneity. Despite
chemokines were selected for further analysis using a Meso Scale      these limitations, the present study identified COPD and
Discovery platform. These MSD multiplex panels were used              smoking associated immune profiles, and indicated those
to measure Single nucleotide polymorphism in 2,123 subjects           relevant to pulmonary functions and symptoms. Potential
from COPD Gene and 1,117 subjects from SPIROMICS. The                 pathways and genes of the inflammatory molecular network
results indicated a strong association between eotaxin and IL‑6       were also identified.
with airflow obstruction (13). In the present multiplex panel             Overall, the present study revealed changes in the
involving 20 biomarkers, it was identified that IL‑6, TNF‑α and       immune profiles in patients with COPD and smokers. A
IL‑8 (CXCL‑8) served key roles in the inflammation response           decrease in CD3+ T cells and an increase in neutrophils and
network of COPD. Pearson's correlation analysis revealed a close      MPS were also reported. In addition, levels of IL‑6, TNF‑ α,
relationship between CRP and airway airflow obstruction, while        IFN‑γ, IL‑8 IL‑17A and CRP were higher in patients with
CC16 could be a novel marker of emphysema. Furthermore,               AECOPD compared with patients with COPD and healthy
higher levels of IL‑6, CRP, IL‑8 and IL‑17A indicated more            controls. Furthermore, IL‑6, TNF‑ α and IL‑8 (CXCL8)
cough, sputum and dyspnea. Although no biomarker has been             were identified as core biomarkers in COPD pathogenesis,
demonstrated to be useful in the diagnosis of COPD to date, to        while immune profiles were also relevant to pulmonary
the best of our knowledge, blood‑based biomarkers for predicting      functions and symptoms. Future studies will need to recruit
progression of COPD remain relevant (31). The present findings        more patients with COPD in order to validate and expand
may provide novel insights into biomarkers that have potential for    the results. Particular focus should be paid on investigating
prediction and evaluation of COPD pulmonary function, as well         lung‑specific biomarkers to identify more COPD subgroups
as its symptoms, and are expected to be beneficial for develop‑       and help advance novel therapies for COPD.
ment of novel therapies for COPD phenotypes.
     The present study analyzed the interaction among biomarkers,     Acknowledgements
identified the importance of IKBKG, RIPK1, TRADD and
TRAF2 and also investigated IL‑17, TNF and NF‑κB pathway,             The authors thank Professor Dan Liu and Professor Gang
which are associated with inflammatory cell chemotaxis and            Wang of West China Hospital, Chengdu, China, for assis‑
immune response (25). The IL‑17A, TNF and NF‑κB signaling             tance with the patients enrollment and experiments.
pathways have been identified to be important in the inflamma‑
tory response of COPD (32). Fisetin, which inhibits the TNF‑α         Funding
and NF‑κB signaling pathways, could be a good candidate drug
for improving lung function in patients with COPD (33). In addi‑      The study was supported by The National Key Development
tion, IL‑17A‑driven type‑2 inflammation is another endotype           Plan for Precision Medicine Research of China (grant
of COPD, which could be an indicator of steroid‑unresponsive          no. 2017YFC0910004).
subgroup of COPD (34).
     Previous studies have found T helper 17 (Th17) cells, a subset   Availability of data and materials
of CD4+ T cells, to be positively correlated with IL‑17A levels,
which are increased in patients with COPD (35). The present           All data generated or analyzed during this study are included
study reported elevated levels of IL‑17A, although the proportion     in this published article.
of CD4+ T cells was decreased in patients with COPD compared
with healthy controls. A possible reason for this paradox is that     Authors' contributions
Th17 cells could be inhibiting the expansion of CD4+ regulatory
T (Treg) cells (36). An imbalance in Th17/Treg has been reported      SL and SZ conceived the present study, enrolled the subjects,
to serve a pivotal role in COPD development and progres‑              and recorded all the clinical data. ZW assisted in the testing
sion (37). Studies have also demonstrated a negative correlation      of inflammatory factors. FW performed the flow cytometry.
between Th17 cell and Treg cells in patients with COPD (34,38).       WL organized the study, supervised the study and was
It is possible that the lower proportion of Treg cells could have     involved in data aquisition, analysis and interpretation. SL
contributed to the decrease of CD4+ T cells in COPD in the            and SZ confirm the authenticity of all the raw data. All
present study. Furthermore, a positive correlation between Treg       authors reviewed and approved the final manuscript.
proportion and TGF‑β level has been reported (38). However, the
present study did not observe a significant decrease of TGF‑β in      Ethics approval and consent to participate
COPD. Further functional experiments investigating the subset of
immune cells are required to investigate this.                        The study was approved by The Ethics Committee of West
     The present study had several limitations. The wide range of     China Hospital, Sichuan University (Chengdu, China) and all
immune cells should be classified into more detailed subgroups.       patients provided written informed consent.
Molecular Medicine REPORTS 24: 742, 2021 11
Patient consent for publication 20. Rangasamy L, Geronimo BD, Ortin I, Coderch C, Zapico JM,
Ramos A and de Pascual‑Teresa B: Molecular imaging probes based
on matrix metalloproteinase inhibitors (MMPIs). Molecules 24:
Not applicable. 2982, 2019.
21. Stockley RA, Halpin DMG, Celli BR and Singh D: Chronic obstruc‑
tive pulmonary disease Biomarkers and their interpretation. Am
Competing interests J Respir Crit Care Med 199: 1195‑1204, 2018.
22. Graham BL, Steenbruggen I, Miller MR, Barjaktarevic IZ,
The authors declare that they have no competing interests. Cooper BG, Hall GL, Hallstrand TS, Kaminsky DA, McCarthy K,
McCormack MC, et al: Standardization of spirometry 2019 update.
An official American thoracic society and European respiratory
References society technical statement. Am J Respir Crit Care Med 200:
e70‑e88, 2019.
23. Munari AB, Gulart AA, Dos Santos K, Venâncio RS, Karloh M
1. GBD 2017 Causes of Death Collaborators: Global, regional, and and Mayer AF: Modified medical research council dyspnea scale in
national age‑sex‑specific mortality for 282 causes of death in 195 GOLD classification better reflects physical activities of daily living.
countries and territories, 1980‑2017: A systematic analysis for the Respir Care 63: 77‑85, 2018.
Global Burden of Disease Study 2017. Lancet 392: 1736‑1788, 2018. 24. Skierka AS and Michels KB: Ethical principles and
2. Singh D, Agusti A, Anzueto A, Barnes PJ, Bourbeau J, Celli BR, placebo‑controlled trials‑interpretation and implementation of the
Criner GJ, Frith P, Halpin DMG, Han M, et al: Global strategy Declaration of Helsinki's placebo paragraph in medical research.
for the diagnosis, management, and prevention of chronic obstruc‑ BMC Med Ethics 19: 24, 2018.
tive lung disease: The GOLD science committee report 2019. Eur 25. Szklarczyk D, Gable AL, Lyon D, Junge A, Wyder S, Huerta‑Cepas J,
Respir J 53: 1900164, 2019. Simonovic M, Doncheva NT, Morris JH, Bork P, et al: STRING
3. Decramer M, Janssens W and Miravitlles M: Chronic obstructive v11: Protein‑protein association networks with increased coverage,
pulmonary disease. Lancet 379: 1341‑1351, 2012. supporting functional discovery in genome‑wide experimental
4. Tuder RM and Petrache I: Pathogenesis of chronic obstructive datasets. Nucleic Acids Res 47: D607‑D613, 2019.
pulmonary disease. J Clin Invest 122: 2749‑2755, 2012. 26. Caramori G, Casolari P, Barczyk A, Durham AL, Di Stefano A
5. Brightling C and Greening N: Airway inflammation in and Adcock I: COPD immunopathology. Semin Immunopathol 38:
COPD‑progress to precision medicine. Eur Respir J 54: 1900651, 497‑515, 2016.
2019. 27. Cruz T, Lopez‑Giraldo A, Noell G, Molins L, Juan M,
6. Gorska K, Paplinska‑Goryca M, Nejman‑Gryz P, Goryca K and Fernandez MA, Canet MRF and Agusti A: Pulmonary and systemic
Krenke R: Eosinophilic and neutrophilic airway inflammation in cellular immune response network in patients with mild‑moderate
the phenotyping of mild‑to‑moderate asthma and chronic obstruc‑ COPD. Eur Respiratory J Conf 50: 2017.
tive pulmonary disease. COPD 14: 181‑189, 2017. 28. Hume DA, Irvine KM and Pridans C: The mononuclear phagocyte
7. Magnussen H: Therapy control of COPD by eosinophilic granu‑ system: The relationship between monocytes and macrophages.
locytes?. Dtsch Med Wochenschr 144: 917‑921, 2019 (In German). Trends Immunol 40: 98‑112, 2019.
8. Pavord ID: Biologics and chronic obstructive pulmonary disease. 29. Yang J, Zhang L, Yu C, Yang XF and Wang H: Monocyte and
J Allergy Clin Immunol 141: 1983‑1991, 2018. macrophage differentiation: Circulation inflammatory monocyte as
9. Yousuf A and Brightling CE: Biologic drugs: A new target therapy biomarker for inflammatory diseases. Biomark Res 2: 1, 2014.
in COPD? COPD 15: 99‑107, 2018. 30. Sun W, Kechris K, Jacobson S, Drummond MB, Hawkins GA,
10. Cruz T, Lopez‑Giraldo A, Noell G, Casas‑Recasens S, Garcia T, Yang J, Chen TH, Quibrera PM, Anderson W, Barr RG, et al:
Molins L, Juan M, Fernandez MA, Agustí A and Faner R: Common genetic polymorphisms influence blood biomarker
Multi‑level immune response network in mild‑moderate chronic measurements in COPD. PLoS Genet 12: e1006011, 2016.
obstructive pulmonary disease (COPD). Respir Res 20: 152, 2019. 31. Mannino DM: Biomarkers for chronic obstructive pulmonary
11. Pan Z, Yu H and Liao JL: Probing cellular and molecular disease diagnosis and progression: Insights, disappointments and
mechanisms of cigarette smoke‑induced immune response in the promise. Curr Opin Pulm Med 25: 144‑149, 2019.
progression of chronic obstructive pulmonary disease using multi‑ 32. Garudadri S and Woodruff PG: Targeting chronic obstructive
scale network modeling. PLoS One 11: e0163192, 2016. pulmonary disease phenotypes, endotypes, and biomarkers. Ann
12. Butler CC, Gillespie D, White P, Bates J, Lowe R, Thomas‑Jones E, Am Thorac Soc 15 (Suppl 4): S234‑S238, 2018.
Wootton M, Hood K, Phillips R, Melbye H, et al: C‑Reactive 33. Lee S, Ro H, In HJ, Choi JH, Kim MO, Lee J, Hong ST and
protein testing to guide antibiotic prescribing for COPD exacerba‑ Lee SU: Fisetin inhibits TNF‑α/NF‑κ B‑induced IL‑8 expression
by targeting PKCδ in human airway epithelial cells. Cytokine 108:
tions. N Engl J Med 381: 111‑120, 2019. 247‑254, 2018.
13. Bradford E, Jacobson S, Varasteh J, Comellas AP, Woodruff P, 34. Christenson SA, van den Berge M, Faiz A, Inkamp K, Bhakta N,
O'Neal W, DeMeo DL, Li X, Kim V, Cho M, et al: The value Bonser LR, Zlock LT, Barjaktarevic IZ, Barr RG, Bleecker ER, et al:
of blood cytokines and chemokines in assessing COPD. Respir An airway epithelial IL‑17A response signature identifies a
Res 18: 180, 2017. steroid‑unresponsive COPD patient subgroup. J Clin Invest 129:
14. Regan EA, Hersh CP, Castaldi PJ, DeMeo DL, Silverman EK, 169‑181, 2019.
Crapo JD and Bowler RP: Omics and the search for blood 35. Roos AB, Sanden C, Mori M, Bjermer L, Stampfli MR and
biomarkers in Chronic obstructive pulmonary disease: Insights Erjefalt JS: IL‑17A is elevated in end‑stage chronic obstructive
from COPDGene. Am J Respir Cell Mol Biol 61: 143‑149, 2019. pulmonary disease and contributes to cigarette smoke‑induced
15. Zou Y, Chen X, Liu J, Zhou DB, Kuang X, Xiao J, Yu Q, Lu X, lymphoid neogenesis. Am J Respir Crit Care Med 191: 1232‑1241,
Li W, Xie B and Chen Q: Serum IL‑1β and IL‑17A levels in patients 2015.
with COPD: Associations with clinical parameters. Int J Chron 36. Zheng X, Zhang L, Chen J, Gu Y, Xu J and Ouyang Y: Dendritic
Obstruct Pulmon Dis 12: 1247‑1254, 2017. cells and Th17/Treg ratio play critical roles in pathogenic process of
16. Fermont JM, Masconi KL, Jensen MT, Ferrari R, Di Lorenzo VAP, chronic obstructive pulmonary disease. Biomed Pharmacother 108:
Marott JM, Schuetz P, Watz H, Waschki B, Müllerova H, et al: 1141‑1151, 2018.
Biomarkers and clinical outcomes in COPD: A systematic review 37. Ito JT, Cervilha DAB, Lourenco JD, Goncalves NG, Volpini RA,
and meta‑analysis. Thorax 74: 439‑446, 2019. Caldini EG, Landman G, Lin CJ, Velosa APP, Teodoro WPR, et al:
17. Bai Y, Zhou Q, Fang Q, Song L and Chen K: Inflammatory cyto‑ Th17/Treg imbalance in COPD progression: A temporal analysis
kines and T‑Lymphocyte subsets in serum and sputum in patients using a CS‑induced model. PLoS One 14: e0209351, 2019.
with bronchial asthma and chronic obstructive pulmonary disease. 38. Li XN, Pan X and Qiu D: Imbalances of Th17 and Treg cells and
Med Sci Monit 25: 2206‑2210, 2019. their respective cytokines in COPD patients by disease stage. Int
18. Papaioannou AI, Konstantelou E, Papaporfyriou A, Bartziokas K, J Clin Exp Med 7: 5324‑5329, 2014.
Spathis A, Bakakos P, Loukides S, Koulouris N, Papiris S and
Kostikas K: Serum surfactant protein levels in patients admitted to
the hospital with acute COPD exacerbation. Lung 196: 201‑205, 2018. This work is licensed under a Creative Commons
19. Zhai J, Insel M, Addison KJ, Stern DA, Pederson W, Dy A, Attribution-NonCommercial-NoDerivatives 4.0
Rojas‑Quintero J, Owen CA, Sherrill DL, Morgan W, et al: Club International (CC BY-NC-ND 4.0) License.
cell secretory protein deficiency leads to altered lung function. Am
J Respir Crit Care Med 199: 302‑312, 2019.You can also read