Ammonium-Based Compound Fertilisers Mitigate Nitrous Oxide Emissions in Temperate Grassland
←
→
Page content transcription
If your browser does not render page correctly, please read the page content below
agronomy
Article
Ammonium-Based Compound Fertilisers Mitigate Nitrous
Oxide Emissions in Temperate Grassland
Amanuel W. Gebremichael *, Niharika Rahman, Dominika J. Krol                                  , Patrick J. Forrestal, Gary J. Lanigan
and Karl G. Richards *

                                           Teagasc, Environment, Soils and Land Use Department, Johnstown Castle, Co., Y35 Y521 Wexford, Ireland;
                                           Niharika.Rahman@teagasc.ie (N.R.); dominika.krol@teagasc.ie (D.J.K.); patrick.forrestal@teagasc.ie (P.J.F.);
                                           gary.lanigan@teagasc.ie (G.J.L.)
                                           * Correspondence: amanuel.gebremichael@ucdconnect.ie (A.W.G.); karl.richards@teagasc.ie (K.G.R.)

                                           Abstract: Nitrogen fertiliser application represents the largest anthropogenic source of nitrous oxide
                                           (N2 O) emissions, and the magnitude of these emissions is dependent on the type of fertilisers applied
                                           in the agroecosystems. Despite N-P-K compound fertilisers being commonly used in agricultural
                                           soils, a lack of information exists regarding their effects on N2 O emissions. This study aims at
                                           examining the effects of different commonly used N-P-K compound fertiliser formulations with
                                           contrasting nitrate to ammonium ratios (0.05 to 0.88) on N2 O emissions, yield, and nitrogen use
                                           efficiency (NUE) in temperate grassland and to compare these variables with common straight N
                                           fertilisers. Compound fertilisers with varying NPK inclusion rates (18-6-12, 10-10-20, 24-2.2-4.5, and
                                           27-2.5-5), and calcium ammonium nitrate (CAN) and urea + N-(n-butyl) thiophosphoric triamide
                                 (NBPT) were applied at 80 kg N ha−1 to experimental plots in managed grassland on two occasions

                                           in a growing season. Fluxes of N2 O during the experiment period, yield and NUE following two
Citation: Gebremichael, A.W.;              harvests were measured. The cumulative N2 O emission from urea + NBPT, 18-6-12, 10-10-20, and
Rahman, N.; Krol, D.J.; Forrestal, P.J.;   24-2.2-4.5 treatments were significantly reduced by 44%, 43%, 37%, and 31% compared with CAN
Lanigan, G.J.; Richards, K.G.              treatment under conducive soil moisture condition. Under the same soil condition, 18-6-12 and
Ammonium-Based Compound
                                           10-10-20 treatments showed higher yield, N uptake, and NUE although did not significantly differ
Fertilisers Mitigate Nitrous Oxide
                                           from the other fertiliser treatments. Our results suggest that ammonium-based compound fertilisers
Emissions in Temperate Grassland.
                                           have a potential to reduce N2 O emissions while maintaining yields. Further long-term study is
Agronomy 2021, 11, 1712. https://
                                           needed to capture the full magnitude of variations in N2 O emissions, including ammonia (NH3 )
doi.org/10.3390/agronomy11091712
                                           volatilization from nitrate and ammonium-based compound fertiliser applications from multiple soil
Academic Editor: Helen Suter               types and under different climatic conditions.

Received: 29 June 2021                     Keywords: nitrous oxide; compound fertiliser; grassland; NBPT; soil moisture
Accepted: 23 August 2021
Published: 27 August 2021

Publisher’s Note: MDPI stays neutral       1. Introduction
with regard to jurisdictional claims in          Owing to population growth and a change in patterns of food consumption, demand
published maps and institutional affil-    for global food has increased rapidly in recent decades [1]. To satisfy the increasing food
iations.
                                           demand, the food production system is expected to further intensify, and the use of nitrogen
                                           (N) via fertiliser is likely to increase in agricultural soils [2]. Despite N fertilisation leading
                                           to increased production, N surplus availability in the soil beyond plant requirement can
                                           lead to N losses in the form of nitrate (NO3 − -N) leaching, nitrous oxide (N2 O), nitric oxide
Copyright: © 2021 by the authors.          (NO), and ammonia (NH3 ) emissions, all having a detrimental effect on environment and
Licensee MDPI, Basel, Switzerland.         climate [3]. Nitrous oxide is a major greenhouse gas (GHG) associated with N fertiliser
This article is an open access article     application, with a large radiative forcing and stratospheric ozone-depleting potential [4].
distributed under the terms and            Agriculture soils represent the largest anthropogenic source of N2 O emissions that con-
conditions of the Creative Commons
                                           tribute to approximately 60% of the global total, and this is projected to further increase
Attribution (CC BY) license (https://
                                           by 19% by 2030, with the primary source of rise coming from the increasing use of N
creativecommons.org/licenses/by/
                                           fertilisers [5]. Grassland constitutes over one-third of the European agricultural land area,
4.0/).

Agronomy 2021, 11, 1712. https://doi.org/10.3390/agronomy11091712                                            https://www.mdpi.com/journal/agronomy
Agronomy 2021, 11, 1712 2 of 15
making grass one of the most important crops, and most grasslands in Europe are managed
intensively for maximum production through fertiliser application [6]. The application
of mineral fertilisers has been one of the major causes and drivers of an increase in N2 O
emissions in intensively managed grasslands in Europe [7,8].
Nitrous oxide is produced in agriculture soils primarily through microbial processes of
nitrification and denitrification, which contribute to 70% of the global emissions in managed
and natural soils [9]. Pulses of N2 O emissions from managed grasslands occur after N
fertiliser application. However, the extent and timing of the N2 O fluxes depend on fertiliser
formulation and rate as well as other soil characteristics and microsite conditions, which are
also known to play an important role [10]. Compared to ammonium-based, nitrate-based
fertilisers are considered to produce higher N2 O emissions due to the immediate availability
of the nitrate substrate for denitrification in wet temperate grassland soils [11–13]. For
this reason, changing from nitrate fertiliser to urea plus urease inhibitor-based fertilisers
has been put forward in Ireland as an important strategy for reducing N2 O emissions [14].
However, straight urea may lead to N loss via NH3 volatilization, which can contribute
to indirect emissions [13,15]. Relative to calcium ammonium nitrate (CAN), stabilized N
fertilisers containing urease and nitrification inhibitors have recently been recommended to
increase N use efficiency (NUE) and decrease N2 O release into the atmosphere by reducing
the amount of N available for soil microorganisms [12].
Crops compete for available N with microorganisms thus, optimum supply of N to
match plants demand ensures high yield and increased NUE, and lowers N2 O emissions.
Increasing NUE in fertilisers are associated with a slower release of nutrients by reducing N
losses, which is considered to improve yields and mitigate N2 O emissions [16,17]. Although
stabilized fertilisers have been formulated to accomplish high yield and NUE by reducing N
losses, many findings showed that the effectiveness of these fertilisers are often influenced
by environmental conditions, soil characteristics, and management practices [18–22]. Soil
moisture is an important factor affecting the magnitude of N2 O emissions from fertilised
soil by limiting oxygen concentrations in soil [23] and determining the extent of mineral
N accumulations [24]. Several studies reported rapid and peak emissions of N2 O when
the water-filled pore space (WFPS) of the soil is greater than 60%, anaerobic soil moisture
condition whereby soil NO3 − is reduced to NO2 − , N2 O, and N2 via facultative anaerobic
bacteria [10,12,13].
Compound fertilisers contain the complete three macronutrients such as N, phos-
phorus (P), and potassium (K), and the choice of formulations is guided by the desired
nutrient composition. Globally, China is the largest consumer of compound fertilisers
where 38% of the applied fertilisers are coming from NPK formulations [25]. In Ireland
from 2014 to 2019, compound and straight fertilisers account for 59% and 41% of the total
fertilisers used, respectively (Data source: Department of Agriculture, Food and the Ma-
rine (DAFM). This figure is substantially higher than the 22% consumption of compound
fertilisers in Europe [26], indicating the extensive use of compound fertilisers in Irish soils
and contribution to the national GHG budget. Fertilisers with an N-P-K ratio of 10-10-20,
18-6-12, 24-2.2-4.5, 24-2.5-10, and 27-2.5-5 represent the most commonly used fertiliser
types, accounting for 77% of the total 80 compound fertilisers has been sold in Ireland in
2019 (DAFM). These fertilisers have different nitrate to ammonia ratios due to their for-
mulation thereby affecting soil inorganic nitrogen pool sizes and consequently influencing
the relative availability of ammonium and nitrate for N2 O loss through nitrification and
denitrification processes. Additionally, the extra supply of P and K offer a better spatial
distribution of nutrients, which might contribute to the N dynamics in soil, is likely to
promote crop yield and NUE [27]. Most studies to date have focused on stabilised fertilisers
(urease or nitrification inhibitors) as options of decreasing fertiliser related N2 O emissions
in agricultural systems, while the potential effects of compound fertilisers with variable
nitrate to ammonia ratio composition on N2 O emissions have received little attention.
Therefore, it is unclear whether compound fertilisers can offer an alternative source ofAgronomy 2021, 11, 1712 3 of 15
fertiliser formulation to mitigating or decreasing N2 O emissions in comparison to the most
commonly used fertilisers such as urea and CAN.
The primary aim of this study was to quantify N2 O emissions, crop yield, and NUE in a
temperate grassland receiving fertilisers formulated with contrasting nitrate to ammonium
ratios. There is no a priori body of evidence to assume compound and straight fertiliser
applications result in similar yield and N2 O emission factors. Therefore, the secondary
objective was to compare compound fertilisers with the common straight fertilisers such
as CAN and urea + N-(n-butyl) thiophosphoric triamide (NBPT) with regard to N2 O
emissions, yield, and NUE and give an overview of percent (%) N loss for all fertilisers. We
investigated compound fertilisers that have varying ratios of nitrate to ammonium from
0.05 to 0.88. We hypothesised that N2 O emissions will be lower for fertilisers with low
NO3 − :NH4 + ratios compared to high ratios.
2. Materials and Methods
2.1. Site Description
A field study was conducted at one of the research farms of Teagasc Research Centre
at Johnstown Castle, Co. Wexford, Ireland (52◦ 290 22.0800 N, 6◦ 500 07.6400 W) during a
growing season of 2020 (June–August). According to Irish soil classification system, the
soil at the experimental site is Gleyic Luvisol with parent materials of siliceous stones.
The soil type was a sandy loam, with clay, silt, and sand contents of 18.0%, 21.6%, and
60.4%, respectively. The site is a permanent grassland site which was last reseeded in
autumn 2018 with perennial ryegrass (Lolium perenne L.) with no clover at a seeding rate
of 38 kg ha−1 . After reseeding, phosphorous (16% P Superphosphate), potassium (50% K
Muriate of Potash), and nitrogen fertilisers (27% N CAN) were applied at rates of 10, 40, and
40 kg ha−1 , respectively. Weeds were controlled through herbicide application in December
2018, and as a result, negligible weeds presences were detected. For the years before 2018,
the plot was permanent grassland (perennial ryegrass) with grazing started in 2013 with
dairy replacement stock. The last grazing occurred in September 2019, grazed by spring
born calves. Prior to the experiment being established, the site received 150–200 kg N ha−1
per year of nitrogen fertiliser, applied in five equal splits between March and September. A
description of the soil in the site is presented in Table 1 for soil samples in the top 10 cm
taken prior to the commencement of the experiment.
Table 1. Soil characteristics (0–10 cm) of the experimental site with results expressed as mean ± SE
(n = 8).
Soil Properties Value
Bulk density (g cm−3 ) 1.30 ± 0.02
pH (1:5 ratio soil to water) 5.40 ± 0.04
Total C (%) 2.26 ± 0.06
Total N (%) 0.24 ± 0.01
C:N 9.33 ± 0.19
Organic C (%) 1.67 ± 0.23
Organic matter (%) 5.70 ± 0.07
1 available P (mg kg−1 ) 4.64 ± 0.29
1 available Mg (mg kg−1 ) 82.75 ± 7.91
1 available K (mg kg−1 ) 140.50 ± 4.54
1 crop available nutrients were determined using Morgan’s extract [28].
2.2. Experimental Design and Treatments
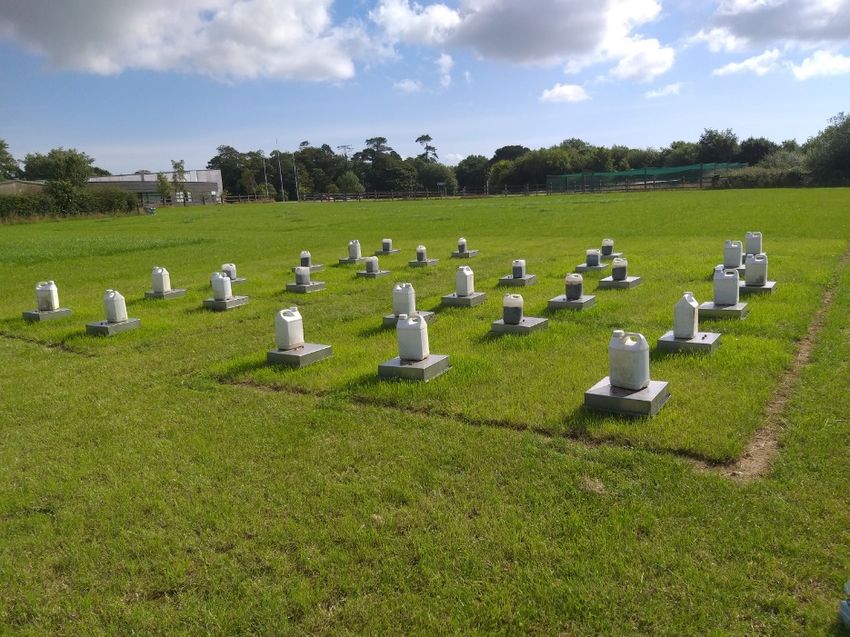
A week before starting the measurements, plots (1.2 m × 1.2 m) were established
in a randomized block design, with four blocks and seven fertiliser treatments (Figure 1,
Table 2). All fertiliser treatments were replicated four times. Two-meter gaps were left
between blocks and plots within blocks for walkways during sampling. The investigated
fertilisers consisted of: (i) control (receiving no fertiliser), (ii) N-P-K:18-6-12 (ammonium-
based), (iii) 10-10-20 (ammonium-based), (iv) 24-2.2-4.5 (nitrate-based), (v) 27-2.5-5 (nitrate-ble 2). All fertiliser treatments were replicated four times. Two-meter gaps were le
tween blocks and plots within blocks for walkways during sampling. The investig
fertilisers consisted of: (i) control (receiving no fertiliser), (ii) N-P-K:18-6-12 (amm
Agronomy 2021, 11, 1712
um-based), (iii) 10-10-20 (ammonium-based), (iv) 24-2.2-4.5 (nitrate-based), 4 of 15
(v) 27-
(nitrate-based), (vi) CAN (nitrate-based), and (vii) urea + NBPT. All fertiliser form
tions were applied twice during the experimental period each time at a rate of 80
ha−1, which is a recommended N rate in the region for cut swards. The first fertilise
based), (vi) CAN (nitrate-based), and (vii) urea + NBPT. All fertiliser formulations were
applied
applied on 22
twice Junethe
during 2020 and the second
experimental fertiliser
period each time atwas applied
a rate of 80 kgon 21−July
N ha 2020. Ferti
1 , which
iswere spread by N
a recommended hand
rate to
in the chamber
the region bases
for cut separately
swards. The firsttofertiliser
the restwas
of the ploton
applied area to en
22the accurate
June 2020 andNthe application ratewas
second fertiliser within and
applied onoutside the Fertilisers
21 July 2020. chambers. Tospread
were create cond
by hand to the[10]
conditions chamber
for Nbases separately toduring
2O production the rest of
thethesecond
plot area to ensure theperiod,
fertilisation accuratethe N water
application
pore spaces rate(WFPSs)
within andofoutside the chambers.
the plots To create conducive
were maintained at 70% or conditions
above. [10]Whenfor the na
N2 O production during the second fertilisation period, the water filled pore spaces (WFPSs)
rainfall event was not sufficient to attain the required soil water content (>65% W
of the plots were maintained at 70% or above. When the natural rainfall event was not
plots were
sufficient individually
to attain hand-watered
the required using
soil water content a watering
(>65% can. were
WFPS), plots The amount
individuallyof water a
to the plots using
hand-watered was decided
a wateringbased on amount
can. The the evapotranspiration
of water added to the (ET) data
plots wasof the last deca
decided
the same
based on theperiod of the experiment,
evapotranspiration (ET) dataand the
of the lastthree-day
decade of rainfall
the sameforecast.
period ofET the and for
experiment, and the three-day rainfall forecast. ET and forecast data were
data were obtained from Met Éireann (Available online: www.met.ie (accessed on 20 obtained from
Met Éireann (Available online: www.met.ie (accessed on 20 July 2020)). The dates and
2020)). The dates and irrigation amounts added are shown in Figure 2. A total of 45
irrigation amounts added are shown in Figure 2. A total of 45 mm water was added at
water was added at eight applications during the second fertilisation.
eight applications during the second fertilisation.
Figure
Figure 1. 1. Photograph
Photograph of experimental
of experimental field (grassland)
field (grassland) at Johnstown
at Johnstown Castle
Castle research site research
during gassite durin
sampling
sampling from
from static
static chambers
chambers with
with the the square
square collarsinto
collars inserted inserted
the soilinto
andthe
leadsoil andclosed
covers lead covers c
withballast
with ballast weights
weights placed
placed on top.
on top.
Table 2. Fertiliser formulations and their nutrient contents (%) including nitrate to ammonium ratios.
Table 2. Fertiliser formulations and their nutrient contents (%) including nitrate to ammonium ratios.
Fertiliser Formulations NH4 + (%) NO3 − (%) NO3 − : NH4 + N P K
18-6-12 11.8 6.2 0.53 18 6 12
Fertiliser formulations
10-10-20 9.5 NH4 (%) 0.5 NO3 (%) 0.05
+ − NO3−: NH 10 4
+
10N 20P K
24-2.2-4.5
18-6-12 12.8 11.8 11.2 6.2 0.88 0.53 24 2.218 4.56 12
27-2.5-5 15 12 0.80 27 2.5 5
10-10-20
CAN 13.5 9.5 13.5 0.5 1 0.05 27 010 010 20
Urea24-2.2-4.5
+ NBPT 12.8 11.2 0.88 46 024 02.2 4.5
27-2.5-5 15 nitrate; NBPT:12N-(n-butyl) thiophosphoric
CAN: Calcium ammonium 0.80 triamide. 27 2.5 5
CAN 13.5 13.5 1 27 0 0
Urea + NBPT 46 0 0
CAN: Calcium ammonium nitrate; NBPT: N-(n-butyl) thiophosphoric triamide.Agronomy 2021, 11, 1712 5 of 15
my 2021, 11, x FOR PEER REVIEW 5 of 16
50 90
Rainfall (mm) Air temp. WFPS
Water added (mm) Soil temp
Rainfall (mm)/ Temperature ( C)
40 80
0
30 70
WFPS (%)
20 60
10 50
0 40
6/22/20 7/6/20 7/20/20 8/3/20 8/17/20
Figure 2. Average
Figure air
2. and soil (5air
Average cmand
depth)
soiltemperature, rainfall
(5 cm depth) and waterrainfall
temperature, filled pore
andspace
water(WFPS)
filled over
pore the measurement
space
period. Grey bars represent the amount of additional water applied by hand. Arrows indicate application
(WFPS) over the measurement period. Grey bars represent the amount of additional water applied dates of fertilisers.
by hand. Arrows indicate application dates of fertilisers.
2.3. Climatic and Soil Conditions
2.3. Climatic and SoilRainfall and air temperature were recorded at the meteorological station located 300 m
Conditions
from the study site. Soil volumetric water content was measured on each day of N2 O
Rainfall and air temperature were recorded at the meteorological station located 300
sampling to a depth of 6 cm using a Theta probe (ML2, Delta-T Devices, Cambridge, UK).
m from the study site. Soil volumetric water content was measured on each day of N2O
Measurements were taken from each plot. Soil bulk density and volumetric water content
sampling to a depth of 6 cm using a Theta probe (ML2, Delta-T Devices, Cambridge, UK).
were used to calculate WFPS.
Measurements were taken from each plot. Soil bulk density and volumetric water content
were used to calculate
2.4. Soil WFPS.
Sampling and Analysis
Soil samples were taken to 10 cm depth from each plot using a soil corer on four
2.4. Soil Sampling and Analysis
occasions in each fertilisation event. Top 10 cm is selected because this depth contains a
Soil samples were taken
maximum amount to 10
of cm depth and
nutrients from eachroot
major plotdensities
using a although
soil corerdepths
on fourbelow also play
occasions in each fertilisation event. Top 10 cm is selected because this depth
important role in nutrient cycling. Soil cores were placed in a cool-box and contains a taken to the
maximum amount of nutrients and major root densities although depths below
laboratory where samples were analysed on the day of sampling. Mineral N extractionalso play
important rolewasin nutrient
performed cycling.
in a Soil
4 mm cores
sievedwere placed
soil usingin2 aMcool-box
potassiumandchloride
taken to(1:5the ratio of soil to
laboratory where samples
solution) were
after analysed
shaking for 1on h. the
Theday of sampling.
extracts Mineralcolorimetrically
were analysed N extraction for NH4 + -N
was performedand in aNO4 mm− sieved soil using 2 M potassium chloride (1:5 ratio of soil to
3 -N using an Aquakem 600 discrete analyser (Thermo Electron OY, Vantaa,
solution) after Finland).
shaking for 1 h. The moisture
Gravimetric extracts were
contentanalysed colorimetrically
was determined on each fordayNH 4+-N
of sampling by drying
and NO3−-N using an Aquakem 600 discrete analyser ◦ (Thermo Electron OY, Vantaa,
20 g of each soil sample for 24 h at 105 C, which allowed conversion of soil mineral N
Finland). Gravimetric moisture
concentrations intocontent was determined on each day of sampling by
dry weights.
drying 20 g of each soil sample for 24 h at 105 °C, which allowed conversion of soil min-
2.5. Nitrous
eral N concentrations Oxide
into dry Sampling and Analysis
weights.
From June 2020 to August 2020, N2 O fluxes were measured using the closed static
2.5. Nitrous Oxide Sampling
chamber and Analysis
technique using the method described by de Klein and Harvey [29]. A week
From Junebefore
2020 starting
to August the2020,
measurements,
N2O fluxesa stainless-steel
were measured base collar
using thewas installed
closed within each plot
static
to a depth
chamber technique usingoftheapproximately 5 cm into
method described bythe
desoil andand
Klein 10 cm high upper
Harvey [29]. Achamber
week was prepared
before startingfor
thegas sampling (Figure
measurements, 1). Both collars
a stainless-steel baseand chambers
collar have dimensions
was installed within each of 40 cm × 40 cm.
Chambers are fitted with two rubber septa. The top rim
plot to a depth of approximately 5 cm into the soil and 10 cm high upper chamber was of the collars contains a channel
that is covered with a neoprene stripe. Water was added
prepared for gas sampling (Figure 1). Both collars and chambers have dimensions of 40 in the channel followed by a
placement of a 10 kg weight in order to ensure airtight
cm × 40 cm. Chambers are fitted with two rubber septa. The top rim of the collars con- sealing in the headspace during
tains a channelsampling. Gas samples
that is covered with a were collected
neoprene at 0Water
stripe. min, 20 min,
was and in
added 40 the
minchannel
after chamber closure.
followed by a placement of a 10 kg weight in order to ensure airtight sealing inthe
Linear accumulation of gases in the headspace was assumed; hence theN2 O emissionsAgronomy 2021, 11, 1712 6 of 15
were calculated based on the rate of change of the gas concentrations during the closure
period [30]. Gas samples were taken from the headspaces of the chambers by using 10 mL
Luer Lock syringe (Omnifix® , B.Braun Melsungen AG, Melsungen, Germany) fitted with
a Terumo hypodermic needle (AGANITM , Hamburg, Germany) and transferred to 7 mL
screw-capped vials that were previously flushed with helium and evacuated. Prior to
the final sample, the headspace gas was mixed by drawing and releasing air three times.
Gas samples were analysed using a gas chromatograph (Bruker CAM, Scion 456-GC,
Livingston, Scotland, UK) equipped with a 63 Ni electron capture detector (ECD) with
high-purity helium as a carrier gas to analyse for N2 O concentrations. Gas sampling took
place 5 days a week in the first 2 weeks of fertiliser applications, and frequency of sampling
was reduced to 3 days a week in the subsequent weeks. Gas sampling was performed
between 10 a.m. and 12 p.m. to get a representative average hourly flux of the day, which
was used to calculate daily emissions. Cumulative N2 O emissions were obtained by linear
interpolation of the emission values, and integrating the daily gas emissions from each
chamber [29]. Cumulative emissions were calculated separately for each fertilisation event
because of different soil moisture conditions that constrain variable N2 O production by
affecting nitrification and denitrification processes. Percentage of applied N lost as N2 O
(N2 O %) gas were calculated by subtracting the cumulative N2 O emissions of the control
from the cumulative N2 O emissions of each treatment of the same block, and dividing
by the N fertiliser application rate. Yield-scaled (YS) N2 O emissions were computed by
dividing the cumulative N2 O emissions over grass growing period by the grass dry matter
yield [31].
2.6. Yield, N Uptake and N Use Efficiency
Grass was harvested from each plot to a height of 4 cm, 4 weeks after each fertilisation
using grass shears (Art. 8885, Gardena Accu Shears, Gardena, Ulm, Germany). The fresh
grass cut from each collar areas weighed and oven dried at 70 ◦ C for dry matter and N
content determination. Dry matter content was determined by dividing dry weight by the
fresh weight. Grass dry matter yield (expressed in kg ha−1 ) was computed using fresh
weight from the collar area and the dry matter content. Dried samples were ground and
subsampled for N content analysis using a C/N elemental analyser (Leco Corp., St. Joseph,
Michigan, MI, USA). N uptake was calculated from the dry matter yield and the N content
of the dried samples. Nitrogen use efficiency was computed by subtracting the N uptake
of control from N uptake of a fertiliser treatment divided by the fertiliser application rate
(80 kg N ha−1 for each application).
2.7. Statistical Analysis
All statistical analyses were conducted with Minitab Statistical Software (Minitab 19,
State College, PA, USA). The effect of different fertiliser treatments on cumulative N2 O
emissions was tested for fertiliser applications using general linear mixed model, with
fertiliser formulations and application timing as fixed effects and block as a random effect.
General linear mixed model was used again to check the effect of fertiliser treatment on dry
matter yield, N uptake, NUE and yield-scaled N2 O emissions with fertiliser formulations
and harvest as fixed factors and block as a random factor. Variance estimation and F-test
for fixed effect were estimated using restricted maximum likelihood and Kenward-Roger
approaches, respectively. Normality and homogeneity of variance were verified visually
from residual vs. fitted and normal probability plots. Statistically significant differences
(p < 0.05) were determined from a pairwise comparison of means undertaken using the
Tukey HSD test.
3. Results
3.1. Climate and Soil Conditions
The study site naturally received a total of 309 mm of rainfall during June–August,
which represents the second wettest growing season of the decade after 2012 when3. Results
3.1. Climate and Soil Conditions
The study site naturally received a total of 309 mm of rainfall during June–August,
which represents the second wettest growing season of the decade after 2012 when 493
Agronomy 2021, 11, 1712 mm was recorded. Average air (soil) daily temperature ranged between 10.1 (11.0) 7 of and
15
19.3 (28) °C with average temperature 14.4 (18.1) and 16.0 (17.8) °C during the first and
second fertiliser applications, respectively (Figure 2). The long-term (2010–2019) average
air and soil temperature was 14.7 and 17.1 °C, respectively, during June–August. The
493
WFPSmm was
rangedrecorded.
between Average
37.7%air (soil)
and daily(average:
79.7% temperature 58%)ranged
duringbetween 10.1
the first and(11.0) and
between
19.3 (28) ◦ C with average temperature 14.4 (18.1) and 16.0 (17.8) ◦ C during the first and
63.2% and 82.4% (average: 73.2%) during the second fertiliser applications (Figure 2).
second fertiliser applications, respectively (Figure 2). The long-term (2010–2019) average
air3.2.
and soil temperature
Nitrous was 14.7 and 17.1 ◦ C, respectively, during June–August. The WFPS
Oxide Emissions
ranged between 37.7% and 79.7% (average: 58%) during the first and between 63.2% and
Daily fluxes of N2O from the different fertiliser treatments are presented in Figure 3
82.4% (average: 73.2%) during the second fertiliser applications (Figure 2).
and cumulative N2O emissions and yield-scaled N2O emissions are presented in Figure
4a,c.
3.2. N2O Oxide
Nitrous flux inEmissions
control plots ranged from −2.33 to 17.64 g N2O-N ha−1d−1. There was
significant interaction effect between fertiliser treatments and application timing. Ferti-
Daily fluxes of N2 O from the different fertiliser treatments are presented in Figure 3
liser application led to a large rise in N2O emissions during the two fertilisation periods.
and cumulative N2 O emissions and yield-scaled N2 O emissions are presented in Figure 4a,c.
NMagnitude and frequency of peak emissions were highly coupled −1 to
2 O flux in control plots ranged from −2.33 to 17.64 g N2 O-N ha d . There was sig-
−1 the soil moisture
nificant interaction effect between fertiliser treatments and application timing. In
status and the majority fluxes occurred within the first week of fertilisation. the first
Fertiliser
fertilisation
application period,
led where
to a large riseWFPS
in N2 Oisemissions
often below 60%,the
during thetwo
highest cumulative
fertilisation N2OMag-
periods. emis-
sion (0.93 kg N 2O-N ha−1) was observed from 18-6-12 treatment, whereas the lowest
nitude and frequency of peak emissions were highly coupled to the soil moisture status
fluxes
and the were
majorityobserved
fluxes from the urea
occurred + NBPT
within (0.32
the first weekkg of
N2fertilisation.
O-N ha−1) and In control
the first(0.04
fertil-kg
N 2O-N ha−1) (Figure 3). Cumulative N2O emission from 18-6-12 was significantly higher
isation period, where WFPS is often below 60%, the highest cumulative N2 O emission
thankg27-2.5-5,
(0.93 N2 O-Nureaha−1+) was
NBPT, and control
observed (p < 0.05),
from 18-6-12 but notwhereas
treatment, significantly different
the lowest from
fluxes were the
10-10-20,from
observed CAN, theand 24-2.2-4.5
urea + NBPT(Figure
(0.32 kg4a). − 1
N2 O-N ha ) and control (0.04 kg N2 O-N ha ) − 1
(Figure 3). Cumulative N2 O emission from 18-6-12 was significantly higher than 27-2.5-5,
urea + NBPT, and control (p < 0.05), but not significantly different from the 10-10-20, CAN,
and 24-2.2-4.5 (Figure 4a).
Control
600
18−6−12
N2O emission (g N ha−1 d−1)
24−2.2−4.5
10−10−20
27−2.5−5
CAN
400 Urea + NBPT
200
0
6/22/20 6/29/20 7/6/20 7/13/20 7/20/20 7/27/20 8/3/20 8/10/20 8/17/20
Figure 3. Average temporal N2 O fluxes from different fertiliser formulations applied to a grassland experimental site during
Figure 3.season.
a growing Average temporal
Arrows N2Oapplications
indicate fluxes fromdates
different fertiliser formulations applied to a grassland experimental site
of fertilisers.
during a growing season. Arrows indicate applications dates of fertilisers.Agronomy 2021, 11, x FOR PEER REVIEW 8 of 16
Agronomy 2021, 11, 1712 8 of 15
3000
(a)
First application Second application
Cumulative N2O emission (kg N2O−N ha−1)
a
2500 a
P < 0.05
2000 b
b b
b
1500
a
1000 ab ab bc ab bc
500
c c
4000
a (b)
P < 0.05 a a a
a a a
ab a a a
3000 b
Dry matter yield (kg ha−1)
2000
c
b
1000
1000
P < 0.05 (c)
Yield-Scaled N2O emission (g N2O-N Mg )
−1
a
800 a
600 b
b b b
400 a
ab ab ab
bc bc
200
c c
0
trol 53) 05) 88) 80) 00) BP
T
c on 2 (0. 0 (0. . 5 (0. 5 (0. N (1. a+N
1 2 4 − A e
6− 10− 2.2
− 2.5 C Ur
18− 10− 24− 27−
Figure 4. Cumulative N2 O emissions (a), dry matter yield (b), and yield-scaled N2 O emission (c) in
Figure
the first4.and
Cumulative N2O emissions
second fertiliser (a), in
application dry matter yield
a growing (b),ofand
season yield-scaled
temperate N2O emission
grassland (c) in
with different
the first and second fertiliser application in a growing season of temperate grassland with
fertiliser treatments. Error bars represent standard errors. Statistical differences are based on mixeddifferent
fertiliser treatments. Error bars represent standard errors. Statistical differences are based on mixed
linear model with the Tukey’s HSD post hoc test (95% significance level). Means that do not share a
linear model with the Tukey’s HSD post hoc test (95% significance level). Means that do not share a
letter are significantly different. Comparisons are between fertiliser treatments within the same N2 O
letter are significantly different. Comparisons are between fertiliser treatments within the same
condition. The numbers in parenthesis indicate the NO − to NH + ratio of the fertilisers.
N2O condition. The numbers in parenthesis indicate the3 NO 3− to 4
NH4+ ratio of the fertilisers.Agronomy 2021, 11, 1712 9 of 15
In the second fertilisation period and much wetter conditions (WFPS generally >70%),
CAN and the nitrate-based compound fertilisers 27-2.5-5 and 24-2.2-4.5 produced the
highest N2 O emissions compared to urea + NBPT and the ammonium-based compound
fertilisers 18-6-12 and 10-10-20 (Figure 4a). Cumulative emissions from CAN and 27-2.5-
5 were significantly (p < 0.05) higher than the other fertiliser formulations and control.
Cumulative N2 O emissions from 24-2.2-4.5, 10-10-20, 18-6-12, and urea + NBPT did not
significantly differ from each other; however, the emissions from these treatments were
significantly greater than the control (p < 0.05) (Figure 4a). In comparison with the first
application, all fertilisers in the second application event produced greater cumulative N2 O
emissions, with emissions from nitrate and ammonium-based fertilisers resulting in 225 to
417% and 55 to 338% increase, respectively (Figure 4a).
Yield-scaled N2O emissions showed similar pattern as the cumulative emissions (Figure 4c).
With a low yield and N2 O emissions, the control plots showed the lowest yield-scaled N2 O
emissions (28.88 ± 12.38 and 54.17 ± 19.68 g N2 O-N Mg−1 ). Following the first fertilisation, 18-
6-12 (288.42 ± 48.17 g N2 O-N Mg−1 ) and 10-10-20 (204.98 ± 37.76 g N2 O-N Mg−1 ) whereas in
the second, CAN (749.07 ± 40.72 g N2 O-N Mg−1 ), 27-2.5-5 (681.55 ± 54.49 g N2 O-N Mg−1 ),
and 24-2.2-4.5 (530.38 ± 43.87 g N2 O-N Mg−1 ) generated higher yield-scaled N2 O emissions.
Higher N2 O emissions and equivalent yields in the second fertiliser event compared to the
first led to a significant increase of yield-scaled N2 O emissions.
Percentage of N lost as N2 O (N2 O %) were significantly higher following the second
fertilisation than the first (Table 3). N2 O % ranged between 0.27% and 1.55% for the first and
1.20% and 3.33% for the second fertiliser applications. Formulation 18-6-12 exhibited the
highest N2 O % in the first fertilisation with 1.11 ± 0.18% but was the lowest in the second
application with 1.73 ± 0.12% together with the urea + NBPT treatment (1.73 ± 0.20%).
The nitrate-based treatments, CAN (3.06 ± 0.14%) and 27-2.5-5 (2.74 ± 0.12%), showed the
highest percentage N2 O lost in the wetter condition, differing significantly (p < 0.05) from
the rest of fertiliser formulations.
Table 3. Mean percentage and standard errors of fertiliser lost as N2 O (N2 O %) for the six fertiliser
treatments at two harvests.
Fertilisers N2 O % Loss
Harvest 1 Harvest 2
18-6-12 1.11 ± 0.18 1.73 ± 0.12
10-10-20 0.74 ± 0.14 1.90 ± 0.11
24-2.2-4.5 0.58 ± 0.15 2.00 ± 0.20
27-2.5-5 0.49 ± 0.12 2.74 ± 0.12
CAN 0.72 ± 0.08 3.06 ± 0.14
Urea + NBPT 0.35 ± 0.03 1.73 ± 0.20
3.3. Grass Dry Matter Yield and N Uptake
A significant interaction of treatment and application timing was detected for dry
matter yield, but not for N uptake. Fertilisation significantly (p < 0.01) increased the
grass dry matter yield and N uptake (Figure 4b and Table 4). Thus, the yield and N
uptake at the control plots were significantly (p < 0.01) lower than all fertiliser treatments
(Figure 4b and Table 4). While there were no significant differences in N uptake between
any of the fertiliser treatments, dry matter yield in urea + NBPT was significantly lower
(p < 0.05) than that of 18-6-12, 24-2.2-4.5, 27-2.5-5, and CAN following the first harvest
(Figure 4b). Each fertiliser treatment produced a higher yield in the second harvest than
the first. In comparison to the first application, the second treatment application resulted
in an increase and a decrease in N uptake for ammonium and nitrate-based fertilisers,
respectively (Table 4).Agronomy 2021, 11, 1712 10 of 15
3.4. Nitrogen Use Efficiency
Nitrogen use efficiency determined from the second harvest did not differ significantly
(p > 0.05) from each other, but the NUE for urea + NBPT was significantly lower than 18-6-
12 following the first harvest (Table 4). Nitrogen use efficiency for all fertiliser treatments
in the second harvest was generally significantly higher (p < 0.01) than the first, with the
significance (p < 0.05) appeared in the two ammonium-based compound fertilisers, 10-10-20
and 18-6-12.
3.5. Soil Mineral N Concentration
The soil NH4 + -N and NO3 − -N concentrations in the fertiliser treatments are presented
in Figure 5a,b for the two fertilisation cycles. Soil NH4 + -N and NO3 − -N were signifi-
cantly increased following fertiliser treatments. Fertiliser application increased NH4 + -N
in all fertiliser treatments, with peaks detected for CAN (70.61 ± 10.39 mg kg−1 ) and
urea + NBPT (85.86 ± 16.19 mg kg−1 ) 9 and 2 days after the first and second applica-
tions, respectively. For soils sampled 2 days post-fertilisation, urea + NBPT, CAN, 18-6-12,
and 24-2.2-4.5 fertilisers produced higher soil NH4 + -N in the second application than
the first, but 27-2.5-5 and 10-10-20 treatments showed slightly lower NH4 + -N concentra-
tions. A significant increase in NO3 − -N was observed for all other treatments except
for urea + NBPT and 10-10-20, which were only slightly larger than the control. The
largest increase in NO3 − -N was detected in the CAN treatment in both fertilisations, with
Agronomy 2021, 11, x FOR PEER REVIEW 11 of 16
the first application (75.95 ± 10.20 mg kg−1 ) resulted in twice the amount of the second
(37.49 ± 16.70 mg kg−1 ). Soil mineral N concentrations returned to the pre-fertilisation
level within 3 weeks of fertiliser addition.
120
(a)
100 Control
18−6−12
24−2.2−4.5
kg dry soil)
10−10−20
80
27−2.5−5
CAN
Urea+npbt
60
−1
NH4 −N(mg
40
+
20
0
6/22/20 6/29/20 7/6/20 7/13/20 7/20/20 7/27/20 8/3/20
120
(b)
100
kg dry soil)
80
60
−1
NO3 −N (mg
40
−
20
0
6/22/20 6/29/20 7/6/20 7/13/20 7/20/20 7/27/20 8/3/20
Average soil + -N −(a) and NO − -N (b) concentrations measured from 0 to 10 cm soil
Figure
Figure 5. 5.
Average soil NH 4+-N NH
(a) and
4 NO 3 -N (b) concentrations
3 measured from 0 to 10 cm soil
depth during the experimental period. Arrows indicate application dates of fertilisers.
depth during the experimental period. Arrows indicate application dates of fertilisers.
4. Discussion
4.1. The Effect of Fertiliser Formulations on N2O Emissions
The basis behind stabilised urea formulation in comparison to CAN is to reduce soil
NO3− concentrations by delaying oxidation of ammonia to nitrate, which may ultimately
lead to reductions in N2O emissions as previously reported in a number of studies [11–
13,18,19,32]. The current study examined four compound fertilisers with contrasting ni-
trate to ammonium ratios as well as CAN and urea + NBPT, and our results showed thatAgronomy 2021, 11, 1712 11 of 15
4. Discussion
4.1. The Effect of Fertiliser Formulations on N2 O Emissions
The basis behind stabilised urea formulation in comparison to CAN is to reduce
soil NO3 − concentrations by delaying oxidation of ammonia to nitrate, which may ul-
timately lead to reductions in N2 O emissions as previously reported in a number of
studies [11–13,18,19,32]. The current study examined four compound fertilisers with con-
trasting nitrate to ammonium ratios as well as CAN and urea + NBPT, and our results
showed that significantly lower cumulative N2 O emissions were associated with lower
nitrate to ammonia ratios compared to high ratios under high WFPS condition. Ammo-
nium based treatments exhibited higher emissions under low WFPS condition but were
not significantly different from the nitrate based fertilisers and had lower magnitude of
emissions. Under high WFPS conditions (during the second application), 18-6-12, 10-10-20,
24-2.2-4.5, and 27-2.5-5 treatments produced 43, 37, 31, and 10% lower cumulative N2 O
emissions compared to CAN. Compared to CAN, the 18-6-12 and 10-10-20 fertilisers had
reductions closest to the 44% N2 O reduction observed in the urea + NBPT. This indicates
that ammonium-based compound fertilisers could potentially be a similar mitigation mea-
sure to the use of urea + NBPT to reduce N2 O emissions from temperate grassland. The
addition of inhibitors incurs extra costs and there are issues around acceptability from
farmers and milk processors due to perceptions around residues [20,33]. However, a recent
study investigating the potential for residues observed no residue issues associated with
the use of NBPT with urea [34].
The major reason for lower N2 O emission from ammonium-based fertilisers in this
study can likely be the increased plant N uptake and NUE (see Section 4.2) and reduced
risk of denitrification observed during the second fertilisation. Our results are similar to
the published reports of Dobbie and Smith [35]; Harty et al. [12] and Krol et al. [13], in
terms of ammonium-based (including urea) fertilisers generating lower N2 O emissions in
managed temperate grasslands even though these studies used straight fertilisers.
The majority of peak N2 O emission occurred under high soil mineral N and rainfall-
induced elevated soil moisture level, which ranged between 65 and 75% WFPS. Increased
soil moisture with the available NO3 − is conducive environmental condition for promoting
denitrification and producing high N2 O emission [9]. A strong influence of soil moisture
was observed in the two fertilisation cycles, with the second wetter condition resulting in
up to 5 and 2.5-fold greater cumulative N2 O emissions in nitrate and ammonium-based
fertilisers, respectively. This suggests that the effect of fertiliser formulations in direct N2 O
emissions can be vastly variable due to environmental conditions, and notable emission
differences between seasons are likely with changing climatic conditions. Harty et al. [12]
reported significant reductions of N2 O emissions by switching from CAN to any form of
urea in agricultural grassland ecosystems, with substantial differences observed during
wet periods. Similar results were reported in Dobbie and Smith [35]; Krol et al. [13];
Smith et al. [36] and Weller et al. [37]. Here, the effect of temperature was minimal for the
differences in the emission in the two periods as both fertilisations took place in similar
soil temperature conditions (averages: 17.8 and 18.1 ◦ C).
Addition of fertilisers increased soil mineral N concentrations, with the highest NH4 +
and NO3 − associated with urea + NBPT and CAN applications, respectively. However, soil
NO3 − levels were lower during the second fertiliser application. This was likely caused
by (i) the prevalence of anaerobic soil condition in the second fertilisation, which affects
nitrification by delaying the conversion of ammonium to nitrate, (ii) nitrate leaching as
a result of heavy rainfall (30 mm) recorded a week after fertilisation, or (iii) increased N
acquisition by plants [24]. Importantly the soil NO3 − concentrations in the urea + NBPT
and 10-10-20 treatments were similar to that in the control, with both fertilisers having low
N2 O losses compared to CAN.
The percentage of N lost as N2 O across the two applications were significantly affected
by the fertiliser formulation, with nitrate-based fertilisers such as CAN and 27-2.5-5 having
the highest, while urea + NBPT the lowest, N2 O % loss. Monitoring full-year fluxes isAgronomy 2021, 11, 1712 12 of 15
important and recommended to provide emission factors for the less explored compound
fertilisers (Table 4).
Table 4. Mean ± SE values of dry matter (DM) yield, N uptake, and Nitrogen use efficiency (NUE) from two individual
harvests following fertiliser applications.
Treatment Harvest 1 Harvest 2
DM Yield N Uptake NUE DM Yield N Uptake NUE
(kg ha−1 ) p < 0.05 (kg ha−1 ) p < 0.05 (%) p < 0.05 (kg ha−1 ) p < 0.05 (kg ha−1 ) p < 0.05 (%) p < 0.05
Control 1366 ± 24 d 21.1 ± 0.5 c 937 ± 108 d 15.6 ± 1.3 c
18-6-12 3215 ± 13 abc 81.2 ± 1.1 ab 75.1 ± 1.2 ab 3472 ± 48 ab 85.0 ± 1.6 a 86.8 ± 2.9 a
10-10-20 3087 ± 85 bc 81.9 ± 2.1 ab 76.1 ± 2.6 ab 3640 ± 112 a 85.1 ± 1.1 a 86.8 ± 2.7 a
24-2.2-4.5 3134 ± 43 bc 82.9 ± 2.5 ab 77.3 ± 3.7 ab 3267 ± 64 ab 75.7 ± 3.5 ab 75.1 ± 3.6 ab
27-2.5-5 3101 ± 85 bc 81.8 ± 2.9 ab 73.2 ± 4.7 ab 3316 ± 167 ab 76.5 ± 4.1 ab 77.2 ± 3.6 ab
CAN 3109 ± 98 bc 83.2 ± 1.1 ab 77.7 ± 2.0 ab 3343 ± 111 ab 79.4 ± 1.7 ab 79.7 ± 1.4 a
Urea + NBPT 2794 ± 67 c 72.1 ± 2.0 b 63.5 ± 3.2 b 3246 ± 61 ab 76.7 ± 3.5 ab 75.0 ± 4.3 ab
Means that do not share a letter are significantly different. Statistical significance at p < 0.05.
In addition to the differences in the N form, compound fertilisers differ from straight
fertilisers by their extra composition of P and K, whose relationship with N and effect on
N2 O emissions is not well-established in the literature. O’Neill et al. [38] reported lower
N2 O emission from grassland plots receiving P than with no P, with the greater emissions
in no P plots hypothetically linked to the dominance of fungi, which lack N2 O-reductase.
Long term (25 years) dry matter biomass sampling data from the experimental site of
O’Neill et al. [38], which is situated in the vicinity of our study site, shows greater N uptake
by plants receiving NPK than NK only (data not shown) suggesting the possibility of P
affecting the N dynamics in the soil.
4.2. The Effect of N Formulation on Yield, N Use Efficiency, N Uptake and Yield-Scaled
N2 O Emissions
Compared with nitrate-based, ammonium-based compound formulations generally
tend to show higher yield and N-uptake. This is particularly evident during the second
harvest where N uptake increased in 18-6-12, 10-10-20, and urea + NBPT treatments while
decreased in CAN, 24-2.2-5, and 27-2.5-5 (not significantly though). The greater yield in the
second harvest may be explained by a slower conversion of NH4 + into its oxidised form as a
result of denitrifying condition, which enhanced better utilization of nitrogen by the plants.
Yield and N uptake of urea + NBPT showed no significant differences with CAN, which
is consistent with the results of Harty et al. [21] and Krol et al. [13], despite urea + NBPT
showing consistently lower yield and N uptake in comparison with ammonium-based
compound fertilisers.
The highest NUE was found in the 10-10-20 and 18-6-12 treatments, which agreed with
the DM yield and N uptake results and corresponded with the lowest cumulative N2 O emis-
sions. This would suggest ammonium-based compound fertilisers can be important options
for sustaining yield through improved NUE while reducing N2 O emission. NUE values
here ranged from 63.5 to 86.8%, with the lowest NUE associated with urea + NBPT. These
values are slightly higher than those reported from grassland ecosystems in Krol et al. [13]
(49 to 65%), but lower than in Cardenas et al. [39] (>80%). These contrasts may be due to
the fact that these studies had longer study periods, varying fertilisation amounts, and
used different fertiliser forms.
Yield-scaled N2 O emission was influenced by the fertiliser application, for which
10-10-20 and 18-6-12 treatments showed the highest values in the first application, but low
N2 O emissions combined with greater yields caused the lowest YS N2 O emissions in the
second application. In the second fertilisation, nitrate-based fertilisers showed the largest
YS N2 O with CAN and 27-2.5-5 exhibiting significantly greater YS N2 O with 749.07 ± 40.72
and 681.55 ± 54.49 g N2 O-N Mg−1 , respectively. Therefore, ammonium-based fertilisers
are more effective with regard to sustaining agronomic benefits by satisfying the nutrient
demand of plants, and improving dry matter yield and NUE, while reducing N2 O emissions.Agronomy 2021, 11, 1712 13 of 15
These results are indicative of lower N2 O losses associated with ammonium-based
compound fertilisers due to the reduction in the soil nitrate pool. When this coincided with
denitrifying conditions, the lower soil NO3 − results in lower N2 O emissions. This research
needs to be up-scaled to evaluate emissions factors for a range of different compound
fertiliser over a range of soil types to identify low N2 O emitting fertilisers.
5. Conclusions
The purpose of this study was to evaluate the effect of fertilisers with contrasting
NO3 − to NH4 + ratios on N2 O emission in temperate agricultural grassland. N2 O emission
in wetter soil was 37–43% and 10–31% lower than CAN for the application of ammonium
(10-10-20 and 18-6-12) and nitrate-based (27-2.5-5 and 24-2.2-2.5) compound fertilisers,
respectively. Thus, these results suggest that applying ammonium-based compound fer-
tilisers is an additional option for farmers to mitigate N2 O emissions while maintaining
production in temperate grasslands. Soil moisture was found to be an important envi-
ronmental variable controlling the magnitude of the emission, indicating a high prospect
of seasonal variability in N2 O emission from these fertiliser forms had this study been
held for an extended period. Therefore, further study is needed to capture the full mag-
nitude of variations in N2 O emissions, including NH3 volatilization from nitrate and
ammonium-based compound fertiliser applications from multiple soils and years under
different climatic conditions.
Author Contributions: Conceptualization, A.W.G., N.R., D.J.K., P.J.F., G.J.L. and K.G.R.; method-
ology, A.W.G., N.R., D.J.K., P.J.F., G.J.L. and K.G.R.; formal analysis, A.W.G.; investigation, A.W.G.
and K.G.R.; writing—original draft preparation, A.W.G.; writing—review and editing, A.W.G., N.R.,
D.J.K., P.J.F., G.J.L. and K.G.R.; supervision, D.J.K., P.J.F., G.J.L. and K.G.R.; funding acquisition, G.J.L.
and K.G.R. All authors have read and agreed to the published version of the manuscript.
Funding: This research was financially supported under the National Development Plan, through
the Research Stimulus Fund, administered by the Department of Agriculture, Food and the Marine
(Grant number 15S655).
Institutional Review Board Statement: Not applicable.
Informed Consent Statement: Not applicable.
Data Availability Statement: The authors declare that the data supporting this study are available
on request from the corresponding authors.
Acknowledgments: The technical support of Gareth Gillen, Denis Brennan, Wendy Pierce, Brendan
Healy, and Amy Richards for the gas, plant, and soil analysis is gratefully acknowledged.
Conflicts of Interest: The authors declare no conflict of interest.
References
1. Beltran-Peña, A.A.; Rosa, L.; D’Odorico, P. Global food self-sufficiency in the 21st century under sustainable intensification of
agriculture. Environ. Res. Lett. 2020, 15, 095004. [CrossRef]
2. Lu, C.; Tian, H. Global nitrogen and phosphorus fertilizer use for agriculture production in the past half century: Shifted hot
spots and nutrient imbalance. Earth Syst. Sci. Data 2017, 9, 181–192. [CrossRef]
3. Chen, J.; Lü, S.; Zhang, Z.; Zhao, X.; Li, X.; Ning, P.; Liu, M. Environmentally friendly fertilizers: A review of materials used and
their effects on the environment. Sci. Total Environ. 2018, 613–614, 829–839. [CrossRef] [PubMed]
4. Ravishankara, A.R.; Daniel, J.S.; Portmann, R.W. Nitrous oxide (N2 O): The dominant ozone-depleting substance emitted in the
21st century. Science 2009, 326, 123–125. [CrossRef]
5. Tian, H.; Xu, R.; Canadell, J.G.; Thompson, R.L.; Winiwarter, W.; Suntharalingam, P.; Davidson, E.A.; Ciais, P.; Jackson, R.B.;
Janssens-Maenhout, G.; et al. A comprehen-sive quantification of global nitrous oxide sources and sinks. Nature 2020, 586,
248–256. [CrossRef] [PubMed]
6. Velthof, G.L.; Lesschen, J.P.; Webb, J.; Pietrzak, S.; Miatkowski, Z.; Pinto, M.; Kros, J.; Oenema, O. The impact of the Ni-trates
directive on nitrogen emissions from agriculture in the EU-27 during 2000–2008. Sci. Total Environ. 2014, 468–469, 1225–1233.
[CrossRef]
7. Butterbach-Bahl, K.; Nemitz, E.; Zaehle, S.; Billen, G.; Boeckx, P.; Erisman, J.; Garnier, J.; Upstill-Goddard, R.; Kreuzer, M.;
Oenema, O.; et al. Nitrogen as a Threat to the European Green-House Gas. Balance; Cambridge University Press: Cambridge, UK, 2011.Agronomy 2021, 11, 1712 14 of 15
8. Sutton, M.A.; Howard, C.M.; Erisman, J.W.; Billen, G.; Bleeker, A.; Grennfelt, P.; van Grinsven, H.; Grizzetti, B. The Europeean
Nitrogen Assessment: Sources, Effects and Policy Perspectives; Cambridge University Press: Cambridge, UK, 2011.
9. Butterbach-Bahl, K.; Baggs, E.M.; Dannenmann, M.; Kiese, R.; Zechmeister-Boltenstern, S. Nitrous oxide emissions from soils:
How well do we understand the processes and their controls? Philos. Trans. R. Soc. B Biol. Sci. 2013, 368, 1621. [CrossRef]
10. Wang, C.; Amon, B.; Schulz, K.; Mehdi, B. Factors that influence nitrous oxide emissions from agricultural soils as well as their
representation in simulation models: A review. Agronomy 2021, 11, 770. [CrossRef]
11. Rahman, N.; Richards, K.G.; Harty, M.A.; Watson, C.J.; Carolan, R.; Krol, D.; Lanigan, G.J.; Forrestal, P.J. Differing effects of
increasing calcium ammonium nitrate, urea and urea + NBPT fertiliser rates on nitrous oxide emission factors at six temperate
grassland sites in Ireland. Agric. Ecosyst. Environ. 2021, 313, 107382. [CrossRef]
12. Harty, M.; Forrestal, P.; Watson, C.; McGeough, K.; Carolan, R.; Elliot, C.; Krol, D.; Laughlin, R.; Richards, K.; Lanigan, G.
Reducing nitrous oxide emissions by changing N fertiliser use from calcium ammonium nitrate (CAN) to urea based formulations.
Sci. Total Environ. 2016, 563–564, 576–586. [CrossRef]
13. Krol, D.; Forrestal, P.; Wall, D.; Lanigan, G.; Sanz-Gomez, J.; Richards, K. Nitrogen fertilisers with urease inhibitors reduce nitrous
oxide and ammonia losses, while retaining yield in temperate grassland. Sci. Total Environ. 2020, 725, 138329. [CrossRef]
14. Lanigan, G.; Donnellan, T.; Hanrahan, K.; Carsten, P.; Shalloo, L.; Krol, D.; Forrestal, P.J.; Farrelly, N.; O’Brien, D.; Ryan, M.; et al.
An Analysis of Abatement Potential of Greenhouse Gas. Emissions in Irish Agriculture 2021–2030; Teagasc: Carlow, Ireland, 2018.
15. Forrestal, P.J.; Harty, M.; Carolan, R.; Lanigan, G.J.; Watson, C.J.; Laughlin, R.J.; McNeill, G.; Chambers, B.J.; Richards, K.G.
Ammonia emissions from urea, stabilized urea and calcium ammonium nitrate: Insights into loss abatement in temperate
grassland. Soil Use Manag. 2016, 32, 92–100. [CrossRef]
16. Clough, T.J.; Condron, L.M.; Kammann, C.; Müller, C. A review of biochar and soil nitrogen dynamics. Agronomy 2013, 3, 275–293.
[CrossRef]
17. Puga, A.P.; Grutzmacher, P.; Cerri, C.E.P.; Ribeirinho, V.S.; de Andrade, C.A. Biochar-based nitrogen fertilizers: Green-house gas
emissions, use efficiency, and maize yield in tropical soils. Sci. Total Environ. 2020, 704, 135375. [CrossRef] [PubMed]
18. Abalos, D.; Jeffery, S.; Sanz-Cobena, A.; Guardia, G.; Vallejo, A. Meta-analysis of the effect of urease and nitrification inhibi-tors
on crop productivity and nitrogen use efficiency. Agric. Ecosyst. Environ. 2014, 189, 136–144. [CrossRef]
19. Akiyama, H.; Yan, X.; Yagi, K. Evaluation of effectiveness of enhanced-efficiency fertilizers as mitigation options for N2 O and NO
emissions from agricultural soils: Meta-analysis. Glob. Chang. Biol. 2009, 16, 1837–1846. [CrossRef]
20. Cowan, N.; Levy, P.; Moring, A.; Simmons, I.; Bache, C.; Stephens, A.; Marinheiro, J.; Brichet, J.; Song, L.; Pickard, A.; et al.
Nitrogen use efficiency and N2 O and NH3 losses attributed to three fertiliser types applied to an intensively managed silage crop.
Biogeosciences 2019, 16, 4731–4745. [CrossRef]
21. Harty, M.A.; Forrestal, P.J.; Carolan, R.; Watson, C.J.; Hennessy, D.; Lanigan, G.J.; Wall, D.P.; Richards, K.G. Temperate grassland
yields and nitrogen uptake are influenced by fertilizer nitrogen source. Agron. J. 2017, 109, 71–79. [CrossRef]
22. Feng, J.; Li, F.; Deng, A.; Feng, X.; Fang, F.; Zhang, W. Integrated assessment of the impact of enhanced-efficiency nitrogen
fertilizer on N2O emission and crop yield. Agric. Ecosyst. Environ. 2016, 231, 218–228. [CrossRef]
23. Zhu-Barker, X.; Burger, M.; Doane, T.A.; Horwath, W.R. Ammonia oxidation pathways and nitrifier denitrification are significant
sources of N2 O and NO under low oxygen availability. Proc. Natl. Acad. Sci. USA 2013, 110, 6328–6333. [CrossRef]
24. Clayton, H.; McTaggart, I.P.; Parker, J.; Swan, L.; Smith, K.A. Nitrous oxide emissions from fertilised grassland: A 2-year study of
the effects of N fertiliser form and environmental conditions. Biol. Fertil. Soils 1997, 25, 252–260. [CrossRef]
25. YARA. Yara Fertiliser Industry Handbook; YARA: Oslo, Norway, 2018.
26. Fertilisers Europe. Infinite Nutrient Stewardship; Fertilisers Europe: Brussels, Belgium, 2016.
27. Duan, Y.-H.; Shi, X.-J.; Li, S.-L.; Sun, X.-F.; He, X.-H. Nitrogen use efficiency as affected by phosphorus and potassium in long-term
rice and wheat experiments. J. Integr. Agric. 2014, 13, 588–596. [CrossRef]
28. Morgan, M.F. Chemical soil diagnosis by the universal soil testing system. Conn. Agric. Exp. Stn. Bull. 1941, 450, 579–628.
29. de Klein, C.A.M.; Harvey, M. Nitrous Oxide Chamber Methodology Guidelines; Version 1.0 Global Research Alliance; Ministry for
Primary Industries: Wellington, New Zealand, 2012.
30. Chadwick, D.R.; Cardenas, L.; Misselbrook, T.; Smith, K.A.; Rees, R.; Watson, C.J.; McGeough, K.L.; Williams, J.R.; Cloy, J.M.;
Thorman, R.E.; et al. Optimizing chamber methods for measuring nitrous oxide emissions from plot-based agricultural
experiments. Eur. J. Soil Sci. 2014, 65, 295–307. [CrossRef]
31. Van Groenigen, J.W.; Velthof, G.; Oenema, O.; van Groenigen, K.J.; Van Kessel, C. Towards an agronomic assessment of N2 O
emissions: A case study for arable crops. Eur. J. Soil Sci. 2010, 61, 903–913. [CrossRef]
32. Tian, Z.; Wang, J.J.; Liu, S.; Zhang, Z.; Dodla, S.K.; Myers, G. Application effects of coated urea and urease and nitrification
inhibitors on ammonia and greenhouse gas emissions from a subtropical cotton field of the Mississippi delta region. Sci. Total
Environ. 2015, 533, 329–338. [CrossRef] [PubMed]
33. Byrne, M.P.; Tobin, J.T.; Forrestal, P.J.; Danaher, M.; Nkwonta, C.G.; Richards, K.; Cummins, E.; Hogan, S.A.; O’Callaghan, T.F.
Urease and nitrification inhibitors—As mitigation tools for greenhouse gas emissions in sustainable dairy systems: A review.
Sustainability 2020, 12, 6018. [CrossRef]
34. Nkwonta, C.; O’Neill, M.; Rahman, N.; Moloney, M.; Forrestal, P.; Hogan, S.; Richards, K.; Cummins, E.; Danaher, M. Development
of one-step non-solvent extraction and sensitive UHPLC-MS/MS method for assessment of N-(n-Butyl) Thiophosphoric Triamide
(NBPT) and N-(n-Butyl) Phosphoric Triamide (NBPTo) in milk. Molecules 2021, 26, 2890. [CrossRef]You can also read


