ANCESTRAL AREA RECONSTRUCTION OF SARS-COV-2 INDICATES MULTIPLE SOURCES OF ENTRY INTO AUSTRALIA - PREPRINTS.ORG
←
→
Page content transcription
If your browser does not render page correctly, please read the page content below
Preprints (www.preprints.org) | NOT PEER-REVIEWED | Posted: 28 June 2020

             Article

             Ancestral area reconstruction of SARS-CoV-2 indicates
             multiple sources of entry into Australia
             Ngoc Minh Hien Phan 1,2,*, Helen Faddy 1,2,3, Robert Flower 1,2, Kirsten Spann 1,4 and Eileen Roulis
             1,2

               1 School of Biomedical Sciences, Faculty of Health, Queensland University of Technology, Kelvin Grove,
                 Queensland 4059, Australia; kirsten.spann@qut.edu.au (K.S.)
               2 Research and Development Australian Red Cross Lifeblood, Kelvin Grove, Queensland 4059, Australia;

                 rflower@redcrossblood.org.au (R.F.); eroulis@redcrossblood.org.au (E.R.)
               3 School of Health and Sport Sciences, University of Sunshine Coast, Petrie, Queensland 4502, Australia;

                 hfaddy@usc.edu.au (H.F.)
               4 Institute for Health and Biomedical Innovation, Queensland University of Technology, Herston, Queensland

                 4006, Australia
               * Correspondence: hphan@redcrossblood.org.au; Tel: +61-738389382

               Abstract: The coronavirus disease 2019 (COVID-19) was officially declared a pandemic on the 11 th
               March 2020. It is caused by the novel severe acute respiratory syndrome coronavirus 2 (SARS-CoV-2),
               impacting the lower respiratory tract. International travel to Australia during the early stages of the
               pandemic prior to border closure provided avenues for this virus to spread into Australia. There is
               little understanding of the clonality of SARS-CoV-2 isolates in Australia, and where they originated.
               This study aimed to investigate the clonality and ancestral sources of SARS-CoV-2 isolates in Australia
               using in silico methods. We retrieved 1,346 complete genomes from Australia along with 153 genomes
               from other countries from the NCBI nucleotide database and Global Initiative On Sharing All
               Influenza Data (GISAID). We then constructed a representative population of 270 sequences for
               downstream phylogenetic analysis and ancestral area reconstruction. Overall, two major clusters, one
               stemming from Europe and another from Asia, especially East Asia, were observed, implying at least
               two major transmission events with subsequent clades confirming the multiclonality of Australian
               isolates. We also identified three potential dissemination routes of SARS-CoV-2 into Australia. This
               study supports the hypothesis of multiple clonality and dispersals of SARS-CoV-2 isolates into
               Australia.

               Keywords: SARS-CoV-2, COVID-19, novel severe acute respiratory syndrome coronavirus 2,
               ancestral reconstruction, clonality, source of entry, dispersal routes

             1. Introduction
                   Infections caused by the novel severe acute respiratory syndrome coronavirus 2 (SARS-CoV-2),
             the causative agent of coronavirus disease 2019 (COVID-19), were first reported in Wuhan, China in
             December 2019 [1, 2]. In January 2020, outbreaks of COVID-19 were reported outside China, initially in
             East and Southeast Asia, and then in the USA and Europe before spreading to Australia [1, 2]. The
             World Health Organisation (WHO) declared COVID-19 a pandemic on the 11th March 2020. As of the
             25th June 2020, over 9.2 million people have been diagnosed as infected worldwide with 479,133 deaths
             [3].
                   SARS-CoV-2 belongs to the same family, Coronaviridae, and genus, Betacoronavirus, as severe acute
             respiratory syndrome (SARS) and Middle East respiratory syndrome (MERS) coronaviruses [4]. SARS-
             CoV-2 is an enveloped single-stranded RNA virus with >29kb genome, which share 75-80% genetic
             similarity to SARS-CoV [5] and 96.2% to the bat corornavirus GISAID_EPI_ISL_402131, which was
             isolated from Yunnan in China [6]. The virus shares a similar genomic organisation to other

            © 2020 by the author(s). Distributed under a Creative Commons CC BY license.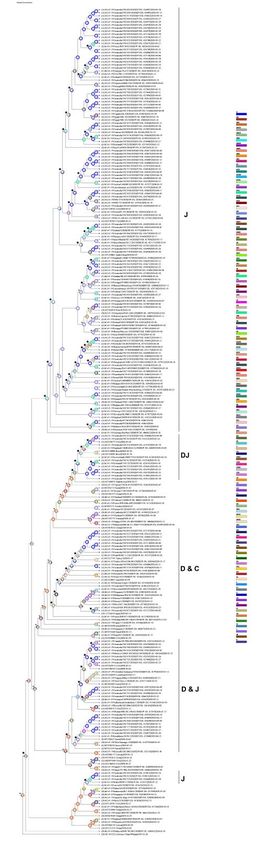
Preprints (www.preprints.org) | NOT PEER-REVIEWED | Posted: 28 June 2020

             coronaviruses, including short untranslated regions at both ends and five open reading frames (ORFs)
             encoding replicase polyproteins (ORF1ab), spike (S), envelope (E), membrane (M) and nucleocapsid
             (N) proteins [7]. People infected with SARS-CoV-2 can have mild symptoms such as fever, cough, sore
             throat, muscle pain or fatigue, or more severe symptoms such as acute respiratory distress syndrome
             and shortness of breath [2, 8, 9]. Other symptoms such as shock, diarrhea, and loss of smell/taste have
             also been reported [2, 8, 9]. The virus is contagious [10] and can be transmitted from human to human
             via close contact, small droplets or exposure to infected surfaces [4].
                  The first four cases in Australia were confirmed on the 25th January 2020, one in the state of Victoria
             (VIC) and three in the state of New South Wales (NSW) [11]. Australia activated a national COVID-19
             emergency plan on the 29th February 2020 [12]. At the height of SARS-CoV-2 outbreak in Australia, an
             approximate doubling of cases was confirmed every 3 days, rising from under 200 cases on the 13 th
             March 2020 to over 2,000 cases on the 27th March 2020 [11, 12]. Overseas acquired cases were more than
             two times higher than locally acquired cases prior to the closure of Australian borders to all non-citizens
             and non-residents on the 20th March 2020 [11]. As from the 25th June 2020, Australia recorded 7,558 cases
             and 104 deaths, including 608 cases from Western Australia (WA), 29 from Northern Territory (NT),
             1,066 from Queensland (QLD), 3,162 from NSW, 108 from Capital Territory, 440 from South Australia,
             1,917 from VIC and 228 from Tasmania [13]. There is little understanding of the clonality of SARS-CoV-
             2 isolates in Australia, and where they originated. This study used an in silico approach to assess the
             clonality and ancestry of SARS-CoV-2 isolates in Australia and to determine potential sources of
             dissemination of this virus, through ancestral reconstruction.

             2. Materials and Methods

             2.1 Sequence dataset collection and preparation
                  All human SARS-CoV-2 complete genomes from Australia were retrieved from the NCBI
             nucleotide database and Global Initiative On Sharing All Influenza Data (GISAID) on the 14th May 2020.
             In addition, one to fourteen SARS-CoV-2 complete genomes were randomly selected per country or
             region outside Australia, from either GISAID or NCBI nucleotide database, to represent overseas SARS-
             CoV-2 cases. The first sequenced SARS-CoV-2 isolate, NC_045512_China/Wuhan|2019-12-20 was
             included as a reference sequence and dated according to the patient’s onset of disease [14]. Duplicate
             identification or accession numbers were removed from the analysis. We performed manual curation
             of the dataset and removed 128 sequences having ≥3% of unassigned or ambiguous nucleotides over
             their entire genomes. CD-HIT EST [15, 16] was used to cluster nucleotide sequences of ≥ 99.5%
             similarity. As CD-HIT only retained one representative sequence from each cluster, regardless of the
             country of origin of the sequence, many of the international sequences would have been discarded.
             Therefore, we re-included SARS-CoV-2 genomes originating outside Australia that were removed by
             CD-HIT, in order to have at least a representative sequence for each nation even if they could technically
             be represented by another sequence. This resulted in a final dataset of 117 representative sequences
             from Australia and 153 representative sequences internationally.
                  The collected sequences were then aligned using MAFFT 2.1.11 [17, 18]. Misalignments were
             manually edited and regions with high numbers of Ns and ambiguous nucleotides were trimmed out.
             The latter regions predominantly occurred within the 3’- and 5’- untranslated regions, corresponding
             to    nucleotide     positions    start->55    and    29837->end      of    the    reference     sequence
             NC_045512_China/Wuhan|2019-12-20.

             2.2 Clonality analysis by network map
                  For clonality analysis, a variable dataset, in which gaps were not considered and invariable sites
             were removed, was generated from the DNA alignment of 270 sequences by DNAsp 6 [19]. A median-
             joining (MJ) network was then built using Network 10.1.0.0 [20, 21] (fluxus-engineering.com) with
             default weights at 10, connection cost for distance calculation, and an epsilon value of 10.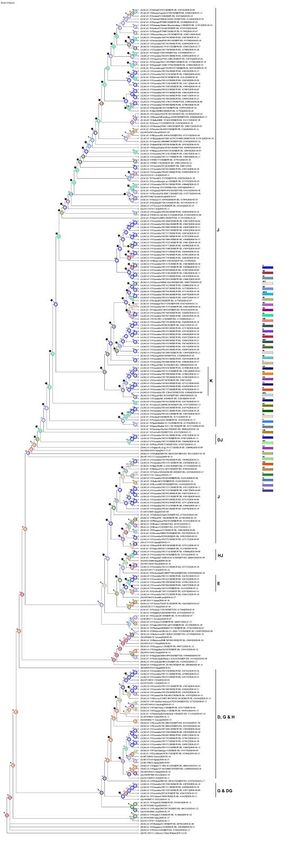
Preprints (www.preprints.org) | NOT PEER-REVIEWED | Posted: 28 June 2020

             2.3 Ancestral reconstruction phylogeny analysis
                  Approximated maximum-likelihood (ML) trees were built using FastTree 2.1.11 [22, 23] and IQ-
             tree 1.6.12 [24]. For FastTree, a default setting was used with 20 rate categories of sites. For IQ-tree,
             ModelFinder [25] tested 286 DNA models and selected the substitution model GTR+F+R3 as the best-
             fit model under Bayesian information criterion (BIC) to compute a consensus ML tree from 1000
             ultrafast bootstrap replicates [26]. For additional comparison, we performed Bayesian analysis of
             molecular sequences under a Markov Chain Monte Carlo (MCMC) method using BEAST 1.10.4 [27]
             with uncorrelated relaxed clock, GRT substitution model, empirical base frequencies, heterogeneity
             model of 4 gamma categories and an assumption of constant population size. TreeAnnotator 1.10.4 [28]
             was used to generate a target maximum clade credibility (MCC) tree summarised from sampled
             posterior trees produced by BEAST with the first 1,000 tree samples discarded as burn-in.
                  For all analyses, the trees were rooted to the reference NC_045512_China/Wuhan|2019-12-20. We
             assigned each SARS-CoV-2 sequence to a letter-labelled continent or subcontinent as follows: (A)
             Australia, (B) Southeast Asia, (C) West Asia, (D) East Asia, (E) South Asia, (F) North Asia, (G) North
             America, (H) South America, (I) Central Asia, (J) Europe, and (K) Africa. For IQ-tree and BEAST trees,
             we used the Bayesian statistical dispersal-vicariance analysis method (S-DIVA) [29] implemented
             within RASP [30] to reconstruct ancestral distribution based on a cost matrix of dispersal, vicariance
             and extinction events under generalised parsimony approaches [31]. For the FastTree tree, we used
             BayArea method [32] built within RASP to infer a phylogenetic biogeography through a matrix of
             instantaneous rate of change within a set of discrete geographic areas [32, 33]. Posterior probabilities of
             ancestral states were estimated at nodes on the FastTree phylogeny.

             3. Results

             3.1 Sequence dataset collection and preparation
                  Of the 1,499 human SARS-CoV-2 complete genomes initially collected from GISAID and NCBI
             nucleotide databases, we obtained 1,218 genomes isolated within Australia and 153 genomes outside
             Australia (figure 1) after removing 128 sequences having ≥3% noninformative sites – 124 from the state
             of VIC, Australia and four from the NT, Australia. By clustering sequences with a nucleotide sequence
             identity of 99.5% and selecting a representative sequence for each cluster, CD-HIT excluded 1,101
             SARS-CoV-2 sequences from Australia from 5 states/territories, and 117 genomes outside Australia,
             which were then manually re-included, finalising 270 genomes for downstream analysis (figure 1). The
             sequence MT121215_China|2020-02-02 was representative of the largest cluster of 844 sequences, 702
             of which were from Australia – 211 from NSW, 457 from VIC, 19 from QLD, 9 from WA and 6 from
             NT.       The       hCoV-19/Australia/VIC683/2020|EPI_ISL_426978|2020-03-29           and       hCoV-
             19/Australia/NT30/2020|EPI_ISL_430633|2020 sequences were representative of two Australian
             clusters of 158 and 104 SARS-CoV-2 genomes, respectively. The other sequences selected by CD-HIT
             represented smaller groups of 24 or fewer genomes. The clusters and representative sequences
             generated by CD-HIT redundancy reduction at a threshold of 99.5% nucleotide similarity was
             summarised in file S1.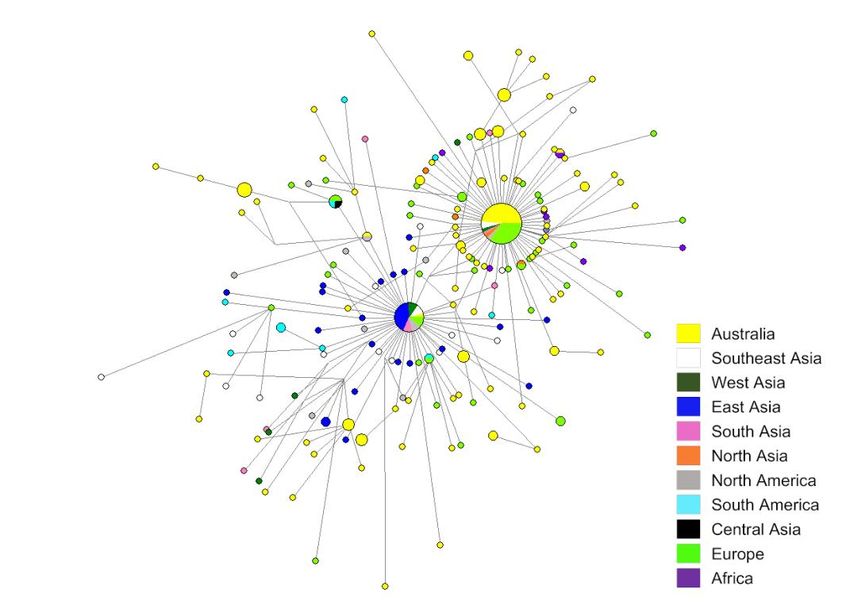
Preprints (www.preprints.org) | NOT PEER-REVIEWED | Posted: 28 June 2020

                  Figure 1. Number of SARS-CoV-2 complete genomes retrieved or removed at each step of sequence data
                  collection and preparation. State/territory of Australia: VIC - Victoria, NSW - New South Wales, NT -
                  Northern Territory, QLD - Queensland, and WA - Western Australia.

             3.2. Clonality analysis by network map
                 The phylogenetic network of the 270 SARS-CoV-2 sequences from Australia and overseas revealed
             two obvious clusters (figure 2), implying two main groups of SARS-CoV-2 isolates circulating in
             Australia. The majority of the Australian isolates were clustered with those from Europe, with the
             second cluster primarily from Asia, especially East Asia, as well as partly from North America. A
             smaller group of Australian SARS-CoV-2 sequences was genetically more similar to isolates from South
             America, which appear to be derived from founder strains in Asia or North America. These findings
             suggest at least two major transmissions, from Europe and Asia, are responsible for the majority of
             SARS-CoV-2 isolates circulating in Australia, as well as a minor transmission from the Americas. When
             examining distal nodes, further diversification of Australian isolates, as evidence of local transmission
             within Australia, appears to have occurred at least seven times subsequent to transmissions from
             Europe, Asia and the Americas. Taken together, these findings suggest that SARS-CoV-2 isolates in
             Australia are multiclonal.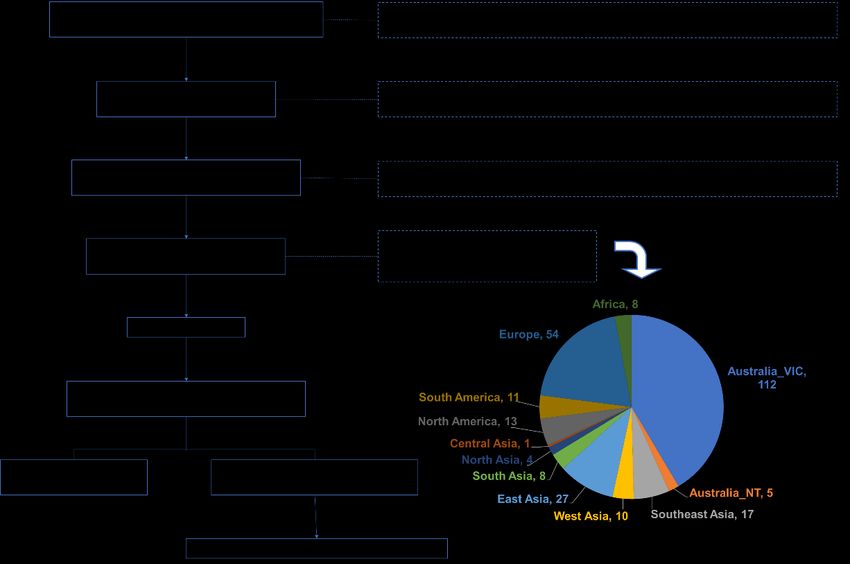
Preprints (www.preprints.org) | NOT PEER-REVIEWED | Posted: 28 June 2020

                  Figure 2. Median-Joining network of 270 sequences of SARS-CoV-2 isolates from Australia and
                  overseas. The size of nodes is proportional to the number of sequences in each cluster and the areas of
                  the nodes are proportional to the number of the sequences from each coloured geographical region. The
                  270 SARS-CoV-2 isolates yielded 183 haplotypes with distinct nucleotide variations. The branch length
                  is proportional to the number of variable nucleotide positions considered amongst the generated
                  haplotypes.

             3.3 Ancestral reconstruction phylogeny analysis
                  Reconstruction of ancestral area distribution based on ML and MCC trees allowed us to trace the
             most recent common ancestor of all lineages and to understand the biogeographic relationships among
             SARS-CoV-2 isolates. Dispersal routes from different (sub)continents to Australia were identified by S-
             DIVA using estimated costs (for FastTree and BEAST), where the cost of dispersal (the movement of a
             viral species across a geographical barrier to a new environment) is greater than vicariance (the
             diversification of a viral species within a geographical area) [31, 34]. The greater the cost, the more
             support for a dispersal route (table 1).

                  Table 1. Single area dispersal events to Australia identified for the IQ-tree, BEAST and FastTree
                  phylogenies*

                   Phylogeny              On IQ-tree phylogeny        On BEAST phylogeny         On FastTree phylogeny
                    (method)                    (S-DIVA)**                (S-DIVA)**                   (BayArea)
                Dispersal route to                B->A:1.5                  B->A:0.5                     B->A
                    Australia                    C->A:2.5                  C->A:1.5                      C->A
                                             D->A:1.666667                  D->A:2                       D->A
                                                   E->A:1                   H->A:1                       E->A
                                                 G->A:1.5                   J->A:12                      F->A
                                                 H->A:0.5                                                G->A
                                              J->A:14.33333                                              H->A
                                                                                                          J->A
Preprints (www.preprints.org) | NOT PEER-REVIEWED | Posted: 28 June 2020
K->A
Cost of dispersals to 23 17 N/A
Australia
Cost of all dispersals 122 123 N/A
identified over the
tree
* (A) Australia, (B) Southeast Asia, (C) West Asia, (D) East Asia, (E) South Asia, (F) North Asia, (G) North America,
(H) South America, (I) Central Asia, (J) Europe. ** Dispersal costs estimated by S-DIVA for corresponding dispersal
events.
For the IQ-tree phylogeny, all lineages converged to the node ABDJ, indicating that Southeast Asia,
East Asia and Europe were most likely common ancestors of SARS-CoV-2 strains in Australia (figure
3). In addition to ABDJ, Europe (J) or regions including Europe as part of ancestral ranges such as DJ,
CJ, or GJ) had sequences more closely related to the majority of strains in Australia, suggesting those
areas as potential sources of SARS-CoV-2 dissemination into the country. West Asia (C), North America
(G), South Asia (E) and South America (H) were also observed in internal ancestral nodes for a number
of Australian sequences, although to a lesser extent.Preprints (www.preprints.org) | NOT PEER-REVIEWED | Posted: 28 June 2020
Figure 3. Topology of optimal distribution of ancestral areas for the IQ-tree consensus maximum
likelihood phylogeny. The chart at nodes shows the probabilities of alternative ancestral ranges, with
only most likely ancestral states displayed at the centre. Big stars: dispersal events from/to Australia.
Small stars: other dispersal events. (A) Australia, (B) Southeast Asia, (C) West Asia, (D) East Asia, (E)Preprints (www.preprints.org) | NOT PEER-REVIEWED | Posted: 28 June 2020
South Asia, (F) North Asia, (G) North America, (H) South America, (I) Central Asia, (J) Europe, and (K)
Africa. Legends: colour-coded ancestral ranges of continents or combined continents
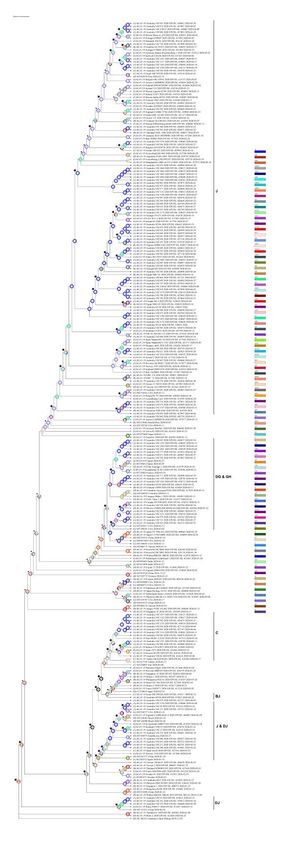
Similar to IQ-tree-based analysis, the S-DIVA analysis on BEAST tree (figure 4) suggests that the
region that combined Southeast Asia and East Asia (BD) was the most likely common ancestor for all
lineages. Meanwhile, ancestral ranges of Europe (J), East Asia (D) and/or West Asia (C) were located
more proximally to most Australian clusters, indicating these regions were additional minor sources of
viral entry to Australia.Preprints (www.preprints.org) | NOT PEER-REVIEWED | Posted: 28 June 2020
Figure 4. Topology of optimal distribution of ancestral areas for the BEAST maximum clade credibility
phylogeny. The chart at nodes shows the probabilities of alternative ancestral ranges, with only most
likely ancestral states displayed at the centre. Big stars: dispersal events from/to Australia. Small stars:
other dispersal events. (A) Australia, (B) Southeast Asia, (C) West Asia, (D) East Asia, (E) South Asia,
(F) North Asia, (G) North America, (H) South America, (I) Central Asia, (J) Europe, and (K) Africa.
Legends: colour-coded ancestral ranges of continents or combined continents
We used BayArea analysis to reconstruct ancestral ranges on the FastTree phylogeny (figure 5).
The finding was consistent with the previous analyses from IQ-tree and BEAST trees, except for a
greater range of geographic locations with the addition of Africa (K), North Asia (F) as minor sources
of viral dissemination to Australia (figure 5 and table 1).Preprints (www.preprints.org) | NOT PEER-REVIEWED | Posted: 28 June 2020
Figure 5. Mostly likely ancestral areas reconstructed at internal nodes of the FastTree maximum
likelihood phylogeny. Only most likely ancestral states are shown at the centre of the nodes with top
left posterior probabilities. Big stars: dispersal events from/to Australia. Small stars: other dispersal
events. (A) Australia, (B) Southeast Asia, (C) West Asia, (D) East Asia, (E) South Asia, (F) North Asia,
(G) North America, (H) South America, (I) Central Asia, (J) Europe, and (K) Africa. Stars: dispersal
events. Legends: colour-coded ancestral ranges of continents or combined continentsPreprints (www.preprints.org) | NOT PEER-REVIEWED | Posted: 28 June 2020
Like the analysis of SARS-CoV-2 network map, the ancestral area reconstructions showed several
clusters of Australian isolates themselves along the MCC and ML trees, implying occurrence of local
transmission events in this country. The data also indicated dissemination of SARS-CoV-2 strains from
Australia to other countries (table S1), particularly to Europe and Africa, which is however not the
scope of the study.
4. Discussion
To our knowledge, this is the first in silico study to investigate the clonality of SARS-CoV-2 strains
isolated from patients in Australia, in a local and international context. The network analysis of 270
sequences representative of 1,499 SARS-CoV-2 complete genomes from both Australia and
internationally, indicates viral multiclonality in Australia. Specifically, we found two main clusters of
Australian SARS-CoV-2 isolates: one cluster aligned mainly with isolates from Europe, while a second
cluster aligned primarily with isolates from Asia, particularly East Asia. A minor cluster was aligned
with those from the Americas. The finding is supported by the observation of two main ancestral ranges
(BD/ABDJ and J) identified over our three ML and MCC trees. This differs somewhat to a study by
Foster et al. (2020) [35] in which 160 SARS-CoV-2 complete genomes sampled worldwide were analysed
through its phylogenetic network. This study identified three main clusters from Europe, the Americas
and East Asia, distinguished by amino acid variations. We found Australian isolates aligned with those
from Asia and Europe, and very few isolates aligned with those from the Americas. This difference
could be explained by the effectiveness of public health interventions in Australia [36] such as border
closure on the 20th March 2020 [11] or enforced quarantine on the 28th March 2020 [37] before the number
of confirmed cases in the United States started to accumulate exponentially from late March 2020 [38].
Similarly, a study by Yu et al (2020) [39] using whole genomic data also categorised SARS-CoV-2 strains
from Australia into three groups which were infected by different sources, mainly from China, Belgium
and the United States.
Information on the transmission of SARS-CoV-2 strains into Australia is limited. The analysis of
ancestral reconstructions at internal nodes from the trees identified five (sub)continents as ancestral
areas or points of dissemination from which SARS-CoV-2 spread to Australia: Southeast Asia (B), West
Asia (C), East Asia (D), South America (H), and Europe (J). Meanwhile, the analyses of the ML and
MCC trees conducted here were all congruent in identifying Southeast and East Asia (BD) as the most
common recent ancestors of all lineages, ABDJ for the IQ-tree phylogeny and BD for the FastTree and
BEAST trees (figures 3-5). The majority of the sampled Australian SARS-CoV-2 isolates were
descendants of those originating from Europe (i.e. J, CJ, GJ or DJ). This is concurrent with findings from
a phylodynamic analysis by Seemann et al (2020) [36] that showed Asia and Europe as two of three
main sources for the clusters of returning Victorian travellers. Furthermore, the finding on IQ-tree and
FastTree trees identified dispersal events from North America (G) and South Asia (E) to Australia while
FastTree proposed additional dispersal routes from North Asia (F) and Africa (K). Based on the
evolutionary relationships among SARS-CoV-2 strains from different countries and event routes at
reconstructed ancestral nodes, we proposed three main routes for SARS-CoV-2 dissemination into
Australia: (1) viruses dispersed directly from East Asia and/or Southeast Asia to Australia (2) viruses
dispersed to several geographic locations mostly within Europe before entering to Australia, (3) viruses
dispersed to several geographic locations mostly outside Europe before entering to Australia.
Community transmission was also demonstrated by the clusters of Australian isolates along the
constructed phylogenies. However, no relevant demographic information of the SARS-CoV-2 isolates
other than their country of origin was available on GISAID and NCBI, their social risks of transmission
for these cases are unknown. Meanwhile, the findings of Seeman et al. (2020) provided genomic
evidence of local transmission which was highly associated with social gatherings [36].
We recognise that our study has limitations. The process of sequence retrieval, data curation and
clustering resulted in 117 Australian isolates - 112 Australian from VIC and 5 from NT, compared to
1,346 sequences initially collected. This means all sequences from the other Australian states than VIC
and NT were removed because of being clustered with representative local and overseas sequences inPreprints (www.preprints.org) | NOT PEER-REVIEWED | Posted: 28 June 2020
our dataset (figure 1). This may underestimate the importance of certain routes of SARS-CoV-2
dissemination to Australia and does not give a representation of community transmission within
Australia. For instance, there were fewer Australian isolates clustered with lineages dispersed from
East/South East Asia than there were from Europe. This is likely due to the removal of all isolates from
NSW, QLD and WA, 457 from VIC and 6 from NT, totalling over Australian 700 viral sequences from
our initial dataset by CD-HIT clustering, with these sequences represented by MT121215_China|2020-
02-02 from East Asia. Likewise, most of the sampled Australian SARS-CoV-2 isolates were from the
state of VIC and this limits the ability to determine possible interstate transmission of SARS-CoV-2
within Australia.
In conclusion, this investigation contributes to our understanding of multiple clonality and
dissemination of SARS-CoV-2 strains circulating in Australia. We highlighted a number of geographic
areas from which SARS-CoV-2 viruses circulating in Australia originated, with at least two major
dispersals into this country. Using network and phylogenetic analysis, we demonstrate that at least two
strains appear to be circulating within Australia, confirming the multiclonality of Australian SARS-
CoV-2 isolates. We demonstrate that Europe (J) and East Asia-Southeast Asia (BD) appear to be the
main geographical regions of dissemination into Australia, while confirming East and South-East Asian
strains as the most common recent ancestor to all strains circulating worldwide.
Supplementary Materials: Table S1: Dispersal events of SARS-CoV-2 isolates from Australia to other
(sub)continents identified for the IQ-tree, BEAST and FastTree phylogenies. File S1. The clusters and representative
sequences generated by CD-HIT redundancy reduction at a threshold of 99.5% nucleotide similarity.
Author Contributions: Conceptualization, N.M.H.P., E.R., H.F.; methodology, N.M.H.P. and E.R.; investigation,
N.M.H.P. and E.R.; data curation, N.M.H.P. and E.R.; writing—original draft preparation, N.M.H.P.; writing—
review and editing, all authors; visualization, N.M.H.P., E.R. ; supervision, E.R., H.F., R.F. and K.S.; project
administration, H.F., R.F. and E.R.
Funding: This research received no external funding. Australian governments fund Australian Red Cross
Lifeblood for the provision of blood, blood products and services to the Australian community.
Acknowledgments: We acknowledge Queensland University of Technology for granting to N. M. H. P. Australian
Government Research Training Program (RTP) Stipend (International) and QUT HDR Tuition Fee Sponsorship for
her Doctor of Philosophy degree.
Conflicts of Interest: The authors declare no conflict of interest.
References
1. Zhu, N., et al., A novel coronavirus from patients with pneumonia in China, 2019. New
England Journal of Medicine, 2020. 382(8): p. 727-733.
2. Wang, D., et al., Clinical characteristics of 138 hospitalized patients With 2019 novel
coronavirus-infected pneumonia in Wuhan, China. JAMA, 2020. 323(11).
3. World Health Organization. WHO coronavirus disease (COVID-19) dashboard. 2020;
Available from: https://covid19.who.int/.
4. Mohammed, U., et al., SARS-CoV-2/COVID-19: viral genomics, epidemiology,
vaccines, and therapeutic interventions. Viruses, 2020. 12(526): p. 526.
5. Zhou, Y., et al., Network-based drug repurposing for novel coronavirus 2019-
nCoV/SARS-CoV-2. Cell Discovery, 2020. 6(1).
6. Ceraolo, C. and F.M. Giorgi, Genomic variance of the 2019‐nCoV coronavirus. Journal
of Medical Virology, 2020. 92(5): p. 522-528.
7. Woo, P., et al., Coronavirus genomics and bioinformatics analysis. Viruses, 2010. 2(8):
p. 1804-1820.
8. Sun, P., et al., Clinical characteristics of hospitalized patients with SARS‐CoV‐2
infection: A single arm meta‐analysis. Journal of Medical Virology, 2020. 92(6): p.
612-617.Preprints (www.preprints.org) | NOT PEER-REVIEWED | Posted: 28 June 2020
9. Xydakis, M.S., et al., Smell and taste dysfunction in patients with COVID-19. The
Lancet. Infectious diseases, 2020.
10. Sanche, S., et al., The novel coronavirus, 2019-nCoV, is highly contagious and more
infectious than initially estimated. Preprint medRxiv, 2020: p. 2020.02.07.20021154.
11. Ting, I. and A. Palmer, One hundred days of the coronavirus crisis, in ABC News. 2020,
Australian Broadcasting Corporation: https://www.abc.net.au/news/2020-05-
04/charting-100-days-of-the-coronavirus-crisis-in-australia/12197884?nw=0.
12. Handley, E., From Wuhan to Australia: a timeline of key events in the spread of the
deadly coronavirus, in ABC News. 2020, Australian Broadcasting Corporation:
https://www.abc.net.au/news/2020-01-29/coronavirus-timeline-from-wuhan-china-to-
global-crisis/11903298?nw=0&pfmredir=sm.
13. Australian Government and Department of Health. Coronavirus (COVID-19) current
situation and case numbers. 2020; Available from:
https://www.health.gov.au/news/health-alerts/novel-coronavirus-2019-ncov-health-
alert/coronavirus-covid-19-current-situation-and-case-numbers.
14. Wu, F., et al., A new coronavirus associated with human respiratory disease in China.
Nature, 2020. 579(7798): p. 265.
15. Huang, Y., et al., CD-HIT Suite: a web server for clustering and comparing biological
sequences. Bioinformatics, 2010. 26(5): p. 680-682.
16. Li, W. and A. Godzik, Cd-hit: a fast program for clustering and comparing large sets
of protein or nucleotide sequences. Bioinformatics, 2006. 22(13): p. 1658-1659.
17. Katoh, K., et al., MAFFT: a novel method for rapid multiple sequence alignment based
on fast Fourier transform. Nucleic acids research, 2002. 30(14): p. 3059.
18. Katoh, K. and D.M. Standley, MAFFT multiple sequence alignment software version
7: improvements in performance and usability. Molecular Biology and Evolution,
2013. 30(4): p. 772-780.
19. Rozas, J., et al., DnaSP 6: DNA sequence Ppolymorphism analysis of large data sets.
Molecular Biology and Evolution, 2017. 34(12): p. 3299-3302.
20. Bandelt, H.J., P. Forster, and A. Röhl, Median-joining networks for inferring
intraspecific phylogenies. Molecular biology and evolution, 1999. 16(1): p. 37.
21. Fluxus. Free phylogenetic network software. Available from: fluxus-engineering.com.
22. Price, M.N., P.S. Dehal, and A.P. Arkin, FastTree: computing large minimum evolution
trees with profiles instead of a distance matrix. Molecular Biology and Evolution, 2009.
26(7): p. 1641-1650.
23. Price, M.N., P.S. Dehal, and A.P. Arkin, FastTree 2 – approximately maximum-
likelihood trees for large alignments (FastTree 2). PLoS ONE, 2010. 5(3): p. e9490.
24. Nguyen, L.-T., et al., IQ-TREE: a fast and effective stochastic algorithm for estimating
maximum-likelihood phylogenies. Molecular Biology and Evolution, 2015. 32(1): p.
268.
25. Kalyaanamoorthy, S., et al., ModelFinder: fast model selection for accurate
phylogenetic estimates. Nature methods, 2017. 14(6): p. 587-589.
26. Minh, B.Q., M.A.T. Nguyen, and A. von Haeseler, Ultrafast approximation for
phylogenetic bootstrap. Molecular Biology and Evolution, 2013. 30(5): p. 1188-1195.
27. Suchard, M.A., et al., Bayesian phylogenetic and phylodynamic data integration using
BEAST 1.10. Virus Evolution, 2018. 4(1).
28. Drummond, A.J. and A. Rambaut, BEAST: Bayesian evolutionary analysis by sampling
trees. 2007, BioMed Central. p. 214-214.
29. Yu, Y., A.J. Harris, and X. He, S-DIVA (Statistical Dispersal-Vicariance Analysis): A
tool for inferring biogeographic histories. Molecular Phylogenetics and Evolution,
2010. 56(2): p. 848-850.Preprints (www.preprints.org) | NOT PEER-REVIEWED | Posted: 28 June 2020
30. Yu, Y., C. Blair, and X. He, RASP 4: ancestral state reconstruction tool for multiple
genes and characters. Molecular biology and evolution, 2020. 37(2): p. 604-606.
31. Lamm, K.S. and B.D. Redelings, Reconstructing ancestral ranges in historical
biogeography: properties and prospects. Journal of Systematics and Evolution, 2009.
47(5): p. 369-382.
32. Landis, M.J., et al., Bayesian analysis of biogeography when the number of areas is
large. Systematic Biology, 2013. 62(6): p. 789-804.
33. Ree, R.H., et al., A likelihood framework for inferring the evolution of geographic range
on phylogenetic trees. Evolution, 2005. 59(11): p. 2299-2311.
34. Kodandaramaiah, U., Use of dispersal–vicariance analysis in biogeography – a
critique. Journal of Biogeography, 2010. 37(1): p. 3-11.
35. Forster, P., et al., Phylogenetic network analysis of SARS-CoV-2 genomes. Proceedings
of the National Academy of Sciences of the United States of America, 2020. 117(17):
p. 9241.
36. Seemann, T., et al., University of Melbourne: tracking the COVID-19 pandemic in
Australia using genomics. 2020.
37. Worthington, B., Forced coronavirus quarantine for all people returning to Australia,
in ABC news. 2020, Australian Broadcasting Corporation:
https://www.abc.net.au/news/2020-03-27/forced-coronavirus-quarantine-for-people-
returning-to-australia/12095898.
38. Roser, M., et al. Coronavirus pandemic (COVID-19). 2020; Available from:
https://ourworldindata.org/coronavirus.
39. Yu, W.-B., et al., Decoding the evolution and transmissions of the novel pneumonia
coronavirus (SARS-CoV-2 / HCoV-19) using whole genomic data. Zoological
Research, 2020. 41(3): p. 247-257.You can also read