ANNEX 1 - Regulatory Impact Assessment - Welsh Government - GOV.WALES
←
→
Page content transcription
If your browser does not render page correctly, please read the page content below
Welsh Government

ANNEX 1 – Regulatory Impact Assessment

Mae’r ddogfen yma hefyd ar gael yn Gymraeg.
This document is also available in Welsh.
      © Crown Copyright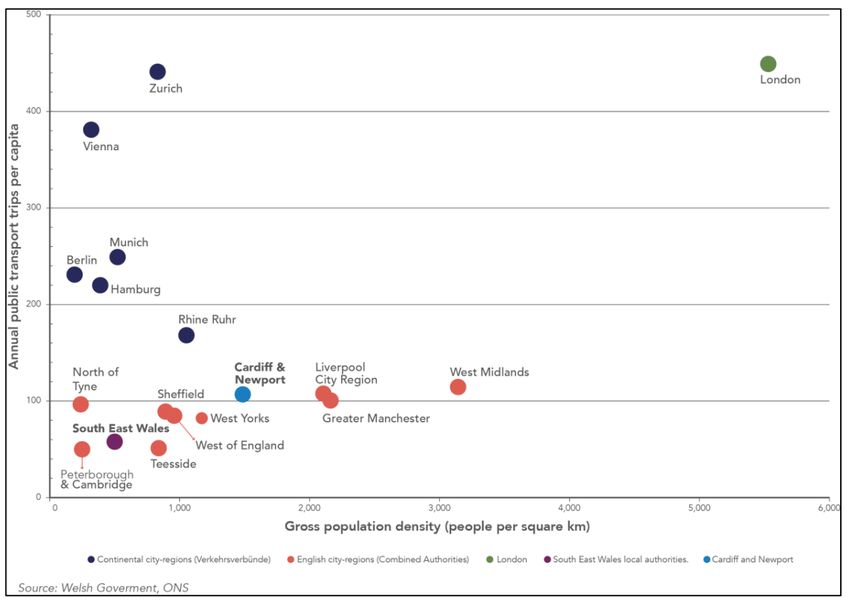
Preamble................................................................................................................................. 4
1.     Introduction ...................................................................................................................... 5
     1.1.    Defining the Policy Problem ..................................................................................... 5
       1.1.1.       Falling Patronage of Bus Services .................................................................... 5
       1.1.2.       The Present Bus Operating Model .................................................................. 10
     1.2.    Rationale for Government Intervention ................................................................... 15
       1.2.1.       Summary of relevant Welsh Government Policy ............................................. 15
       1.2.2.       Best Practice Bus Networks ............................................................................ 16
       1.2.3.       The Need for Bus Planning and Monitoring .................................................... 19
       1.2.4.       Best Practice Success Factors ........................................................................ 22
       1.2.5.       Public transport as a lifestyle choice ............................................................... 24
     1.3.    Options to Address the Policy Problem .................................................................. 25
       1.3.1.       Option 1: Business as Usual ........................................................................... 25
       1.3.2.       Option 2: Statutory Partnerships ..................................................................... 25
       1.3.3.       Option 3: Franchising ...................................................................................... 26
2.     Costs and Benefits ......................................................................................................... 28
     2.1.    Methodology ........................................................................................................... 28
       2.1.1.       Modelling Costs and Benefits .......................................................................... 28
       2.1.2.       Assessment Scenarios .................................................................................... 30
       2.1.3.       Timeframes ..................................................................................................... 31
     2.2.    Option 1: Business as Usual .................................................................................. 31
       2.2.1.       Costs of Option 1: Business as Usual ............................................................. 31
       2.2.2.       Benefits of Option 1: Business as Usual ......................................................... 32
       2.2.3.       Summary of Costs and Benefits of Option 1: Business as Usual .................... 33
     2.3.    Option 2: Statutory Partnerships ............................................................................ 33
       2.3.1.       Costs of Option 2: Statutory Partnerships ....................................................... 33
       2.3.2.       Benefits of Option 2: Statutory Partnerships ................................................... 36
       2.3.3.       Summary of Costs and Benefits of Option 2: Statutory Partnerships .............. 37
       2.3.4.       Costs and Benefits of Statutory Partnership Plus+ Scenario .......................... 37
     2.4.    Option 3: Franchising ............................................................................................. 40
       2.4.1.       Costs of Option 3: Franchising ........................................................................ 40
       2.4.2.       Benefits of Option 3: Franchising .................................................................... 45
       2.4.3.       Summary of Costs and Benefits of Option 3: Franchising ............................... 50
       2.4.4.       Costs and Benefits of Franchising Plus+ Scenario ......................................... 51

                                                                     2
2.5.     Summary and Preferred Option .............................................................................. 53
Appendix 1: Costs Assumptions Summary ........................................................................... 57
Appendix 2: Methodology and assumptions for calculation of Benefits ................................ 63
Appendix 3: Cost and Benefits Estimates Summary ............................................................ 85

                                                           3
Preamble
This draft regulatory impact assessment (RIA) aims to assess evidence about the
costs and benefits of delivering high quality bus networks, comparing a baseline
scenario with franchising, and an enhanced partnership approach, such as are being
introduced in England, as well as considering further investment beyond legislative
change, to set out a comparison between different policy approaches.
The draft RIA considers the cost of a franchising model where each local authority is
responsible for franchising services in their area. This provides a conservative
resource cost estimate that represents functions duplicated over all 22 authorities.
This offers the advantage of providing a fair comparison to an alternative enhanced
partnership model, simply on the benefits they can offer passengers, without
considering the economies of scale available from franchising at a national level. It
also has the advantage of providing a cost comparison that does not pre-suppose
the outcome of the corresponding white paper consultation.
Although this local franchising model is not the preferred policy approach set forward
in the white paper, which aims above to set out the benefits of taking a regional view
of network plans and concentrating franchising skills at the national level, it has been
adopted in the draft RIA to give a level playing field for comparison of the different
forms of bus governance.
The methodology for assessing costs and benefits is based on relevant transport
appraisal guidance as set out within the RIA. Use of guidance has been
supplemented by consultation with Welsh Government economists, to ensure the
assessment is aligned with the values and strategic transport objectives of the Welsh
Government. The costs and benefits presented in this draft RIA are not suitable for
comparison with the Explanatory Memorandum prepared for the previous draft bus
legislation, which also considered franchising and partnerships. More detailed
analysis of potential changes to bus networks has been undertaken to inform this
version of the RIA and various cost and benefits assumptions have been amended
to reflect plans for bus reform in Wales.
Subject to the outcome of this consultation the draft RIA will be updated to reflect the
policy as it is presented in the proposed bill. This will include additional consideration
of resources required during the transition period and future steady state operating
model.
We would welcome any comments or feedback on the modelling and analysis
contained in the draft RIA.
41. Introduction
1.1. Defining the Policy Problem
1.1.1. Falling Patronage of Bus Services
1.1.1.1. Bus journeys account for approximately three quarters of all
journeys made by public transport in Wales and perform a critical
role in providing access to jobs, services, education, hospitals and
leisure activities. Bus use in Wales has been generally falling since
the 1980s, from around 180M passenger trips per year in 1986/87,
to 130M trips in 2008/09, and 101M trips per year in 2018/19 – a
56% drop since 1987, and a 22% drop since 20091. It should be
noted that the population of Wales has increased by 8.2% between
1998 and 2018, and by 3.7% between 2008 and 2018. The fall in
bus use has thus taken place against a growth in overall population
and total trips by all modes. This trend can be compared with a
growth of car traffic (in vehicle kilometres) of 45% from 1993 to
20182. Hence overall the bus services in Wales have collectively not
been able to maintain mode share.
1.1.1.2. Over the long period of decline in bus use, regular investment
has been made by Welsh Government and local authorities in bus
measures and improvements. This includes schemes such as bus
stations and interchanges, on-street and segregated bus priority
measures, ongoing bus stop improvements, improved online bus
information and journey planning via Traveline Cymru, increasing
the network of TrawsCymru bus services, significant annual support
grants based on operator mileage (Bus Services Support Grant;
BSSG), and the all-day concession fare reimbursement scheme.
The advent of free concessionary fares for older people and people
with mobility difficulties, for a period of some years after their
introduction produced the most significant reversal of the declining
longer-term ridership trend.
1.1.1.3. Welsh Government’s reimbursement of concession fares to
operators is made for trips at any time of day, unlike in England
where trips in the morning peak are not covered by concession
travel. In Wales, fares are reimbursed to operators at approximately
two thirds of the regular single fare, which, when concession
travellers make a two-way return journey, can often provide a net
1
Department for Transport. 2021. BUS0103: Passenger journeys on local bus services by
metropolitan area status and country
2
StatsWales. 2021. Volume of road traffic by road classification and year
5revenue similar to a normal Return Ticket (or Day Ticket). The
reimbursement scheme has had a significant effect on maintaining
overall trip numbers. A proportion of concession trips are recognised
as ‘generated’ trips which would not have otherwise been made if
fares were charged, and also the revenue generated has
underpinned the provision of all bus services to attract fare-paying
passengers. Selected statistics3 illustrate the reliance on the
concession reimbursement arrangement to maintain patronage
levels:
Half or all bus trips in Wales (50%) in 2019/20 were made by
concessionary passengers (up from 43% in 2008); and
The fall in fare-paying bus patronage from 2008 to 2018 was
25%4, whereas the fall in concession journeys was 10% over
the same period.
1.1.1.4. Discussions with local authorities, engagement and consultation
with bus operators (in the context developing bus reform proposals
in 2018-19) and desktop research suggests that the historical
reduction in bus patronage is due to a combination of factors. These
include:
Complicated ticket offers and lack of integrated tickets for
use on different operators’ services;
Lack of stability of bus service routes and timetables (which
means that people are unwilling to commit to using public
transport as part of their daily life);
Reductions in the number of local authority supported bus
services which leads to less bus trips; and
Slow and unreliable bus journey times makes bus less
attractive to potential users, and also increases operating
costs – which has a knock-on effect of reduced frequency,
which increases waiting times and further reduces
attractiveness of buses, and which as a further deterrent to
passengers increases the fare prices operators have to
charge to cover their costs.
1.1.1.5. Data and research also identify external factors which create
challenges to attracting people to use buses, including:
3
Department for Transport. 2021. BUS0105: Concessionary passenger journeys on local bus
services by metropolitan area status and country
4
Department for Transport. 2021. BUS0103: Passenger journeys on local bus services by
metropolitan area status and country
6 Increasing car ownership5 – with the proportion of
households in Wales without access to a car or van (for
activities such as visiting local shops or going to the doctor)
falling steadily from 21% in 2013 to 13% in 2019, which
inevitably reduces bus patronage;
The cost of bus travel has increased relative to the cost of
motoring. At a UK level, average bus fares have risen by
403% since 1987, compared to just 163% for motoring
costs6;Activity for work, leisure and retail has shifted from
town centres to edge of town, car-served, low density
monofunctional spaces like the business park, retail park or
owner-occupier estate, creating polycentric patterns of
movement7. This type of movement does not align well with
traditional radial bus services into town centres; and
A rise in on-line shopping – which tends to reduce the
demand for bus travel on core bus routes into town centres.
1.1.1.6. The COVID-19 pandemic from 2020 has also contributed to a
trend of working from home for those occupations where this is
possible, which is likely to be a long-term phenomenon, and which
has beneficial policy outcomes in terms of reducing travel and
associated carbon emissions, but also contributes to lowering bus
use. Welsh Government announced in 20208 a long-term ambition to
see around 30% of Welsh workers working from home or near home
– giving more people the choice to work in a way that helps their
productivity as well as their work-life balance, and with the potential
to drive regeneration and economic activity in communities.
1.1.1.7. The importance of car ownership and car availability in peoples’
mode choice is underlined by data which shows that the vast
majority of bus trips are taken by people with no access to a car for
that trip (for example, surveys in Swansea in 2014 indicated that
only around 15% of people making bus journeys had access to a car
for that trip9). It can be concluded that choosing between bus and
car is not a practical consideration for most people’s journeys, and
that a significant proportion of bus patronage in Wales is made up of
a ‘captive market’ of:
5
Welsh Government. 2021. Llwybr Newydd: a new Wales transport strategy - Supporting information:
transport data and trends
6
Department for Transport. 2021. Bus Back Better: national bus strategy for England
7
Welsh Government. Foundational Economy Research. 2021. Small Towns, Big Issues: aligning
business models, organisation, imagination
8
Welsh Government. 2020. Aim for 30% of the Welsh workforce to work remotely
9
SWWITCH. 2014. South West Wales Travel Pattern Survey
7 people without access to a car (including students, who use
buses in large numbers in Wales’s university cities); and
concessionary passengers who travel for free (which
comprises of almost half of all bus journeys).
1.1.1.8. Another key inhibitor of bus use is that bus journeys are
generally only practical for direct, single leg, bus journeys – which
means that bus travel excludes a large proportion of all trips which
are not served by direct bus trips. For example, in Cardiff, around
30% of jobs are in the city centre10 – which is well served by bus.
However, the majority of trips in the city are not to and from central
areas, and these are generally not well served by bus (and hence
are typically made by car). Census data shows that ‘direct’ journeys
on urban radial bus corridors generally have a relatively healthy bus
mode-share for Journey to Work of over 20%11 - but indirect
journeys have a much lower bus mode share. An illustrative but
realistic theoretical example shows the typical make-up of bus mode
share:
Illustrative theoretical example of bus mode share for direct
and indirect journeys
In a typical urban area with 100,000 trips by all modes in the
morning peak period, direct buses may only be a realistic choice
for around 40% (or 40,000) of those trips (i.e. those trips which are
on radial bus corridors towards the central area). Assuming these
radial journeys have a relatively high mode share of 20%, this
results in 8,000 bus trips. The remaining 60% of trips (60,000) are
not well aligned to radial bus corridors, and hence a much lower
bus mode share of around 4% is typical, equating to 2,400 trips by
bus. Overall, the number of bus trips is therefore 10,400,
equivalent to approximately 10% of all trips. This is an average
figure which conceals the wide range of high mode share (for
radial journeys which are well served by bus) and low mode share
(for non-radial journeys that are not) for movement patterns with
different geographical orientations.
1.1.1.9. The illustrative case shows that in order to significantly grow bus
usage, it is important to be able to attract some of the ‘indirect’
journeys, which typically make up the majority of trips in an area but
are presently hard to make by bus. For example, a typical car
journey across a town, if made by bus, would be likely to involve
undertaking an indirect, two or three-leg journey by bus (or by bus
and rail), which would presently be an unrealistic and unappealing
10
ONS, 2018, Business Register and Employment Survey
11
Census. 2011. Method of travel to work - Llysfaen/Llanddulas to Llandudno (Central) 20.5% bus
mode share, Leckwith/Canton to Cardiff City Centre 48% bus mode share.
8trip due to the lack of co-ordination between bus services, and
complex ticketing arrangements. This leads to a conclusion that for
bus to meet people’s everyday travel needs, the ‘in-scope’ journey
market for bus travel needs to be widened, which in turn means that
operating bus service lines as a co-ordinated network is necessarily
a key feature of success – such that customers can realistically
reach multiple places on the network (with the ability to easily
transfer between services as necessary).
1.1.1.10.In summary therefore, the key aspects of the historical fall in bus
passenger numbers in Wales are:
Bus use has reduced over time even though the population
has grown, and in comparison, car use has grown
significantly;
Regular investment in bus services and infrastructure by
Welsh Government (although beneficial) has failed to
overturn the decline in bus use;
Welsh Government’s free concession travel has masked the
decline in bus patronage, and temporarily reversed it, and
the associated fare reimbursement scheme continues to be
fundamental to maintaining bus services;
Complicated ticket offers, lack of integrated tickets, and lack
of stability of bus service routes all combine to make regular
bus travel unappealing;
Reductions in local authority support for bus services has led
directly to fewer bus trips;
Traffic congestion has led to slower and unreliable bus
journey times, which makes bus less attractive, and also
increases operating costs and thus fare prices (and can lead
to a reduced frequency which increases waiting times and
further reduces patronage);
Much land use development in recent years and decades
has not aligned with traditional radial bus routes;
Increasing car ownership, comparatively low costs of
motoring relative to bus travel, a rise in online shopping and
working from home have also contributed to the decline in
bus use.
1.1.1.11. The ability of the bus sector to halt the decline in patronage is
inhibited by the tendency for bus operators to follow a logical
commercial imperative of focussing on the most profitable market,
that comprising people making journeys on radial corridors towards
central areas, a focus which is also the strongest defence to deter
competitor incursions which would bite heavily into profit margins.
This means that the target market for bus companies in an
unregulated environment largely excludes the large number of trips
9which start and end outside central areas. This effectively caps the
potential bus user market to a minority of trips in an area.
Addressing this shortfall will necessarily require bus service lines to
be operated as a co-ordinated network – such that customers can
realistically reach a much wider range of destinations (with the ability
to easily transfer between services as necessary).
1.1.2. The Present Bus Operating Model
1.1.2.1. The bus sector in Wales (and the rest of Great Britain) has been
deregulated since 1986, which means that bus operators design
routes and set fares for the majority of bus services (subject to
operating standards regulated by the Traffic Commissioner).
1.1.2.2. Given this arrangement, bus operators quite rationally focus
primarily on maximising their revenue in comparison to their
operating cost – and hence understandably are not in a position to
prioritise ‘policy’ aspects such as maximising mode share of bus in a
town or city. Bus operators instead focus on maintaining their core
market of passengers, focusing in particular on people whose
regular journeys are constrained to radial bus corridors connected to
central areas. As noted previously, in the context of growing car
ownership12, low costs of car use relative to bus fares and a
tendency for polycentric land use development (over recent
decades), this core bus market has been slowly decreasing.
1.1.2.3. Bus operators effectively control and decide where most core
bus services are operated in Wales. This has led to a situation in
which local authorities’ transport plans have historically focused on
bus infrastructure measures – and neglected consideration of the
overall bus network in respect of defining goals and objectives,
identifying problems, and generating network plans (with co-
ordination of routes and frequencies). This lack of focus on long-
term network planning for bus is a natural result of the fragmentation
of responsibilities between multiple operators and local authorities –
with the former focussed on operating their own bus services to best
commercial effect and with a completely free hand to run buses
where and when they wish, whilst the latter are focussed on setting
transport policies and providing and maintaining transport
infrastructure whilst lacking an ability to provide bus services other
than those serving destinations and times which commercial bus
operators do not wish to serve, and having very limited ability to
influence the offering provided by commercial operators. Whilst
historically there has been a good level of engagement and
partnership working between Welsh Government, Local Authorities
12
Welsh Government. 2021. Llwybr Newydd: a new Wales transport strategy - Supporting
information: transport data and trends
10and bus operators in Wales, there is an inevitable lack of strategic
planning and a consequent ‘misalignment of incentives’ (as
described in documentation prepared by the UK Department for
Transport as part of development of the England-wide 2017 Bus
Act13).
1.1.2.4. The fragmentation of bus-related activities in Wales involves
over 80 bus operators providing around 800 bus routes; 22 local
authorities procuring some of these bus services; local authorities
also managing BSSG payments to operators; concession passes
and reimbursement managed via Transport for Wales; information
and timetables provided in various formats via operators, local
authorities, and Traveline Cymru; local highway departments
maintaining bus stop and road infrastructure; education departments
procuring school buses; and four rail franchises operating in Wales
with which bus services often compete. There is thus an inherent
complexity of interfaces, with a lack of overall planning and clear
responsibility for outcomes – which tends to result in each service
line being operated as a discrete service with no coordination with
other services. This model also leads to financial inefficiencies due
to overlaps of bus services (and sometimes overlaps of bus and rail
services), and challenges of aligning infrastructure and operational
matters.
1.1.2.5. Research studies on the UK’s deregulated environment for bus
include conclusions that the current bus model precludes provision
of a co-ordinated network and integrated ticketing – with
disadvantages noted as follows14:
“Little opportunity to view the network as a whole”, with
tendered services operating as an “add on to the commercial
network covering areas and/or time periods which are not
considered commercially viable”; and
“In conflict with other policy objectives aimed at stimulating
greater use of public transport, such as harmonisation of
ticketing systems.”
1.1.2.6. In terms of funding, in 2018/19 Welsh Government and local
authorities in Wales contributed funding of around £115M to the
annual bus operator revenue in Wales of approximately £210M
(Source: Welsh Government). This means that, even prior to the
impacts of the Covid pandemic, over half (c. 55%) of overall bus
revenue was government funded. The breakdown of recent annual
bus revenue in Wales is summarised as follows (Source: Welsh
13
DfT. 2016. Bus Services Bill Impact Assessments
14
White, P. 2010. The conflict between competition policy and the wider role of the local bus industry
in Britain.
11Government):
Fare-payer revenue at around £95M in 2018/19, which
represents around 45% of overall revenue of around £210M;
Concession fare reimbursement payments of around £68M;
and
Around £47M of grant payments to operators and local
authorities (for BSSG and support for tendered services).
1.1.2.7. In the deregulated environment, operators behave rationally by
choosing the busiest corridors to operate commercial services, with
a reliance on some government support (through the BSSG fund,
which provides a per km payment, and with concession fare
reimbursement). Bus routes which are not identified by operators as
commercial, and which are deemed to be socially necessary, are
subsidised by local authorities – with operators contracted to operate
these services (via net or gross contracts). In overall terms, and in
common with typical international examples of bus networks, each
local group of bus services operated in each area of Wales are not
commercial in their totality and require significant government
financial support.
1.1.2.8. Furthermore, a significant proportion of bus routes in Wales
designated as commercial are in fact subsidised via a local
authority-funded by de-minimis ‘top-up’ subsidy; for example, to
provide services into the evenings and on Sundays. This means that
operators can accrue revenue from sale of day-ticket fares for
boardings during the daytime – and be subsidised for providing the
return trip in late evening.
1.1.2.9. Bus ticketing technology in Wales has been subject to significant
improvement in recent years. Payments can now be made via
credit/debit card contactless payment or by smartphone app, as well
as cash payment on most services. In some areas multiple operator
tickets are available (although generally only from bus drivers, rather
than in advance through other outlets) which allows passengers to
use different operators’ bus services on the same trip, or on the
same day, provided they made that choice at the start of their
journey. However, these multi-operator tickets are generally more
expensive than single operator tickets. Although multiple operator
tickets are feasible to implement, the competition requirements of
the current deregulated regime means that operators continue to
provide their own tickets, if they wish at a lower price, and hence
customers are not provided with the simplicity of a single ticketing
product (which effectively gives passengers a ‘freedom pass’ which
they can use at any time to make planned or ad-hoc trips).
1.1.2.10. If in future, multi-operator tickets were made more widespread
and attractive (although without re-regulation there would be a legal
12requirement for operators’ own ticket systems to remain in
operation), this could lead to a growth in linked trips, with
passengers using a number of different service lines during a single
journey or over a whole day. However, if this increase in multi-leg
bus use occurred, a commensurate system for re-distribution of
revenue to operators would be needed – on the basis that a
simplistic allocation of revenue (e.g. where a passenger first boards
a bus, or an equal split for every boarding) would be very likely to
result in an inequitable allocation to different operators’ services. A
fair fare redistribution arrangement would need to consider factors
such as vehicle mileage, vehicle travel time (and congestion effects),
urban/rural routing, time of day, type and size of bus, passenger
numbers, passengers transferring between lines, and cross-
subsidisation of services such as late night ‘homebound’ service with
low numbers of passengers. It is therefore likely that even if a multi-
operator ticket was to gain a significant market share under the
present regulatory arrangements, then the system for reallocation of
revenue would effectively dictate the commerciality of operators’
businesses. The resulting revenue aggregation and redistribution
process and inter-dependency between operators would be likely to
raise competition issues. Furthermore, operators would be unlikely
to commit to this approach as it would reduce their commercial
independence and would also in practice involve continual
negotiation and amendments in response to any changes in demand
or costs – such as changes to bus services, land use changes,
congestion/roadworks, upgrades to parallel rail lines etc. Hence,
overall, there are, in the absence of regulatory change, major legal
and commercial barriers to putting in place a single ticket system
which is used by all passengers, and from which the fare revenue
can be equitably redistributed to operators.
1.1.2.11. There has been an emergence in recent years of new mobility
solutions such as shared-bike schemes, app-based mobility services
(e.g. Uber), micro-mobility services (such as e-bikes and electric
scooters), as well as an increased focus by Welsh Government on
walking and cycling. Users of these modes are often without access
to a car, similar to many bus users, and hence there is a risk that
use of, for example, short-hire shared-bikes and improved cycle
infrastructure will result in abstraction from bus patronage. This
highlights the challenge of the current bus model – with operators
typically prioritising their own business plan without coordination to
maximise potential synergies with local authorities who are investing
in infrastructure and/or providing financial support to other
sustainable modes which are likely to abstract from bus patronage to
some degree, but could also integrate to feed additional users into
bus networks.
1.1.2.12. Hence, the overall situation in respect of the current bus
13operating model is as follows:
There is a fragmentation of responsibilities for bus between
multiple operators and local authorities with an associated
difficulty of alignment in respect of common goals and policy-
based outcomes;
Local authorities’ limited role in managing bus networks
means that bus public transport systems are not subject to
transport planning as would typically be the case for, for
example, road network improvement;
Bus service lines are typically operated as a set of discrete
services with no coordination with other services – as no
single organisation has the appropriate capability and
directive powers to manage this co-ordination;
Welsh Government funding accounts for over half of bus
operating costs in Wales, but is largely directed to operators
without linkage to any long-term improvement strategies; and
Although multiple operator tickets are feasible to implement
under the current arrangements, operators would continue to
provide their own tickets, which ultimately fails to provide
customers with the simplicity of a single ticketing product.
Furthermore, any significant market penetration by a multi-
operator ticket will also bring a need for a complex revenue
redistribution system to different services and operators, that
would likely need continual re-negotiation in response to
changes to road conditions, land use, service frequencies
etc.
1.1.2.13. Taken together this produces a complex landscape for planning
and service delivery of public transport, with a fragmentation of
responsibilities, which means that the bus sector is unable to
respond in a cohesive and strategic manner to the challenges of
long-term declines in ridership.
141.2. Rationale for Government Intervention
1.2.1. Summary of relevant Welsh Government Policy
1.2.1.1. Welsh Government is promoting and investing in sustainable
travel and decarbonisation – underpinned by policy documents:
Wellbeing of Future Generations Act: The Well-being of
Future Generations (Wales) Act 2015 places a duty on public
bodies in Wales to carry out sustainable development. This
means that each public body must work to improve the
economic, social, environmental and cultural well-being of
Wales.
Llwybr Newydd: The new Wales Transport Strategy sets
out a vision of ‘an accessible, sustainable and efficient
transport system’. Modal shift is at the heart of the strategy,
which means the proportion of trips made by sustainable
modes increases and fewer trips are made by private cars.
Llwybr Newydd contains a mini plan for buses which sets
specific priorities for the sector, including improving the
quality and reach of services, addressing congestion
hotspots, keeping people safe and delivering new technology
and infrastructure.
Net Zero Wales: The Welsh Government has committed to
delivering the following targets to decarbonise the bus fleet:
The whole Traws Cymru bus fleet to be zero tailpipe
emission by 2026;
The most polluting 50% of service buses to be replaced
by a zero-tailpipe emission bus fleet by 2028; and
The remaining 50% of the service bus fleet to be zero
emission by 2035.
Bws Cymru: Bws Cymru has considered and developed
policies for bus services in the context of Llwybr Newydd.
Bws Cymru amplifies and builds on the proposals in Llwybr
Newydd to make the bus services more attractive for people
to use in order for them to go about their daily lives with
ease, promoting social mobility and economic activity. The
policies seek to create the environment to allow a greater
levels of service provision and flexibility, helping to provide
integrated public transport services, seeking to result in
increasing patronage from all sectors of society, reducing car
use, reducing carbon emissions and improving air quality. In
essence, Welsh Government wants to create a bus system
with passengers as its focus, which is easy to access, has
extensive networks, is easy to use in terms of through
ticketing, easy to understand and navigate – expressed in
Bws Cymru as each local area or region having ‘One
Network, One Timetable, One Ticket’. Bws Cymru
15recognises the need to legislate for regulation of bus
services to achieve this, whilst laying out a set of actions that
are possible in the immediate future to achieve steps in that
direction prior to the advent of changes to the bus
governance system.
1.2.2. Best Practice Bus Networks
1.2.2.1. Addressing shortfalls in the current bus arrangements in Wales
requires adoption of best practice for the shape and frequency of
services. Best practice guidance states that a network-based
approach is essential for public transport success15 (in terms of
service quality, mode share and costs of operation) and depends on
addressing the following key requirements:
An integrated network of bus lines, with easy and
comfortable transfer opportunities at several places in the
region, not only at the main railway station or city/town
centre;
A simple network with a clear line structure that is easy to
understand and remember (for everyone – not just regular
users);
Direct route alignment and the fastest possible speed of
vehicle operations with reliable timetables;
High frequency services where and when the demand is
reasonably high;
Coordinated pulse timetables where demand is weaker in
less dense urban areas and rural areas;
Efficient ‘through’ lines running through central areas and
major public transport interchanges, that also connect major
origins and destinations outside the central locations;
Supporting soft measures such as fare structure, ticketing
systems, information and marketing, preferably combined
with restrictive policy measures towards car use that can
significantly influence public transport demand and the
success of all the other measures; and
Efficient arrangement of the network without overlapping
services to address the need for financial affordability of
operation.
1.2.2.2. Provision of a network of services involves planning and
operating bus services as a ‘unified network’, such that passengers
are practically able to travel anywhere on that network (easily
transferring between services as necessary). Successful European
15
HiTrans. 2005. Public transport – Planning the networks
16public transport operations demonstrate the benefits of network-
based approach to operating bus services. In Nantes in France for
example, passenger numbers are significantly higher than
comparable UK cities, despite the operating mileage of tram and bus
services being comparable to bus operations in UK cities16. Adoption
of these unified network principles will provide a basis for success
for bus-based public transport in Wales.
Annual per capita public transport in six continental Verkehrsverbünde and
equivalent parts of Wales (and comparators in England)
Public transport networks in the city-regions of Munich, Vienna and Zurich (which are
10-30 times bigger than the built-up areas of their main cities, and extend to
surrounding towns and villages), function as a single system. Buses, trams,
underground and suburban trains are coordinated by public transport governing
bodies or Verkehrsverbünde (VV) to provide ‘one network, one timetable, one ticket’.
Levels of public transport use in the VVs are strikingly higher (3-4 times the number
of trips) than in comparable areas of Wales and England, as shown in the graph
below17.
16
TAN. 2017. Available at: https://www.tan.fr/fr/bonjour-la-tan
17 Transport for Quality of Life. 2020. A Wales Transport Policy fit for the Climate Emergency
17Trips per head for public transport in Wales ranks as the
lowest in Europe
Benchmarking public transport use in Wales against other
countries in Europe reveals the poor relative performance. Wales
around 42 public transport trips per head in 2018, based on 101
million trips by bus18 and 31 million trips by rail19. This is lower
than the respective figures for all 29 European countries
referenced in ridership data20. Statistics specific to Wales are
hidden within the overall UK average of 118 trips per head per
year, which is distorted by the significantly higher number of trips
in London. Although, it must be recognised that comparison across
countries is necessarily inexact due to different profiles of each
country in respect of a range of factors which influence public
transport use, such as regulatory and governance arrangements,
population densities, demographics and economic characteristics.
1.2.2.3. It is important to note that a high usage of buses will necessarily
involve making it easy for passengers to transfer between service
lines. This aspect of normalising transfer as part of journeys is
(perhaps counterintuitively) a characteristic of a successful network
operation. Although direct journeys are the most attractive to
passengers, it is inevitable that the majority of origin-destination
pairs in a region or city are not reachable by a single direct trip, and
if made by public transport, would require at least one transfer.
Therefore, it is essential that passengers are able to conveniently
transfer between services to reach wider destinations.
1.2.2.4. A rule of thumb based on published information21 is that urban
areas with a successful public transport mode share have an
average of around 1.5 legs per journey – which would represent a
typical range as follows:
50% of journeys are direct (0.5 x 1 leg);
45% of journeys have 1 transfer (0.45 x 2 leg); and
5% of journeys have ≥2 transfers (0.05 x 3 leg).
1.2.2.5. The key aspect for people to adopt regular use of public
transport as a lifestyle choice is the practicality of making two and
three leg journeys – such that people who typically make direct local
18
Department for Transport. 2021. BUS0108: Passenger journeys on local bus services by region:
Great Britain, annual since 1970
19
Welsh Government. 2018. Statistical Bulletin: Rail transport, April 2017 to March 2018
20
UITP. 2018. European Countries Ridership Data
21
Lunke at al. 2021. Public transport competitiveness vs. the car: impact of relative journey time and
service attributes - This study identifies the average number of public transport transfers as 0.5 – with
38% of the trip segments with one transfer, while 52% were direct routes with no transfers.
18journeys can occasionally make longer indirect journeys.
1.2.2.6. It should be recognised that developing best practice networks
which are designed to be simple for the public to understand, is not
a simple process and involves an overall governance arrangement
that is capable of planning a complex ‘system’, comprising a number
of components (routes, timetables, ticketing, driver rostering, vehicle
type and capacity, vehicle logistics and maintenance, enforcement,
infrastructure, and information), all of which need to be synchronised
and co-ordinated to achieve successful passenger-facing outputs.
The complexity of public transport systems is therefore a key
challenge – and requires a systematic orchestration and governance
effort to achieve optimal operations.
1.2.3. The Need for Bus Planning and Monitoring
1.2.3.1. Successful implementation and operation of any major transport
scheme or system which addresses objectives of catering for
demand, financial efficiency, and wider environmental and economic
goals, requires detailed transport planning to be carried out by the
relevant transport authority. Typical activities include analysis of
travel demand, assignment modelling and capacity investigations, to
decide whether to, for example, improve existing roads and junctions
or build new infrastructure, or build new rail stations. It is apparent
that planning bus networks and systems on a long-term basis, in
terms of identifying problems, defining objectives, and generating
and evaluating alternatives, has, since bus deregulation in 1985, not
been a key feature of local authority Transport Plans in Wales
(which have tended to focus on infrastructure measures such as
stops, stations and bus priority measures). This gap in bus planning
is a logical outcome of the limited role of local authorities in the
deregulated bus system in respect of influencing and directing local
bus-based policy and network matters.
1.2.3.2. International examples of approaches to bus delivery, such as in
New Zealand’s Public Transport Operating Model (PTOM), involve
undertaking two distinct processes – of (a) Bus Planning; and (b)
Bus Procurement. Bus planning is undertaken by local government
and involves detailed transport planning to devise public transport
solutions guided by policies for sustainable travel and economic
objectives. This results in a network plan with routes, timetables, and
ticketing/fares arrangements.
1.2.3.3. Bus procurement, on the other hand, involves translating the
planned bus network into an operationalised service, which
generally involves contracting operation of all or some service lines
to bus operators, which would also include a method for
performance monitoring and payment.
19New Zealand Operating Model for Buses
The Public Transport Operating Model (PTOM) governs the way
regional councils plan public transport services and purchase them
from bus and ferry operators.
Under PTOM, regional councils are responsible for providing
public transport services. They make their own decisions about
how those services operate (including routes, timetables, fares,
ticketing etc).
Regional Councils develop regional public transport plans, and
then contract public transport operators to operate services.
1.2.3.4. Typical examples of successful regional and city public transport
systems (in terms of high patronage) have a regional transport
authority that is responsible for strategy and delivery of network
shape (in terms of routes and frequencies), ticketing systems
(including integration across all modes), and all information and
branding. Operators are contracted to provide defined services (in
terms of timetables and hours of operation) and are paid for delivery
of services with payments made according to performance indices
(including passenger growth). An example of long-term planning of
public transport network which has led to high mode share is in
Nantes.
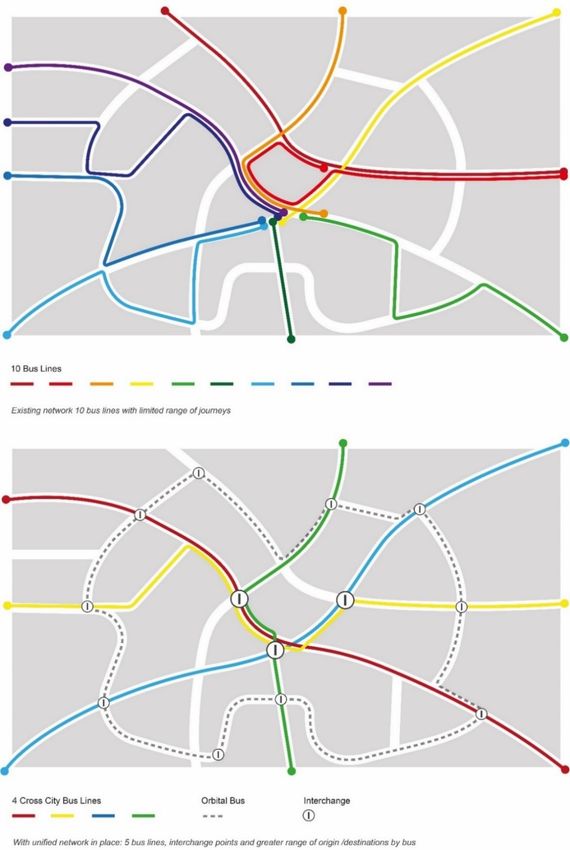
Long-term Network Planning in Nantes
The tram and bus network in Nantes has been subject to a long-
term plan22. The planning process has included:
Planning and implementation of three cross-city tram lines in
the 1980s/90s
Planning of a fourth cross-city line, in the 2000s, followed by
implementation as a bus rapid-transit (BRT)23 line (Line 4)
A long-term, plan for incremental implementation of cross-city
(Chronobus) services was developed, including bus priority
measures – which were implemented in 2012-14.
Opening of a further cross-city BRT service (Line 5).
22
Allen, H. 2013. Integrated Public Transport, Nantes, France
23
Bus rapid transit (BRT) is an approach to designing bus corridors to have better capacity and
reliability than a conventional bus system. Typically, as in the case of Nantes, a BRT system includes
lanes that are dedicated to buses and provides priority to buses at junctions where they interact with
other traffic. BRT systems also have design features to reduce delays caused by passengers
boarding/alighting services or paying fares. BRT aims to combine the capacity and speed of a fixed
route (e.g. light rail) with the flexibility, lower cost and simplicity of a bus system.
20The outcome of long-term planning and incremental
implementation has been a gradual increase in public transport
use in Nantes over the last 20 years.
Co-ordinating of networks of services in Mittelsachsen
The transport authority for Mittelsachsen24 region (in Germany)
has a key strategic priority to maximise the linkage and co-
ordination of modes of transport – including rail, tram, and bus
modes (see images of logos below). The authority is also
responsible for associated information and public communication.
The authority also manages introduction of complementary
mobility services such as car-sharing, car clubs, and demand
responsive buses.
In respect of linking modes of transport and transport, the authority
also focuses on the development of mobility points and station
infrastructure to improve the transfer experience.
1.2.3.5. The ability of transport authorities to manage the overall public
transport system is necessary to efficiently manage funding – by
allocation of vehicle resource across the network in an arrangement
which avoids unnecessary overlaps, ensures that there are
regulated headways between different services on the same
corridor, and allows some services to operate as feeders to core bus
or rail interchanges. This is not the case in Wales, where each area
typically has some overlap of services, uneven headways between
buses on the same corridors, and very few examples of operation of
feeder services to interchange points.
1.2.3.6. Networks which are planned and procured by public authorities
generally also undertake thorough monitoring and review to ensure
that progress is continually measured in respect of patronage
changes and passenger’s satisfaction, for example:
Monitoring performance of services based on an evidence-
based approach covering demand, service delivery and
customer feedback;
Undertaking periodic reviews to ensure that services
continue to reflect demand and customer expectations; and
24
Zweckverband Verkehrsverbund Mittelsachsen (ZVMS). 2021. Local Traffic Plan 4th Update.
21 Carrying out customer satisfaction surveys on a regular basis
and analyse complaints (this year vs last year comparisons).
1.2.3.7. It is concluded that planning, procurement and monitoring of bus
services is a key aspect of long-term success in attracting
passengers. Planning of services on a network basis also provides a
means to create operational and financial efficiencies. At present in
Wales, the fragmentation of responsibilities in the bus sector
effectively precludes comprehensive long-term planning of bus
networks, and severely inhibits the feasibility of implementing
comprehensive network-based initiatives.
1.2.4. Best Practice Success Factors
1.2.4.1. The operation of the bus-based public transport service in Wales
can be guided by a number of best practice success factors. These
success factors are primarily passenger-focused and contribute
towards achieving successful mode share and affordable operations:
Area-wide networks with all significant local destinations
reachable: A wide range of key destinations throughout a
local area should be reachable in say 45 mins on high
frequency bus services during the daytime (with transfers if
necessary), and at off-peak times (including evenings and
weekends) are reachable by good co-ordination of timings
for lower frequency services.
One ticket system: An exclusive ticket system for boarding
all buses should be in place, with ticket enforcement
automated (especially in urban areas) to allow for
passengers to board quickly. It is important to note that
operators’ having their own ticketing offers alongside a multi-
operator ticket is incompatible with the need for passengers
to have a single easy-to-understand-and-use ticketing
system.
Easy To Understand Network: A public transport network
that is inherently easy to understand and use is essential;
that is, passengers should be able to understand and
negotiate the network easily to reach different destinations. A
benchmark for best practice is that a network that can be
represented by a simple map, with each individual service
shown as an end-to-end line (including in central areas –
which in many current networks are unable to be shown
clearly on maps due to route complexity).
One Brand: A public transport brand should be present on
all vehicles, stops and stations, information sources, and
ticketing. This is important in creating a trusted brand which
gives passengers confidence to travel frequently and on an
ad-hoc basis. An example of this approach can be seen in
Dublin’s BusConnects initiative, in which the Transport for
22Ireland (TFI) logo is shown on the Leap card multi-modal
ticket, on bus stops, on the side of buses, and on information
media such as online maps and journey planners.
Easy and Reliable Transfer: High quality transfer conditions
and arrangements (ticketing, timetables, connection
guarantee) are needed to allow passengers to have
confidence in relying on transfer to other services to make
their journeys. There should be a unified timetable across all
bus services and other modes of public transport. Supporting
the concept of transfer in Germany includes providing
travellers with an alternative means of transport if their public
transport service is late and be reimbursed for the cost (e.g.
in Nord Rhein Westfalen, the ‘Connection Guarantee’ 25
typically applies when the local buses or trams are cancelled
or are at least 20 minutes behind schedule when leaving the
departure stop).
Reliable Travel Times: Journeys by public transport should
have reasonable and consistent speeds. The speed of travel
could be expressed as, for example a public transport/car
travel time ratio of less than 1.5 (e.g. 45 minutes by bus, 30
minutes by car), or a bus speed of say 15 km/hour on urban
routes.
Easy to Access the Vehicle: Public transport vehicles
should be easy to board by all passengers, including mobility
impaired passengers, with immediate entry without a need to
queue, and should allow people to easily carry baggage on
and off and within the vehicle. This relies on multiple doors
for buses operating on busy urban corridors – which is a
standard feature of bus operations in typical bus networks in,
for example, Germany26, France, and generally in urban
areas in Europe.
Accessible and Comfortable: Stations and stops should be
easy to reach, comfortable with good information, and
provide all passengers with easy boarding and alighting of
services. Vehicles should be comfortable, well equipped (Wi-
Fi, real time information, air conditioning etc) and low
crowding levels
Public Feedback and Customer Care: The general public
should be given regular opportunities to provide feedback
and participate in network evolution
25
VRS. 2021. Mobility Guarantee
26
Rhein-Main-Vekehrsbund (RMV). 2019. Minimum Standards for Buses in RMV - which states that
buses shall have at least two doors, including one double-wide door, and articulated buses shall have
three doors, including two double-wide doors.
23 Passenger Safety, Security, and Health: Passenger safety,
security and health should be inherent in all aspects of
people’s experience of public transport, including roadside
air quality and carbon emissions.
Network Efficiency and Financial Affordability: Although
this success factor is not directly customer-facing, it is
important that service lines are optimised to limit inefficient
overlap of services to maximise overall viability and financial
affordability. This ensures that best use is made of available
funding, and also addresses the need to make networks
understandable. Financial affordability over the long-term will
also be assisted by introduction of low emission technology
and propulsion systems which have lower fuel costs than
diesel-fuelled buses.
1.2.4.2. These success factors can be encapsulated in Welsh
Government’s aim set out in the Bws Cymru strategy as ‘One
Network, One Timetable, One Ticket’:
Easy to access – by extensive networks and welcoming
infrastructure and drivers;
Easy to use – through simple ticketing and sensible routes;
and
Easy to navigate – with fully integrated journeys and clear
information.
1.2.5. Public transport as a lifestyle choice
1.2.5.1. Data from countries with high public transport and sustainable
travel mode shares shows that people in cities with joined up
networks with single ticket travel are willing to adopt a ‘lifestyle
choice’ to use public transport for much of their weekly journeys.
This is dependent on destinations across their local area being
practically reachable by public transport – and hence is only
achievable with a ‘network’ approach to planning and operating of
services.
1.2.5.2. Travel data for Germany underlines the multi-modal lifestyle
nature of people’s travel behaviour. For example:
In medium-sized cities in rural areas of Germany27, 6% of
people are termed as ‘multiple mode users’ (who use car,
bicycle and public transport modes at least weekly),
compared to 4% who use public transport daily or weekly
(and other modes more rarely), along with 12% of people
using bicycles daily or weekly and all other modes more
rarely.
27
Federal Ministry of Transport and Digital Infrastructure. 2019. Mobility Trends in Germany
241.2.5.3. This car-free, multi-modal lifestyle confirms that high use of
cycling and public transport are mutually supportive - with travellers
relying on different sustainable modes according to their daily needs
(including weather impacts). Hence, increasing the rate of
sustainable travel in Wales will require co-ordinated investment and
governance of improvements to bus, rail and active travel. Costs and
funding for single-mode measures will need to consider mutual
interactions across sustainable modes. For example, success in
growing cycle use in an area may in the short-term result in some
abstraction from bus travel but in the long-term should help to
increase bus use. Hence, policy and planning for buses needs to
carefully consider the role of active travel and new mobility solutions
– such that investment in the range of sustainable modes are
planned within a co-ordinated governance and funding structure with
an aim to increase the proportion of sustainable travel, rather than
treating each mode as if their users are a discrete group of people.
1.3. Options to Address the Policy Problem
1.3.1. Option 1: Business as Usual
1.3.1.1. Business as usual is based on buses being operated as either
commercial services, with operators planning the networks and
receiving concessionary fare reimbursement and BSSG, or as non-
commercial services, set up through tendering by local authorities
with the operator typically taking all fare income i.e. as a net cost
contract.
1.3.1.2. Under this option, Welsh Government would be required to
maintain a high level of poorly directed subsidy as it has done
throughout the period of COVID lockdown, continuing over an
unknown but possibly extended period since bus use is, at best,
likely to continue below pre-COVID levels for some time. In fact, bus
patronage would quite possibly show a long-term depression due to
permanently increased working from home until there is significant
investment to attract more patronage through better service
provision. Given that Welsh Government has an ambition to invest in
sustainable transport to meet mode shift and carbon targets, the
significant additional subsidy required in a business-as-usual
scenario is not considered good value for money.
1.3.2. Option 2: Statutory Partnerships
1.3.2.1. A partnership is an agreement between a local authority and
local bus operators to work together to improve local bus services.
Putting in place a statutory obligation to implement partnerships
across Wales in order to continue to be eligible for bus operating
revenue support would represent an incremental approach,
encouraging more cooperative approaches between local authorities
25You can also read