Appendix D VMT Analysis - California State University ...
←
→
Page content transcription
If your browser does not render page correctly, please read the page content below
Appendix D VMT Analysis
This Page Intentionally Left Blank
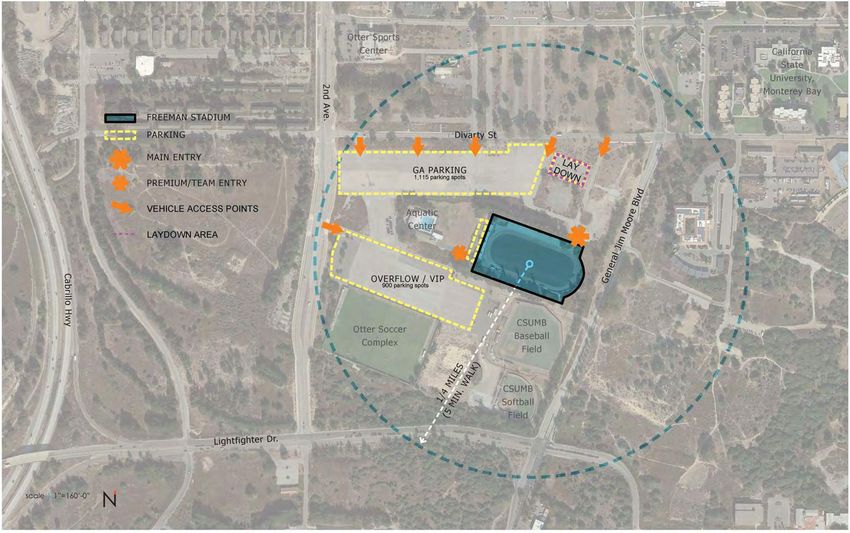
Memorandum
Date: July 6, 2021

To: Erin Harwayne, Denise Duffy & Associates

From: Daniel Rubins, Elynor Zhou, and Jason Pack, Fehr & Peers

Subject: Vehicle Miles Traveled Impact Analysis for the Monterey Bay Football Club
 Facilities Renovation Project at California State University, Monterey Bay in
 Seaside, California

 SJ21-2085

This memorandum summarizes a vehicle miles traveled (VMT) impact analysis for the Monterey
Bay Football Club Facilities Renovation Project at California State University, Monterey Bay
(CSUMB) Freeman Stadium Refurbishing in Seaside, California. As discussed below, the VMT
analysis presented in this memorandum considers both the Project’s direct VMT, as well as a
cumulative analysis, which considers the Project’s long-term effect on VMT.

Project Description
The Monterey Bay Football Club (MBFC) is proposing to renovate, utilize, and maintain the
existing Freeman Stadium and Field House at CSUMB as a United Soccer League (USL) facility
under a 30-year facilities agreement with the University (see Figures 1 to 3 of the Project
Description for the MBFC facilities Renovation Project at California State University Monterey Bay).
MBFC’s sole purpose is to bring sports entertainment (soccer) to the Monterey Bay area. The
proposed project would support CSUMB's educational efforts, including the overall success and
well-being of CSUMB's student athletes. In addition, the partnership would support the mutual
goal of the MBFC and campus to partner with communities across the greater Central Coast
region in providing education, access and opportunities for underserved youth through campus,
clinics, scholarships, and academic and wellness programming.

Project Site Access and Parking
It is assumed that construction and event operation site access would be accessed via the Second
Avenue entryway at the west end of the property. Parking would be available on-site for

 160 W. Santa Clara Street | Suite 675 | San José, CA 95113 | (408) 278-1700 | Fax (408) 278-1717
 www.fehrandpeers.com
Erin Harwayne
July 6, 2021
Page 2 of 28

construction and operation, and no construction of new temporary or permanent access roads
would be required. The proposed project would utilize the three existing, adjacent parking areas
for event use only.

General admissions parking would utilize an existing lot to the northwest of the site.
Overflow/VIP parking would utilize an existing lot to the southwest of the site. Parking for teams,
buses, event staff, and facility staff would be in the existing lot west of the field house.

The proposed project would utilize existing adjacent campus hardscape for 2,232 parking spaces
(2,200 standard and 32 accessible spaces). CSUMB standard double capacity short-term bike racks
(LEED compliant) would be provided for bike parking spaces for a venue of this size. The site will
also designate parking space for e-scooter parking alongside bicycle parking areas. CSUMB Main
Campus permits will not be valid in event parking lots. To accommodate other means of
transportation by event attendees, bike parking/e-scooter parking would be provided. An existing
public transit line runs along Divarty Street and would also be utilized for stadium access.

MBFC Operations
The proposed stadium renovation would provide for the following operational activities:

 • Hosting the USL team MBFC

 ◦ Approximately 20 full-time MBFC staff using the Field House from 9:00 am-5:00 pm,
 Monday-Friday as office and training preparation space.
 ◦ Approximately 10 months of training (practice) in the Field House and on the
 adjacent existing soccer fields, 4-5 days per week for 3-4 hours each day, with an
 estimated 32 players, coaches, and staff at each practice.
 ◦ Approximately 18 home matches per year, on Friday nights from 7:00 pm-11:00 pm
 and/or Saturdays during the day or in the early evening, with an estimated 210 part-
 time match-related personnel (i.e., ticket takers, concessions, security, parking, ushers,
 media, etc.), home team (32 staff, coaches, and players), visiting team (32 staff,
 coaches, and players), and 6,000 ticketed spectator capacity.

 • MBFC related camps and off-season activities (approximately six activities per year).
 • Continued campus use with shared use of the Field House.
 • New use of renovated playing field for academic courses and athletics programs when
 not in conflict with the MBFC schedule.
 • Campus-sponsored or invited community events, such as Spring Commencement,
 concerts, or other events.
Erin Harwayne
July 6, 2021
Page 3 of 28

The stadium would be shared between the MBFC and CSUMB. Advanced scheduling during the
MBFC season (February – November) and special events would be determined in advance by
CSUMB to accommodate MBCS games.

MBFC staff and professional players and CSUMB faculty, staff, and students would regularly use
the Field House as the MBFC schedule permits. During the 300-day MBFC season (pre-season +
season + playoffs), the existing Field House would be in regular use by approximately 20 MBFC
staff members working from 9:00 am-5:00 pm, Monday through Friday.

MBFC practices would be held at the adjacent existing soccer fields 4-5 days per week for
approximately 3-4 hours/day, beginning around 10:00 am with an estimated 32 players, coaches,
and staff at each practice.

MBFC would host approximately 18 home games per year (17 regular games and 1 playoff game).
The games would be typically scheduled on Friday nights from 7:00 pm-11:00 pm and/or
Saturdays during the day or in the early evening, with an estimated 210 part-time match-related
personnel (i.e., ticket takers, concessions, security, parking, ushers, media, etc.), full-time home
team personnel (32 staff, coaches, and players), full-time visiting team personnel (32 staff,
coaches, and players), and 6,000 ticketed spectator capacity (the full-time front office staff would
be included in the spectator count). Ticketed capacity for spectator would be 6,000 tickets.
Average league attendance on non-playoff games is estimated to be 3,860 attendees (69 percent
of its 6,000-spectator capacity).

CSUMB Operations
CSUMB estimates 10 campus-coordinated events, ranging from Commencement to Convocation
(considered a smaller event size) and concerts/community events (considered a larger event size).
These events are outlined as follows (* - Indicates this is an existing campus activity):

 • Four (4) Commencement Ceremonies*

 ◦ Fall Commencement*

 ▪ One event in December, ~1,850 = 250 Students + 100 Faculty/Staff + 1,500
 family attendees (6 family tickets per student)

 ◦ Spring Commencement*

 ▪ Three events in May, ~6,000 each (averaging across events) = 800 Students + 150
 Faculty/Staff + 4,800 family attendees + 150 Community Guests
Erin Harwayne
July 6, 2021
Page 4 of 28

 • Six (6) other events over the course of the Academic Calendar

 ◦ Convocation*

 ▪ One event in September, ~1,000 = 990 students + 10 staff/faculty
 ▪ One event in May, ~800 = 500 students + 300 staff/faculty.

 ◦ Homecoming Event*

 ▪ One event in October, ~2,000 = 1,450 students + 50 staff/faculty + 500
 community guests

 ◦ Spring Concert*

 ▪ One event in April, ~1,000 = 650 students + 350 community guests (*only
 allowed with student host)

 ◦ Affinity Celebration*

 ▪ One event in May, ~1,500 = ~300 students + 50 Faculty/Staff + 1,600 family
 attendees

 ◦ Campus + Community Event

 ▪ One event in Fall (just to balance out calendar), ~9,000 = 2,000 students + 500
 staff/faculty + 6,500 community guests

In addition to the ten campus coordinated events listed above, there are 30 low-attendance
CSUMB Athletics games. These events are outlined as follows (* - Indicates this is an existing
campus activity):

 • 20 Season Games plus 10 potential Post-Season Games*

 ◦ All CSUMB Soccer Games in the Stadium (practice on adjacent existing fields)

 ▪ Men’s Soccer: 8-10 home games (5-6 CCAA games)
 ▪ 60 Players and Coaches plus 150 spectators, per game

 ◦ Women’s Soccer: 8-10 home games (5-6 CCAA games)*
 ◦ NCAA Regional Weekend*

 ▪ Four (4) games, two per gender, teams must qualify
 ▪ 60 Players and Coaches plus 150 spectators, per game
Erin Harwayne
July 6, 2021
Page 5 of 28

 ◦ CCAA Soccer Championship (once every 3-4 years at most)*

 ▪ Six (6) games: four top teams for each gender (two semi-games plus one final per
 gender)
 ▪ 60 Players and Coaches plus 300 spectators, per game

Approach and Overview of
Methods
How transportation impacts under the California Environmental Quality Act (CEQA) are analyzed
was changed with Senate Bill (SB) 743. SB 743 removed the use of automobile delay or traffic
congestion for determining transportation impacts in environmental review. Instead, the latest
CEQA Statute & Guidelines now specify that vehicle miles traveled, or VMT, is the appropriate
metric to evaluate transportation impacts. In short, SB 743 changes the focus of transportation
impact analysis in CEQA from measuring impacts to drivers, to measuring the impact of driving. In
response to this methodological change in required transportation analysis, the California State
University (CSU) Office of the Chancellor prepared the 2019 California State University
Transportation Impact Study Manual (CSU TISM), which supersedes the 2012 CSU TISM. The 2019
CSU TISM provides guidance for the preparation of CEQA-compliant transportation impact
analysis pursuant to SB 743 and is the operative TISM for the analysis presented here including
the VMT threshold metrics. The 2019 CSU TISM was prepared by CEQA practitioners with a focus
on legal adequacy regarding CEQA compliance based on past court decisions.

Approach
The MBFC and CSUMB special event activities were evaluated for potential direct, indirect, and
cumulative environmental impacts assuming maximum ticketed spectator capacity (6,000
spectators). This VMT analysis estimates the new vehicle miles generated by the special events
and the new full-time equivalent employees. Specifically, this impact analysis converts the MBFC
and CSUMB special event activities to VMT by calculating the following:

 • Total Annual Person Trips
 • Total Annual Vehicle Trips
 • Annual Project Generated VMT
 • Daily Project Generated VMT
 • Service Population
 • Daily Project Generated VMT per Service Population

To determine weather the project has a direct impact on the environment, the Project generated
VMT per service population is compared to the Project generated VMT per service population
Erin Harwayne
July 6, 2021
Page 6 of 28

threshold under Existing Conditions (this threshold is defined as 15 percent below Monterey
County’s Project generated VMT threshold under Existing Conditions). The indirect and
cumulative impacts of the project are evaluated under Cumulative Conditions using the boundary
VMT per service population (this is the vehicle travel on Monterey County roads divided by the
service population of Monterey County).

A site-specific Transportation Management Plan (TMP) with a TDM Program will be prepared prior
to opening day to manage spectator traffic and monitor performance standards during MBFC and
CSUMB special event activities. The Freeman Stadium TMP with TDM Program will be a mitigation
measure to address the direct VMT impact of the project.

Overview of Methods
The CSUMB 2020 Master Plan VMT assessment was CSUMB’s first evaluation using VMT. As a part
of that process the following steps were taken to establish SB 743 VMT thresholds:

 • Select a VMT calculation tool

 ◦ Use the Association of Monterey Bay Area Governments (AMBAG) regional travel
 forecasting model.

 • Select the VMT accounting method(s)

 ◦ Project generated VMT per service population (Direct Impacts): The sum of the “VMT
 from” and “VMT to” and within Monterey County under baseline conditions divided
 by the sum of the number of residents, employees, and students in the county.
 ◦ Project’s effect on VMT per service population (Cumulative Impacts): An evaluation of
 the change in travel between without and with project conditions on all roadways
 within Monterey County under the Cumulative Conditions scenario, divided by the
 sum of the number of residents, employees, and students in the county.

 • Calculate the baseline and cumulative regional VMT estimates

 ◦ The analysis presented here uses VMT from all trip purposes and vehicle types (i.e.,
 there is not separation of VMT by land use) for Monterey County with a baseline set
 as Existing Conditions VMT generated by Monterey County and cumulative set as
 VMT on all roadways in Monterey County under Cumulative without Project
 Conditions (see the Project Generated VMT per Service Population Estimation
 Method and Project’s Effect on VMT Estimation Method (Using Boundary VMT)
 sections for detailed descriptions.)
Erin Harwayne
July 6, 2021
Page 7 of 28

 • Set a VMT threshold(s)

 ◦ The threshold applied to Project generated VMT is 15 percent below the Existing
 Conditions for Monterey County. 1
 ◦ The threshold applied to project’s effects on VMT threshold is no change from
 Cumulative Conditions to Cumulative with Project Conditions in the boundary VMT
 per service population.

As to direct impacts, Project generated VMT per service population is the metric used to evaluate
how the project VMT changes (increases or decreases) between the without Project and with
Project scenarios, considering both VMT increases due to growth and VMT reductions due to
changes in travel behavior. Project generated VMT per service population is used to evaluate if
the VMT rate due to the Project (i.e., the direct impacts) is greater than a specified VMT threshold;
however, it does not evaluate a Project’s effect on VMT on the entire roadway system, 2 which is
evaluated as part of the cumulative analysis. 3

Regarding the cumulative analysis, the MBFC and CSUMB special event activities are a relatively
small portion of the Monterey County travel; therefore, it is to be expected that the Project’s
effect on VMT (cumulative impact) would have predominately localized VMT effects. Therefore,
the Project’s effect on VMT, as evaluated by the cumulative effects of the Project’s land use and
transportation changes, compares the changes in boundary VMT per service population between
the Cumulative Conditions and Cumulative with Project and without Eastside Parkway Conditions.

The analysis presented in this memorandum focuses on the VMT for all trip purposes and vehicle
types (i.e., there is no separation of VMT by land use). The Project generated VMT threshold was
developed using the Existing Conditions VMT for Monterey County because most of the MBFC
spectators (more than 90 percent) and CSUMB campus population (nearly 90 percent of students,
faculty, and staff) lives within Monterey County. Similarly, most of the Project generated VMT
would be within Monterey County and, therefore, impacts assessed against the Monterey County
baseline is the most appropriate assessment of a project’s direct impact. Like the Project
generated VMT baseline, the boundary VMT baseline measures the Project’s effect on the

1 The CSU has selected the 15 percent reduction relative to Monterey County based on the OPR Technical
 Advisory, which states “…OPR recommends that a per capita or per employee VMT that is fifteen percent
 below that of existing development may be a reasonable threshold.” (Quote from page 10 of the Technical
 Advisory on Evaluating Transportation Impacts in CEQA, December 2018).
2 An often-cited example of how a project can affect VMT is the addition of a grocery store in a food desert.

 Residents of a neighborhood without a grocery store have to travel a great distance to an existing grocery
 store. Adding the grocery store to that neighborhood will shorten many of the grocery shopping trips and
 reduce the VMT to/from the neighborhood. This concept is likely to occur with the addition of campus
 housing.
3 For this analysis, service population is defined as the sum of all employees, residents, and students

 (Kindergarten through University).
Erin Harwayne
July 6, 2021
Page 8 of 28

Monterey County boundary VMT because Project effects are likely to be localized – that is,
occurring near the CSUMB campus and within Monterey County.

Project Generated VMT per Service Population Estimation Method

The Project generated VMT is the VMT from all vehicle trips for all trip purposes and types. It is
calculated by summing the “VMT from” and “VMT to” a specified area, as follows:

 = ( + ) + ( + ) = 2 ∗ + +

 • Internal-internal (II): The full length of all trips made entirely within the geographic area
 limits.
 • Internal-external (IX): The full length of all trips with an origin within the geographic area
 and destination outside of the area.
 • External-internal (XI): The full length of all trips with an origin outside of the geographic
 area and destination within the area.

The intra-zonal VMT and VMT between traffic analysis zones, or TAZs, that are in the study area
causes some double counting, which is an expected result when summing the trip end based
VMT. To ensure a VMT rate is expressed properly (i.e., that the numerator and denominator
include the generators of both trip ends of the VMT), the Project generated VMT is divided by the
service population (residential population, employment population, plus student population), the
generators of both trip ends of the VMT. The VMT estimates are also presented on a per service
population basis to account for both the effects of population and/or employment growth and
the effects of changes in personal travel behavior. For example, population growth may cause an
increase in VMT, while travelers changing their behavior by using different travel modes or
decreasing their vehicle trip lengths (such as a higher percentage of students living campus)
would cause decreases in VMT.

Project’s Effect on VMT Estimation Method (Using Boundary VMT)

As noted earlier, the Project’s effect on VMT, or cumulative impact, is evaluated using the
boundary VMT, which captures all VMT on the roadway network within a specified geographic
area, including local trips plus interregional travel that does not have an origin or destination
within the area. The geographical boundary method only considers traffic within the physical
limits of the selected study area and does not include the impact of vehicles once they travel
outside the area limits. The use of boundary VMT is a more comprehensive evaluation of the
potential effects of the Project because it captures the combined effect of new VMT, shifting
existing VMT to/from other neighborhoods, and/or shifts in existing traffic to alternate travel
routes or modes. The boundary VMT is also divided by the service population (sum of residents,
employees, and students) to account for the effects of population and/or employment growth
and the effects of changes in personal travel behavior within the specified geographic area.
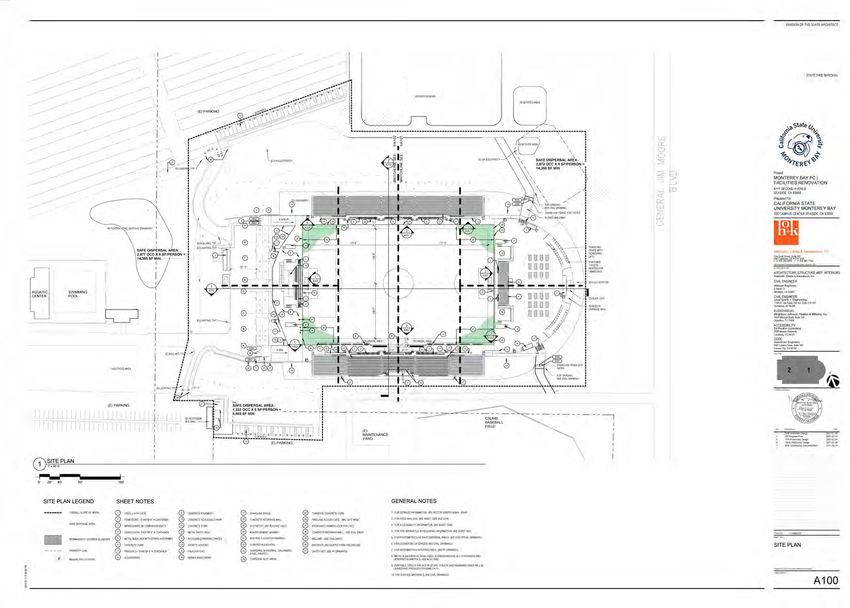
Erin Harwayne
July 6, 2021
Page 9 of 28

Figure 1 presents a representation of both Project generated VMT and boundary VMT for
Monterey County. Both metrics are needed for a comprehensive evaluation of a project’s VMT
effects.

Service Population

The MBFC will generate new employment including front-office employees (20 front office,
stadium operations, marketing, partnerships, and ticketing staff), team personnel (32 staff,
coaches, and players for the home team and 32 staff, coaches, and players for the visiting team),
and 210 part-time match staff (16 full-time equivalents). Some of that new employment will be
full-time while some employment will be part-time. To be consistent with the AMBAG travel
model employment inputs, the part-time employment was converted to full-time employment.
Match spectators are not included as an independent variable in the AMBAG travel model
equations and therefore are not included in the service population.

The 210 part-time match staff will work 4 to 16 hours for each match based on information from
the MBFC front office staff. The MBFC staff has estimated that these part-time match staff will
work approximately 34,128 annual hours of work per year. A full-time job is 2,080 hours per year,
which would translate into 16 full-time equivalent employee jobs.

The service population for this project is 100 employees (20 front-office staff, 32 home team
personnel, 32 visitor team personnel, and 16 full-time equivalents for the part-time match staff).
Project Generated VMT Legend: Project Effect on VMT Legend:
 = Monterey County Boundary (Boundary VMT) = Monterey County Boundary
 £
 [
 101 1 = 2 x Internal to Internal (2 x II) VMT £
 [
 101 1 = Internal to Internal (II) VMT
 2 = External to Internal (XI) VMT 2 = External to Internal (XI) VMT
 3 = Internal to External (IX) VMT 3 = Internal to External (IX) VMT
 4 = External to External (XX) VMT

 2 2

 ·
 183
 ·
 183

 ·
 68 ·
 68
\\Fpsj03.fpainc.local\Data\Projects\_SJ17_Projects\SJ17_1728_CSUMB_Master_Plan_EIR\Graphics\GIS\MXD\SJ17_1728_VMT_Basemap.mxd

 \\Fpsj03.fpainc.local\Data\Projects\_SJ17_Projects\SJ17_1728_CSUMB_Master_Plan_EIR\Graphics\GIS\MXD\SJ17_1728_VMT_Basemap.mxd
 1 1

 £
 [
 101 £
 [
 101

 ·
 146
 ·
 146

 4

 ·
 198
 ·
 198

 £
 [
 101 £
 [
 101
 ·1 ·1

 3 3

 Notes: External to External (XX) trips are excluded from this VMT metric. Adjustments to project Notes: Boundary VMT is all the VMT within Monterey County. Transparent portions of arrows 2, 3 and 4
 generated VMT made to include the full length of trips that leave Monterey County to are not included in the VMT metric.
 capture inter-regional travel.
 Monterey County Boundary Monterey County Boundary

 Figure 1 FigureFigure
 1 1
 Title Title
 Measuring Vehicle Miles Traveled (VMT)
 N:\Projects\_SJ21_Projects\SJ21_2085_CSUMB_MB_Football_Club\Graphics\ADOBE\SJ21_2085_Fig_1_MC_VMT.ai
Erin Harwayne
July 6, 2021
Page 11 of 28

VMT Thresholds
The VMT impact analysis presented in this report considers the Project’s direct impacts relative to
Project generated VMT per service population, as well the Project’s long-term effect on VMT
using boundary VMT per service population evaluated under Cumulative Conditions.

Project Generated VMT Impact Thresholds and Impact Criteria
The regionwide threshold for Project generated VMT applied in the analysis presented here is 15
percent below the Existing Conditions VMT per service population for Monterey County. The OPR
Technical Advisory suggests a similar threshold for residential and office land uses (i.e., 15 percent
below VMT in a geographic area). The CSU has selected the 15 percent reduction relative to
Monterey County based on the OPR Technical Advisory and the fact that most of the students,
faculty, and staff live within Monterey County, and similarly most of the MBFC spectators live in
Monterey County. As a result, most of the MBFC and CSUMB special event activity Project
generated VMT would be within Monterey County and, therefore, impacts assessed against the
Monterey County baseline is the most appropriate assessment of a project’s direct impact. Thus,
the threshold applied in this analysis is 15% below the existing VMT of 28.12, which as shown in
Table 1, is the existing VMT per service population of Monterey County, or 23.91 (Monterey
County VMT per Service Population of 28.12 x 85% = 23.91).

Table 1: Project Generated VMT Threshold
Item Monterey County
Project Generated Vehicle Miles Traveled (A)1 19,158,300
Service Population (B)1,2 681,200
Project Generated VMT per Service Population (A/B = C) 28.12
Project Generated VMT per Service Population Threshold (C*85% = D) 23.91
Notes:
1. Rounded service population and VMT to nearest 100.
2. Service population is defined as the sum of all employees, residents, and students (Kindergarten through University).
Source: Fehr & Peers, 2021.

Therefore, the Project would cause a significant Project generated VMT impact if:

 • The Project generated VMT per service population for the CSUMB campus under Existing
 with Project Conditions is greater than 23.91.
Erin Harwayne
July 6, 2021
Page 12 of 28

Project’s Effect on VMT Thresholds and Impact Criteria
The impact threshold for the Project’s effect on VMT, or the project’s cumulative impact, is the
Monterey County Boundary VMT per Service Population, or 14.07 (see Table 2 for illustration of
how the 14.07 is calculated). Like the Project generated VMT baseline, the boundary VMT baseline
uses the Monterey County boundary VMT to evaluate the project’s effects on VMT because the
project effects are likely to be localized near the CSUMB campus and within Monterey County.

Table 2: Project’s Effect on VMT (Boundary VMT) Cumulative Threshold
Item Monterey County
Boundary Vehicle Miles Traveled (A)1 11,268,400
Service Population (B)1,2 800,900
Boundary VMT per Service Population (A/B = C) 14.07
Boundary VMT per Service Population Threshold (C) 14.07
Notes:
1. Rounded service population and VMT to nearest 100.
2. Service population is defined as the sum of all employees, residents, and students (Kindergarten through University).
Source: Fehr & Peers, 2021.

Therefore, the Project’s effect on VMT would be significant if:

 • The Project causes the cumulative countywide daily boundary VMT per service population
 to increase above 14.07.
Erin Harwayne
July 6, 2021
Page 13 of 28

VMT Estimates
The following special event activities are converted to vehicle trips and VMT. This is done by
estimating the total annual person trips, total annual vehicle trips, total annual project generated
VMT, and daily Project generated VMT. 4

 • Monterey Bay Football Club

 ◦ Front Office Activities: Approximately 20 full-time MBFC staff using the Field House
 from 9:00 am-5:00 pm, Monday-Friday as office and training preparation space
 (included as spectators during matches).
 ◦ Team Practices: Approximately 10 months of training (practice) in the Field House and
 on the adjacent existing soccer fields, 4-5 days per week for 3-4 hours each day, with
 an estimated 32 players, coaches, and staff at each practice.
 ◦ Match Staff and Players: Approximately 18 home matches per year, on Friday nights
 from 7:00 pm-11:00 pm and/or Saturdays during the day or in the early evening, with
 an estimated 210 part-time match-related personnel (i.e., ticket takers, concessions,
 security, parking, ushers, media, etc.), home team (32 staff, coaches, and players),
 visiting team (32 staff, coaches, and players). The visiting team members are assumed
 to travel from the San Jose Airport in several small vans.
 ◦ Match Spectators: Approximately 18 home matches per year, on Friday nights from
 7:00 pm-11:00 pm and/or Saturdays during the day or in the early evening, with 6,000
 ticketed spectator capacity. The MBFC estimates the following distribution of match
 spectator locations:

 ▪ 8% CSUMB Students
 ▪ 55% Monterey Peninsula (e.g., Monterey, Seaside, Marina, Pacific Grove,
 Pebble Beach, and Carmel)
 ▪ 30% Salinas Valley (e.g., Salinas, Gonzales, Soledad, Greenfield, and King City)
 ▪ 3% Watsonville, Castroville, and Gilroy
 ▪ 1% Santa Cruz
 ▪ 3% Other (used San Jose as center point)

4 These VMT estimates do not take into consideration some foreseeable travel changes including increased
 use of Transportation Network Companies (TNCs) (e.g., Uber and Lyft), nor the potential for autonomous
 vehicles. Although the technology for autonomous vehicles is expected to be available over the planning
 horizon, the federal and state legal and policy frameworks are uncertain. Initial modeling of an
 autonomous future indicates that with automated and connected vehicles, the capacity of the existing
 transportation system would increase as vehicles can travel closer together; however, these efficiencies are
 only realized when a high percentage of vehicles on the roadway are automated and connected. There is
 also the potential for vehicle travel to increase with zero-occupancy vehicles on the roadway.
Erin Harwayne
July 6, 2021
Page 14 of 28

 ◦ Camps and Off-Season Activities: Approximately six activities per year with 50 to 100
 attendees plus a parent, and staff. This analysis assumes 100 people total participate
 in these events.
 ◦ Other Services: For each of the 18 matches there will be 5 food and team store
 vendor staff (this is in addition to the staff working the event). The portable restrooms
 will be emptied after each of the 18 matches.

 • CSUMB Events

 ◦ Joint Campus and Community Event: One event in Fall with approximately 9,000
 participants = 2,000 students + 500 staff/faculty + 6,500 community guests.

The special event activity is converted to daily vehicle traffic estimates using the following
equations:

 • Total Annual Person Trips (Table 3 shows the estimates):

 ◦ A persons * B days per week * C weeks or events per year * 2 daily person trips = D
 total annual person trips

 ▪ The persons, days per week and weeks or events per year are from the MBFC or
 CSUMB campus staff. For each match, approximately 10 percent of employees
 will travel for two days, which equates to 1.1 days per match.
 ▪ The person trips are multiplied by two to create a round trip to and from the
 stadium.

 • Total Annual Vehicle Trips (Table 4 shows the estimates):

 ◦ (D total annual person trips * E vehicle mode share) / F persons per vehicle = G total
 annual vehicle trips

 ▪ The MBFC employees (e.g., front office, coaches, players, team staff, and match
 staff) mode share is assumed to be the same as the Monterey County average
 from the California Household Travel Survey. The vehicle mode share for non-
 CSUMB student spectators of 77 percent (an expression of the drive-alone,
 carpool and rideshare mode share) was provided by MBFC. While the vehicle
 mode share for CSUMB student spectators of 58 percent is based on the CSUMB
 Person Trip Travel Survey administered in 2017. Finally, the visiting team and
 other services were assumed to only travel by vehicle.
 ▪ Spectators arriving in a carpool or a rideshare/transportation network company
 (Lyft, Uber, etc.) vehicle are treated the same for vehicle trips. A rideshares
 deadheading is not included in the vehicle trips or VMT.
Erin Harwayne
July 6, 2021
Page 15 of 28

 ▪ The vehicle occupancy for the MBFC employees traveling by a vehicle (drive-
 alone plus carpool) is assumed to be 1.1 persons per vehicle, and 2.23 persons
 per vehicle for match day spectators based on observed data at Sacramento
 Republic Football Club (a USL Championship team established in 2012) soccer
 matches as summarized in the transportation section of the Sacramento Railyards
 Specific Plan Update (June 2016).

 • Annual Project Generated VMT (Table 5 shows the estimates):

 ◦ G total annual vehicles trips * H average trip length = I Annual Project Generated
 VMT

 ▪ The front office activities, team practices and match staff and players are assumed
 to travel the Monterey County average commute distance (11.8 miles) (2012
 California Household Travel Survey).
 ▪ The match spectators are assumed to travel from Monterey County, Santa Cruz
 County, and Santa Clara County. The distribution is based on a MBFC summary of
 season ticket deposit information. The vehicle distance was measured between
 the stadium and each city listed. The distance used for a group of cities is
 weighted based on the resident population.
 ▪ The Campus and off-season activities are based on the same average distance of
 approximately 16 miles as the match spectators.
 ▪ The other services average distance is based on average trip distance to
 Monterey Peninsula.

 • Daily Project Generated VMT (Table 6 shows the estimates):

 ◦ I Annual Project Generated VMT / J days of operation = K Project generated VMT

 ▪ The Project generated VMT per day is estimated by dividing the total annual VMT
 by 365 days.
Erin Harwayne
July 6, 2021
Page 16 of 28

Table 3: Total Annual Person Trips
 Total
 Annual
 Number of Days per Weeks or Person
 Activity
 People (A) Week (B) Events (C) Trips
 (A*B*C)*2=
 D)
MBFC Operations
Front Office Activities 20 5 52 10,400
Team Practices 32 5 40 12,800
Match Staff and Players – Home Team and Staff 242 1.1 18 9,583
Match Staff and Players – Visiting Team 32 1 18 1,152
Match Spectators – CSUMB Students 480 1 18 17,280
Match Spectators – Monterey Peninsula 3,300 1 18 118,800
Match Spectators – Salinas Valley 1,800 1 18 64,800
Match Spectators – Watsonville/Castroville/Gilroy 180 1 18 6,480
Match Spectators – Santa Cruz 60 1 18 2,160
Match Spectators – Other 180 1 18 6,480
Camps & Off-Season Activities 100 1 6 1,200
Other Services 6 1 18 216
 Subtotal (a) 6,432 251,351
CSUMB Operations
Campus & Community Event - Students 2,000 1 1 4,000
Campus & Community Event – Faculty & Staff 500 1 1 1,000
Campus & Community Event – Guests 6,500 1 1 13,000
 Subtotal (b) 9,000 18,000
 Total (a+b=c) 15,432 269,351
Source: Fehr & Peers, 2021.
Erin Harwayne
July 6, 2021
Page 17 of 28

Table 4: Total Annual Vehicle Trips
 Total
 Total
 Annual
 Annual Vehicle Persons per
 Activity Vehicle
 Person Mode (E) Vehicle (F)
 Trips (D*
 Trips (D)
 E)/F=G)
MBFC Operations
Front Office Activities 10,400 93% 1.1 8,831
Team Practices 12,800 93% 1.1 10,868
Match Staff and Players – Home Team 9,583 93% 1.1 8,137
Match Staff and Players – Visiting Team 1,152 100% 8 144
Match Spectators – CSUMB Students 17,280 58% 2.23 4,481
Match Spectators – Monterey Peninsula 118,800 77% 2.23 41,021
Match Spectators – Salinas Valley 64,800 77% 2.23 22,375
Match Spectators – Watsonville/Castroville/Gilroy 6,480 77% 2.23 2,237
Match Spectators – Santa Cruz 2,160 77% 2.23 746
Match Spectators – Other 6,480 77% 2.23 2,237
Camps & Off-Season Activities 1,200 75% 2.23 405
Other Services 216 100% 1 216
 Subtotal (d) 251,351 101,698
CSUMB Operations
Campus & Community Event – Students 4,000 58% 2.23 1,037
Campus & Community Event – Faculty & Staff 1,000 93% 1.1 849
Campus & Community Event – Guests 13,000 77% 2.23 4,489
 Subtotal (e) 18,000 6,375
 Total (d+e=f) 269,351 108,073
Note: Underlined text indicates supporting performance standard to be monitored in Transportation Management Plan.
Source: Fehr & Peers, 2021.
Erin Harwayne
July 6, 2021
Page 18 of 28

Table 5: Annual Project Generated VMT

 Total Annual Average
 Total Annual
 Activity Vehicle Trips Vehicle Trips
 VMT (G*H=I)
 (G) (H)

MBFC Operations
Front Office Activities 8,831 11.84 104,579
Team Practices 10,868 11.84 128,702
Match Staff and Players – Home Team 8,137 11.84 96,360
Match Staff and Players – Visiting Team 144 69.30 9,979
Match Spectators – CSUMB Students 4,481 18.91 84,736
Match Spectators – Monterey Peninsula 41,021 8.26 338,833
Match Spectators – Salinas Valley 22,375 23.19 518,876
Match Spectators – Watsonville/Castroville/Gilroy 2,237 27.24 60,936
Match Spectators – Santa Cruz 746 38.00 28,348
Match Spectators – Other 2,237 67.00 149,879
Camps & Off-Season Activities 405 Varies1 6,515
Other Services 216 8.262 1,784
 Subtotal (g) 101,698 1,529,527
CSUMB Operations
Campus & Community Event – Students 1,037 Varies3 19,610
Campus & Community Event – Faculty & Staff 849 11.84 10,054
Campus & Community Event – Guests 4,489 Varies1 71,741
 Subtotal (h) 6,375 101,405
 Total (g+h=i) 108,073 1,630,932
Note:
Underlined text indicates supporting performance standard to be monitored in Transportation Management Plan.
1. Assume attendee location distribution is like match spectator location distribution, use same vehicle trip lengths and
distribution as the match spectators. The average distance is approximately 16 vehicle miles.
2. Used average distance between the stadium and Monterey Peninsula.
3. Assume attendee location distribution is like CSUMB student match spectator. The average distance is approximately 19
vehicle miles.
Source: Fehr & Peers, 2021.
Erin Harwayne
July 6, 2021
Page 19 of 28

Table 6: Project Generated Vehicle Miles Traveled
 Annual Project Project
 Days of
 Generated VMT Generated VMT
 Operation (J)
 (I) (K)
MBFC Operations
Front Office Activities 104,579 287
Team Practices 128,702 353
Match Staff and Players – Home Team 96,360 264
Match Staff and Players – Visiting Team 9,979 27
Match Spectators – CSUMB Students 84,736 232
Match Spectators – Monterey Peninsula 338,833 928
 365
Match Spectators – Salinas Valley 518,876 1,422
Match Spectators – Watsonville/Castroville/Gilroy 60,936 167
Match Spectators – Santa Cruz 28,348 78
Match Spectators – Other 149,879 411
Camps & Off-Season Activities 6,515 18
Other Services 1,784 5
 Subtotal (j) 1,529,527 4,192
CSUMB Operations
Campus & Community Event - Students 19,610 54
Campus & Community Event – Faculty & Staff 10,054 365 28
Campus & Community Event – Guests 71,741 197
 Subtotal (k) 101,405 279
 Total (k+l=m) 1,630,932 4,471
Source: Fehr & Peers, 2021.

To provide context, the daily Project generated VMT is compared to the CSUMB Campus Project
generated VMT under Existing Conditions and Existing with Project Conditions in Table 7. The
Project generated VMT rate of 44.71 is greater than the CSUMB campus under Existing
Conditions. Although it is a small portion of the CSUMB generated VMT, the project would
increase the CSUMB campus Project generated VMT rate to 22.59 under Existing with Project
Conditions.
Erin Harwayne
July 6, 2021
Page 20 of 28

Table 7: Project Generated Vehicle Miles Traveled
 Existing with
 Existing Project
 Project
 Conditions Generated VMT
 Conditions
CSUMB Campus Comparison
Project Generated Vehicle Miles Traveled (A)1 178,500 4,471 182,971
Service Population (B)1,2 8,000 100 8,100
Project Generated VMT per Service Population (A/B
 22.31 44.71 22.59
= C)
Notes:
1. Rounded service population and VMT to nearest 100 for the CSUMB campus.
2. Service population is defined as the sum of all employees, residents, and students (Kindergarten through University).
Source: Fehr & Peers, 2021.

The boundary VMT shown in Table 8 for Cumulative Conditions and Cumulative with Project
Conditions is the VMT on the roadway system within Monterey County. To evaluate the indirect
and cumulative conditions, the boundary VMT is summarized under Cumulative Conditions. The
Project generated VMT is added to the Cumulative Conditions boundary VMT to estimate the
Cumulative with Project Conditions boundary VMT. Because the Project generated VMT includes
some trips that travel outside of Monterey County, the change in the Cumulative with Project
Conditions boundary VMT is overstated.

Table 8: Boundary Vehicle Miles Traveled
 Cumulative with
 Cumulative Project
 Project
 Conditions Generated VMT
 Conditions
Monterey County
Boundary Vehicle Miles Traveled (A)1 11,268,400 4,471 11,272,871
Service Population (B)1,2 800,900 100 801,000
Boundary VMT per Service Population (A/B = C) 14.07 44.47 14.07
Notes:
1. Rounded service population and VMT to nearest 100.
2. Service population is defined as the sum of all employees, residents, and students (Kindergarten through University).
Source: Fehr & Peers, 2021.
Erin Harwayne
July 6, 2021
Page 21 of 28

VMT Impact Assessment
This section presents an analysis of the Project’s impacts relative to VMT, including the daily VMT
estimates for the SB 743 VMT assessment. The VMT thresholds are consistent with the 2019 CSU
TISM that provides guidance for the preparation of CEQA-compliant transportation impact
analysis pursuant to SB 743 and is the operative TISM for the analysis presented here. The VMT
thresholds were established using the AMBAG travel model. While the project specific VMT was
estimated by converting the MBFC and CSUMB special event activities into VMT. The Project
generated VMT per services population is used to evaluate the direct effects of the Project under
Existing with Project Conditions, while the boundary VMT is used under Cumulative with Project
Conditions to evaluate the project’s effect on VMT – an evaluation of cumulative impacts. The
results of the Project generated VMT and Project’s effect on VMT analyses are presented in Table
9 and Table 10, respectively. Each analysis is separately addressed below.

Project Generated VMT
As shown in Table 9, the 4,471 daily Project generated VMT would occur with the new MBFC and
CSUMB special event activities. On a per service population basis, which is the metric relative to
assessing impacts under CEQA VMT would be 87 percent greater than the VMT threshold (23.91
Project generated VMT per service population). While the MBFC and CSUMB special event
activities occur on very few days, they will attract 6,000 or more spectators throughout Monterey
County.

The significance threshold for Project generated VMT is 23.91, which is 15 percent below the
Existing Conditions VMT per service population for Monterey County of 28.12. Under the Existing
with Project Conditions, the Project would generate a VMT per service population of 44.71. This
number is above the applicable threshold of 23.91. Therefore, the Project generated VMT would
exceed the applicable thresholds under Existing with Project Conditions and be a potentially
significant impact.

While MBFC and CSUMB special event activities are infrequent, many of the 6,000 or more
spectators for each event are expected to travel by vehicle. Annually, the project would generate:

 • 269,350 person trips,
 • 108,070 vehicle trips, and
 • 1,630,930 Project generated VMT

The more than 1.6 million annual Project generated VMT occurs under the conditions described
earlier. Most of the annual Project generated VMT is generated by the MBFC match spectators,
off-season event participants, and CSUMB and community guests to the CSUMB Campus and
Community Event.
Erin Harwayne
July 6, 2021
Page 22 of 28

 • The 6,000 MBFC match spectators per match have a 75% vehicle mode share with a 2.23
 persons per vehicle and an average vehicle distance of approximately 16 miles.
 • The 100 off-season participants per event have a vehicle mode share to 75% and an
 average vehicle occupancy of 2.23 persons per vehicle and an average vehicle distance of
 approximately 16 miles.
 • The 2,000 CSUMB students for the CSUMB community event have a 58% vehicle mode
 share and an average vehicle occupancy of 2.23 persons per vehicle and an average
 vehicle distance of approximately 19 miles.
 • The 6,000 community guests for the CSUMB community event have a 77% vehicle mode
 share and an average vehicle occupancy of 2.23 persons per vehicle and an average
 vehicle distance of approximately 16 miles.

Table 9: Project Generated VMT for SB 743 VMT Assessment
 Project Generated
 VMT
Project Site
Project Generated Vehicle Miles Traveled (A)1 4,471
Service Population (B)1,2 100
Project Generated VMT per Service Population (A/B = C) 44.71
Initial Impact Assessment
 Project Generated VMT per Service Population Threshold (23.91) 44.71
 (Impact Conclusion) Potentially Significant
Notes:
1. Rounded service population and VMT to nearest 100.
2. Service population is defined as the sum of all employees, residents, and students (Kindergarten through University).
Source: Fehr & Peers, 2021.

VMT Sensitivity Analysis

The MBFC expects to average 4,140 spectators per match (69 percent of its 6,000 spectator
capacity) with ~75 percent of the spectators arriving in carpool vehicles with at least 3.5 persons
per vehicle. If these expectations are met, the project generation rate would be reduced to 25.57,
which is 6.9% percent greater than the Project generated VMT per service population threshold.

To not have a VMT impact, the project would need to generate less than 23.91 Project generated
VMT per service population, which is 872,715 annual Project generated VMT (23.91 Project
generated VMT per service population * 100 service population*365). If the CSUMB Campus and
Community Event occurs, the following conditions would need to be met for the MBFC match
spectators, off-season participants, and CSUMB students and community guests for the CSUMB
Campus and Community event:
Erin Harwayne
July 6, 2021
Page 23 of 28

 • The 4,140 MBFC match spectators (69% of the 6,000-spectator capacity) per match have a
 75% vehicle mode share with a vehicle occupancy of 3.91 persons per vehicle and an
 average vehicle distance of approximately 16 miles.
 • The 100 off-season participants per event have a vehicle mode share to 75% and an
 average vehicle occupancy of 3.91 persons per vehicle and an average vehicle distance of
 approximately 16 miles.
 • The 2,000 CSUMB students for the CSUMB Campus and Community have a 58% vehicle
 mode share and an average vehicle occupancy of 3.91 persons per vehicle and an
 average vehicle distance of approximately 19 miles.
 • The 6,000 community guests for the CSUMB Campus and Community have a 77% vehicle
 mode share and an average vehicle occupancy of 3.91 persons per vehicle and an
 average vehicle distance of approximately 16 miles.

If the Campus and Community Event does not occur, the 872,715 annual Project generated VMT
could be achieved with an average vehicle occupancy of 3.46 (instead of 3.91) for the MBFC
match spectators, off-season participants, and CSUMB students and community guests for the
CSUMB Campus and Community event listed above.

Project Mitigation

A Transportation Management Plan (TMP) with a Transportation Demand Management (TDM)
Program will be prepared prior to opening day of the MBFC season. The TMP with TDM Program
will manage and monitor MBFC and CSUMB special event spectator traffic with the primary
performance standard of achieving less than 23.91 daily Project generated VMT per service
population and the following annual travel supporting performance standards:

 • Achieving fewer than 61,185 annual vehicle trips.
 • Achieving less than 872,715 annual Project generated VMT.

To further evaluate the effectiveness of the TDM program, the monitoring will also observe the
event specific supporting performance measures of mode share, average vehicle occupancy and
average vehicle distance of the MBFC and CSUMB special activities. These event specific
performance measures are needed to determine the effectiveness of TDM Program and help
identify additional VMT reducing measures.

The TMP shall provide a management and operating plan for minimizing undesirable
transportation-related effects at Freeman Stadium and adjacent developments during events,
while providing safe and convenient access for employees and spectators to the project. While
the TDM Program will provide a plan to reduce the amount of vehicle traffic generated by the
MBFC and CSUMB special event activities by shifting employees, team personnel, match
spectators, and CSUMB visitors from driving alone to using transit, carpooling, cycling, and
walking modes. As written in the facilities agreement, the TDM Program obligation in this
Erin Harwayne
July 6, 2021
Page 24 of 28

measure is to apply for the lifetime of the Project. The TDM Program may specify a phased
implementation approach that provides initially for implementation of the existing CSUMB TDM
Program that are targeted to reducing CSUMB student, faculty, and staff vehicle travel. To achieve
the VMT threshold, CSUMB will develop an expansive TDM Program to ensure most spectators
travel in very high average vehicle occupancy vehicles. CSUMB shall have the authority and
discretion to permit modification of the measures provided that the modifications continue to
achieve the overall vehicle miles traveled reduction objective.

Transportation Management Plan and Transportation Demand Management Program Mitigation

The TMP with a TDM Program will address the following objectives for the MBFC and CSUMB
special events:

 • Reduce the overall number of automobile trips to and from the stadium and required
 parking supply.

 ◦ Annual travel supporting performance standard to monitor: Achieving fewer than
 61,185 annual vehicle trips.

 • Reduce automobile dependency for project employees and spectators through
 education, assistance, and incentives.

 ◦ Event specific supporting performance standard to monitor: Achieving a 75% vehicle
 mode share for the MBFC match spectators, and for the CSUMB Campus and
 Community Event; 58% and 77% vehicle mode share for the CSUMB students and
 community members, respectively.
 ◦ Event specific supporting performance standard to monitor: Achieving an average
 vehicle occupancy of 3.91 persons per vehicle (or greater) for the MBFC match
 spectators, and CSUMB students and community members for the CSUMB Campus
 Community Event.

 • Identify the paths of vehicular circulation to and from the stadium for the various vehicle
 types that would need access to the site, including passenger vehicles, service and
 delivery vehicles, garbage/recycling trucks, taxis, buses, and emergency vehicles.

 ◦ Primary performance standard to monitor: Achieving less than 23.91 Project
 generated VMT per service population.
 ◦ Annual travel supporting performance standard to monitor: Achieving less than
 872,715 annual Project generated VMT.
 ◦ Event specific supporting performance standard to monitor: Achieving an average
 vehicle occupancy of 3.91 persons per vehicle (or greater) for the MBFC match
 spectators, and CSUMB students and community members for the CSUMB Campus
 Community Event.
Erin Harwayne
July 6, 2021
Page 25 of 28

 ◦ Event specific supporting performance standard to monitor: Achieving an average
 vehicle distance of approximately 16 miles (or less) for MBFC match spectators, off-
 season participants, and community guests to the CSUMB Campus and Community
 Event. And an average vehicle distance of 19 miles (or less) for CSUMB students for
 the for the CSUMB Campus and Community Event.

 • Develop and describe pre- and post-event operational procedures for the management
 of pedestrians, passenger vehicle, and special vehicle flows arriving and departing the
 project site.
 • Identify the special event signage, including Changeable Message Signs (CMS), blank-out
 signs, and flashing beacons, that would be required, including wayfinding signage.
 • Identify best locations for provision of bicycle parking spaces for visitor or employee use
 during event and non-event operations.
 • Identify placement of enforcement personnel required for event conditions.
 • Identify need for barricades, parking control, and street closures during events.
 • Coordinate with CSUMB staff regarding the provision of paratransit and transportation
 network company (e.g., Uber and Lyft) pick-up/drop-off.
 • Identify sidewalk and crosswalk improvements near the project site.

To the extent possible the TDM Program will rely on the existing CSUMB TDM Program to reduce
CSUMB student, faculty, and staff vehicle travel. 5 At a minimum, the following measures will be in
place upon opening of the stadium prior to opening day of the MBFC season and thereafter for
the life of the project:

 • Otter Cycle Center – on campus bicycle repair shop that also offers bicycle rentals and
 other services to facilitate bicycle ridership.
 • Bicycle Storage and Amenities – several hundred bicycle racks have been installed on
 campus outside of residence halls and popular academic, recreation and administrative
 buildings. Additionally, a secure bicycle bunker storage room have been installed, as well
 as two ‘fix-it’ stations that provide 24/7 access to bicycle repair tools and air pumps.
 Bicycle registration is also available through the University Police Department to simplify
 that process. Three skateboard storage racks also have been installed in the popular
 destinations on campus.
 • Paid Parking – to discourage non-CSUMB related trips and parking on campus, as well as
 manage the vehicles allowed on campus, a fee structure is in place that is based upon

5 The existing CSUMB TDM Program complements the on-campus housing of students, faculty, and staff and
 enhances the quality of pedestrian, bicycle, and transit facilities on campus. Housing and high-quality
 transportation infrastructure helps to promote walking, bicycling, and transit use, which reduces vehicle
 trips to/from the campus.
Erin Harwayne
July 6, 2021
Page 26 of 28

 user type. The fees have increased several times over the last two decades to more
 accurately match the true cost of providing managed parking.
 • Monterey Salinas Transit (MST) – the campus has entered into an annual agreement with
 MST that provides universal access on the MST bus network for all active CSUMB ID card
 holders, three supplemental campus-serving and subsidized bus routes, and funding for a
 shared transit marketing student intern.
 • Emergency Ride Home Program – campus community members can sign up for a
 program run by the Transportation Agency for Monterey County (TAMC) that reimburses
 taxi or ridesharing trips home in emergency situations for commuters who use alternative
 means of transportation.
 • Carsharing and Ridesharing – CSUMB hosts four cars for carsharing. These are cars
 stationed on the campus available to be used by carshare members in the
 campus. CSUMB students, faculty and staff can use Go831 a regional ride share program.
 • Transportation Services Website – information for most of the TDM strategies listed
 above is included on a campus website to facilitate information dissemination.
 • Delivery Vehicle Limitations – to discourage delivery vehicle trips, frequent delivery
 services to campus, such as office supplies, have been instructed to reduce their deliveries
 to campus to no more than three days per week.
 • Bicyclist/Pedestrian Malls – to encourage pedestrian and bicycle use, a section of Divarty
 Street and a section of Sixth Avenue are closed to regular vehicular traffic and encourage
 pedestrians and bicyclists to use the entire roadway.
 • Traffic Calming – to discourage auto use (and improve safety), speed humps and flashing
 beacon crosswalk devices have been installed on several campus roadways to encourage
 lower vehicle speeds, particularly near high traffic pedestrian crosswalks.

Monitoring

Each event shall be monitored by CSUMB to ensure that the MBFC and CSUMB special event
activities meet the primary performance standard (Project generated VMT per service population),
annual travel supporting performance standards (annual Project generated VMT, and annual
vehicle trips) and event specific supporting performance standards (mode share, average vehicle
occupancy and average vehicle distance). An annual monitoring memorandum shall be submitted
to CSUMB staff. If the MBFC and CSUMB special event activities are found not to follow the
mitigation measure, then additional travel reducing measures from the TMP and TDM Program
will be implemented to achieve the performance standard. The MBFC and/or CSUMB may
propose new strategies that develop over time to further reduce annual Project generated VMT
per service population if substantial evidence is provided to support the efficacy of the strategy.
The MBFC and CSUMB staff expect to develop a TMP and TDM Program that achieves the
performance standards listed above; therefore, the project impact would be less-than-significant.
Erin Harwayne
July 6, 2021
Page 27 of 28

Alternative Monitoring Approach

CSUMB may develop a regionwide VMT monitoring program to allow global monitoring of the
stadium VMT, which may provide cost efficiencies and be a more effective way to track VMT
generation for each event. The monitoring program could make use of emerging technologies
including location-based services on cell phones and in vehicles to track trip lengths, along with
traditional technologies such as driveway traffic counts. If such a program is developed, the
Project could participate in the monitoring and demonstrate performance relative to the Project’s
VMT target.

Remedial Action

If the TMP with TDM Program monitoring results show that the trip reduction target is not
being met, the TDM Program shall be updated to identify replacement and/or additional
feasible TDM measures to be implemented. The updated TDM Program shall be submitted to
the CSUMB and approved by the CSU Office of the Chancellor. The updated TDM Program shall
also identify other TDM measures that were considered but determined to be infeasible or
ineffective. This will include the enhanced CSUMB TDM Program that would address travel by
MBFC spectators and complement other multimodal infrastructure investments, vehicle
restrictions, pick-up/drop-off charges, transit mobility, and active mode (bicycle and pedestrian)
mobility. CSUMB staff shall oversee and coordinate the implementation of the feasible
additional TDM Program measures and continue to explore methods of making other potential
TDM measures feasible.

Project’s Effect on VMT
As shown in Table 10, this analysis evaluated whether the Project would result in an increase in
the countywide boundary VMT per service population from “Cumulative Conditions” to
“Cumulative with Project Conditions” (this analysis does not assume the Eastside Parkway
extension). The regional impact threshold for the Project’s effect on VMT is the Monterey County
Cumulative Conditions boundary VMT per service population of 14.07.

The Project’s effect on VMT under Cumulative with Project Conditions of 14.07 is equal to the
threshold of 14.07. Therefore, the Project would not exceed the applicable thresholds relative to
the Project’s effect on VMT under Cumulative with Project Conditions and the impact is less than
significant.
You can also read