Assessing the relative toxicity of different road salts and effect of temperature on salinity toxicity: LCx values vs. no effect concentration ...
←
→
Page content transcription
If your browser does not render page correctly, please read the page content below
Assessing the relative toxicity of different road salts
     and effect of temperature on salinity toxicity: LCx
       values vs. no effect concentration (NEC) values
Benjamin J.G. Moulding1, Guillame Kon Kam King2, Mark Shenton1, Jon P. Bray1,3, Susan J.
                                  Nichols1 and Ben J. Kefford1

1
    Centre for Applied Water Science, Institute for Applied Ecology, University of Canberra,
ACT 2601, Australia

2
    Université Paris-Saclay, INRAE, MaIAGE, 78350, Jouy-en-Josas, France

3
    Gisborne District Council, PO Box 747, Gisborne 4010, New Zealand

Corresponding author: Benjamin JG Moulding

Abstract

Freshwater biota are at risk globally from increasing salinity, including increases from de-
icing salts in cold regions. A variety of metrics of toxicity are used when estimating the
toxicity of substances and comparing the toxicity between substances. However, the
implications of using different metrics is not widely appreciated. Using the mayfly
Colobruscoides giganteus (Ephemeroptera: Colobruscoidea) we compare the toxicity of
seven different salts where toxicity was estimated using two metrics 1) the no effect
concentrations (NEC) and 2) the lethal concentrations for 10, 25 and 50% of the test
populations (LCx). The LCx values were estimated using two different models, the classic
log-logistic model and the newer toxicokinetic-toxicodynamic (TKTD) model. We also
compare the toxicity of two salts (NaCl and CaCl2) for C. giganteus at water temperatures of
4°C, 7°C and 15°C using the same metrics of toxicity. Our motivation for using a mayfly to
assess salinity toxicity was because mayflies are generally salt sensitive, are ecologically
important and are common in Australian (sub-)alpine streams. Considering 144-hour LCx
values, we found toxicity differed between various salts, i.e., the lowest 144-hour LC50 (8
mS/cm) for a salt used by a ski resort was half that of the highest 144-hour LC50 from
artificial marine salts and CaCl2 applied to roads (16mS/cm). 144-hour LC50 results at 7°C
showed that analytical grade NaCl was significantly more toxic (7.3mS/cm) compared to
analytical grade CaCl2 (12.5mS/cm). Yet for NEC values, there were comparably fewer
differences in toxicity between salts and none between the same salts at different
temperatures. We conclude that LCx values are better suited to compare difference in toxicity
between substances or between the same substance at different test temperatures, while NEC
values are better suited to estimating concentrations of substances that have no effect to the
test species and endpoint measured under laboratory conditions.

                                                                                               1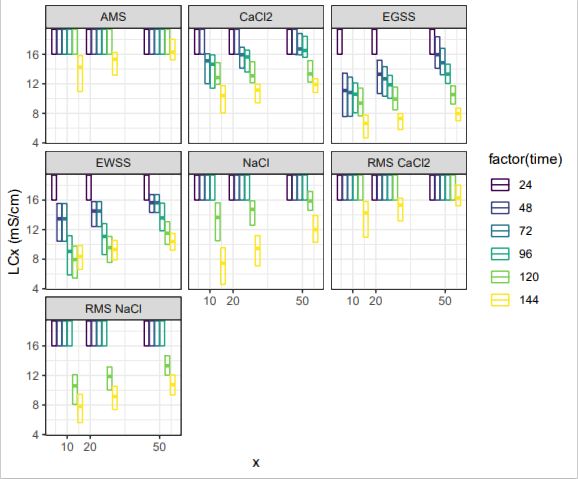
Introduction

Salinity is rising in many freshwaters because of a range of anthropogenic causes including
agriculture, mine effluent (Cañedo Argüelles, et al. 2013; Sauer, et al. 2016; Niedrist et al
2021) and in cold regions applications of salts for de-icing i.e., to prevent the build-up of
snow and ice (Niedrist, et al. 2020; Shenton, et al. 2021). The application of de-icing salts
involves applying salts to roads, typically sodium chloride (NaCl) and/or calcium chloride
(CaCl2). It is increasingly been recognised that concentrations and/or ratios of major ions that
makeup salinity are as important as the total salinity concentration (Cañedo-Argüelles, et al.
2016) to the toxicological effects on freshwater organisms. Consequently, the ecological and
toxicological effects of road de-icing may differ depending on whether NaCl, CaCl2 or both
are used. Additionally, those studies which have assessed the toxicity of different salts
(Mount et al. 2019) have tended to use high purity, i.e., analytical grade salt (Mount et al.
1997) and it is feasible there may be differences in toxicity between the salts applied in de-
icing applications and these high purity salts used in toxicity tests, as the former would be
expected to have lower purity.
Toxicity tests are a widely used experimental method to measure the toxicity of substances
for individual test-species organisms. The results of toxicity tests can be expressed using a
range of metrics. When the measured response of a test organism is mortality, the
concentration lethal to x% of the test population is the most commonly used metric (LCx, see
Table 1). For example, the LC50 is the median concentration of a toxicant in a solution that is
lethal to 50% of the test organisms (Burton. 1997). LCx are calculated for a pre-determined
exposure period. The duration of acute tests with macroinvertebrates are usually between 24
and 96 hours. For stream macroinvertebrates exposed to salinity, 72-hour LC50 values are
commonly used (e.g., Kefford et al. 2012, Castillo et al, 2017). Toxicity tests are typically
conducted within ±1-2◦C of the desired test temperate, although temperature is acknowledged
to alter toxicity (Jackson and Funk,2019, Macaulay et al. 2020). Consequently, the LC50 gives
the concentration lethal to 50% of the test population for the indicated period of exposure at
the test temperature indicated and makes no assessment of the response of the test organisms
at other periods of exposure or test temperatures.
An alternative metric to LCx, is the No Effect Concentration (NEC) estimated with a
toxicokinetic-toxicodynamic (TKTD) model (Jager et al 2011, Kon Kam King et al 2015).
NEC estimates the maximum concentration that has no observed effect on the test population
studied and the response (or endpoint) measured. Such a response may be mortality (as with
LCx) but could alternatively measure sub-lethal responses, such as inhibition of a
physiological function or the response of a whole organism (e.g., growth or reproductive
output). Unlike LCx values, the NEC is time independent (Kon Kam King et al. 2015). LCx
values are always associated with some level of mortality as it is not possible to have x=0.
Moreover, as x approaches zero, uncertainty in the estimate of the LCx value increases giving
imprecise estimates. In contrast, the NEC is an estimate of the maximum concentration that
has no effect, e.g., zero mortality from the toxicant, and no mortality beyond which occurs in
the control.
The statistical method by which LCx values are classically estimated, e.g., log-logistical
models, uses only the data from the exposure period that the LCx is reported. Consequently,
when using a log-logistic model to estimate LCx values, not all data that is typically available

                                                                                               2
to the investigators is used. For example, in estimating 96-hour LCx values the investigators
  would typically have survival data at 24, 48, 72 and 96 hours, but when using a log-logistic
  model they would only use the data from 96 hours. TKTD model (Jager et al 2011, Kon Kam
  King et al 2015), that are used to estimate NEC values can also estimate LCx values but they
  use data from all survival observations, potentially allowing TKTD to produce better
  estimates of LCx values. We shall refer to LCx values estimated by a log-logistic model as the
  classic LCx values or estimated by a classic model, and those LCx values estimated by a
  TKTD model as TKTD LCx values.
  Table 1: Abbreviations and salt types

Abbreviations
EC = Electrical Conductivity, a measure of salinity, which is widely used as it can be automatically measured
to provide a continues time series of salinity
LCx = Lethal concentration to x% of the test population, e.g., LC50 is the concentration lethal to 50% of the
test population
NEC = No Effect Concentration
TKTD = Toxicokinetic-toxicodynamic
Salt types
AMS: Artificial marine salts (used in marine type aquariums)
NaCl: Sodium chloride (analytical grade)
CaCl2: Calcium chloride (analytical grade)
RMS NaCl: Sodium chloride applied as a de-icing agent by RMS of NSW
RMS CaCl2: Calcium chloride applied as a de-icing agent by RMS of NSW
EWSS: Evaporated washed sea salt applied as a de-icing agent by Perisher Blue
EGSS Evaporated gourmet sea salt applied as a de-icing agent by Perisher Blue

  Another potentially important factor is water temperature during salinity exposure. Recently,
  Jackson and Funk (2019) observed, that between 5-25º, four mayfly (Ephemeroptera) species
  tended to have higher 96-hour LC50 values (i.e., are more tolerant) when tested at lower water
  temperatures. Salinity levels from de-icing salts are typically maximum in months when
  water temperatures are typically much lower than used in standard toxicity tests. Thus,
  Jackson and Funk (2019) suggest that standard toxicity tests may overestimate toxicity.
  However, in aquatic ectotherms, metabolic rates are often highly correlated with water
  temperatures (Sutcliffe, 1984), and thus, higher LC50 values from a fixed exposure period at
  colder water may not necessarily reduce toxicity at colder water temperatures. Rather it may
  indicate that at longer exposure periods there is no effect of water temperature on toxicity.
  Here, we have three aims. First is to determine if the toxicity of various salts (artificial marine
  salts (AMS), analytical grade NaCl and CaCl2 and four salts (Table 1) used in de-icing
  operations near Perisher, New South Wales (NSW), Australia) differed for the mayfly
  Colobruscoides giganteus (Ephemeroptera: Colobruscoidea). Second, to determine if water
  temperatures influenced the toxicity of two salts (analytical grade NaCl and CaCl2) using C.
  giganteus. Third, we examine the relative merits of using the three separate approaches by
  assessing toxicity LCx values estimated by a log-logistic model, by a TKTD model, and NEC

                                                                                                                3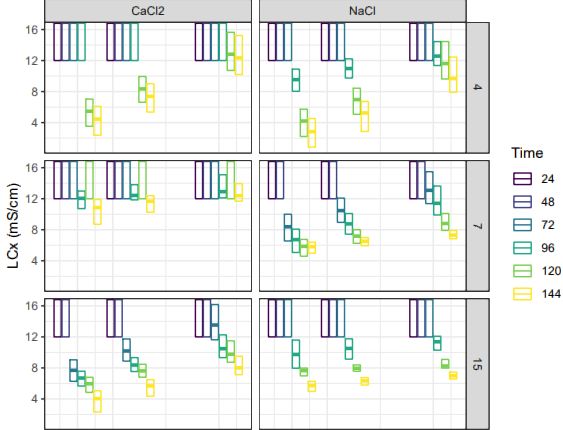
values estimated by the same TKTD model. We determine if patterns in relative toxicity
between the salts and water temperature were consistent across the two methods of estimating
LCx and the NEC values.

Methods

Field collections

A range of alpine stream macroinvertebrates were collected during the colder months when
salts are typically applied (June-September) during 2018 from six sites at 1400-1700 m
elevation, near Perisher, Kosciuszko National Park (Supplementary Table S1; Supplementary
Figures S1 and S2). Stream water temperature during these collections ranged between
0.4°C-5.2°C. Macroinvertebrates were kept in aerated site water, with some detritus and
sediment, during transport. Rapid toxicity tests (RTT) were started in the laboratory within
24-hours of collection and methods are reported in detail in (Moulding. Hnrs. Thesis, 2018)
Following the RTTs, Colobruscoides giganteus was chosen to make more precise estimations
of the toxicity of various salts and the effect of water temperature on salinity tolerance. This
species was chosen because it is a mayfly (Ephemeroptera) which are generally considered
salt sensitive (Kefford 2019), are ecologically important and are common in (sub-)alpine and
alpine Australian streams. We specifically chose C. giganteus because of its high abundance
in field collections and high long-term survival in laboratory under a control conditions, see
also (Bray et al. 2021). All C. giganteus came from one site, Rock Creek (S36.41, E148.41,
elevation 1700 m). Rock Creek is close to its headwaters, has minimal urban disturbance, no
de-icing salt input (Supplementary Table S1; Supplementary Figures S1 and S2) and
consistently has low salinity levels (always
where twitching occurs, it is considered alive and become a ‘missing’ individual from the
experiment at subsequent observations. LCx (x= death of 10, 25 and 50% of the test
population) values were recorded for time periods (24, 48, 72, 96, 120 and 144 hours)
Experiment 1: What is the difference in toxicity of different salts to Colobruscoides
giganteus

A single conventional toxicity test was used to compare relative toxicities of seven different
salts to C. giganteus at 7°C ± 1.0°C. The seven salts were: AMS (Ocean Nature), analytical
grade CaCl2 and NaCl and four types of salt applied for de-icing in and around Perisher.
These salts were CaCl2 (flakes) and NaCl (granulate) used by government authority
responsible for de-icing operations, the Roads and Maritime Services of NSW (RMS,
hereafter these salts are referred to as RMS CaCl2 and RMS NaCl, respectively) and two
types of salts used by the Perisher Environmental Team: evaporated gourmet sea salt (EGSS)
and evaporated washed sea salt (EWSS) (both ‘mermaid’ brand). AMS was included to be
able to compare the results to other published toxicity results (Kefford et al. 2012). Analytical
grade NaCl and CaCl2 were used as these salts (at lower purity) are widely used as de-icing
salts, including near Perisher (Shenton et al. 2021). The salt used by the RMS and the
Perisher Environmental Team were used to determine the toxicity of the salt applied to the
environment. Treatment solutions in electrical conductivity (EC) were 0.1 (control), 4, 8, 12
& 16 mS/cm.
Experiment 2: Does water temperature effect salinity toxicity to Colobruscoides
giganteus.

A conventional toxicity test was also used to compare the sensitivity to analytical grade NaCl
and CaCl2 of C. giganteus at a cold temperature (4°C ±1.0°C), a mid-temperature (7°C
±1.0°C) and a high temperature (15°C ±1.0°C). The cold temperature mimics typical winter
water temperatures observed at Rock Creek. The mid temperature environment was chosen to
mimic observed early spring water temperatures and the high temperature environment was
used to mimic observed late spring/early summer water temperatures (Shenton et al. 2021,
unpublished data). The EC of treatments for this experiment were 0.1 (control), 5, 6, 7, 8 &
12 mS/cm. Experiment 1 had 0% survival at 16 mS/cm, consequently, this salinity level was
removed from experiment 2.
Data Analysis
In both experiments, GUTS-SD (General Unified Threshold Survival) (Jager et al, 2011) was
used to determine LCx and NEC results. GUTS-SD is a type of Toxico-Kinetic Toxico-
Dynamic model which allows using time-resolved data collected during each experiment
(i.e., survival data at 24, 48, 72, 96, 120 and 144 hours). LCx were also estimated using a 2-
parameter log-logistic model (Ritz et al. 2015). Parameter inference for both models was
performed in the Bayesian framework using JAGS (Plummer 2016), with vaguely
informative priors adopted by the experimental design (concentration grid, measurement
frequency, priors inspired by Delignette-Muller et al. (2017)). Posterior distributions for the
LCx could be calculated directly from the posterior distribution on the parameters for the log-
logistic model, while a numerical inversion was necessary for the GUTS-SD model. Because
of the use of the Bayesian framework uncertainty in estimates of LCx and NEC values are

                                                                                                5
given in 95% credibility intervals (not to be confused with 95% confidence intervals which
are commonly used with a frequentist framework).
Results
Survival of C. giganteus in controls (0.1 mS/cm) was 100% over 144-hours across both
experiments. At high salinities its survival decreased in all salt and temperature combinations.
Experiment 1: What is the difference in toxicity of different salts for Colobruscoides
giganteus
Using the classical LCx model, a log-logistic model, LCx values generally decreased with
increasing exposure period (Figure 1). However, there were some exceptions. For example,
the median estimate of the LC10 for EWSS increased from 120 hours to 144 hours. In the
absence of mortality, classical LCx values for short exposures e.g., 24 hours could not be
estimated and only a lower bound was available.
Classical LCx values did show that some salts had clearly different toxicity, with these
differences being best indicated at prolonged exposure i.e., 120-hours and 144-hours (Table
2). AMS was consistently less toxic than all other salts tested, with a median estimate of 144-
hour LC50 of about 16 mS/cm. In comparison, EWSS had a value for this parameter at about
10 mS/cm.
Disregarding statistical significance, a ranking of the classical LC50 mean values at 144-hours
suggests EGSS is the most toxic salt (8mS/cm), followed by EWSS (10mS/cm), RMS NaCl
(11mS/cm), CaCl2 and NaCl (12mS/cm). AMS (16 mS/cm) and RMS CaCl2 appear to be the
least toxic salt (16mS/cm) where medians and means were effectively identical (Table 2).
Table 2: 144-hour LC50 results for seven different salts tested in experiment 1. See
Supplementary Table S2 for a full listing of LCx values at exposure periods.
Salt type Lower CI median Upper CI Mean
EGSS 7.73 7.97 8.70 7.94
EWSS 9.98 10.39 11.48 10.38
RMS NaCl 10.28 10.74 12.08 10.74
CaCl2 11.64 11.92 12.69 11.86
NaCl 11.42 12.01 13.92 12.03
AMS 16.01 16.29 18.03 16.40
RMS CaCl2 16.01 16.29 18.02 16.40
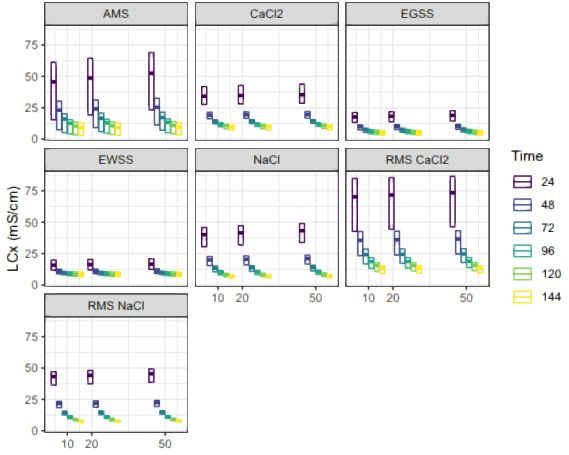
When applying the TKDT model, estimates of LCx values were more variable for AMS and
RMS CaCl2 than all other salts, especially at the lower time periods, i.e., 24 and 48 hours
(Figure 2).
6Figure 1: Classical (log-logistical) modeled lethal concentrations for x% of the test population or LCx
(mS/cm) values for 7 different salts at 7ºC ± 1ºC showing 5 different exposure periods (from left to
right 24, 48, 72, 96, 120 and 144 hours); x= LCx 10, 25, 50 (from left to right). Median estiamte
indicated by hrozontal line within box, 95% credibility intervals indicated by boxes. The y-axis is
curtailed at 20 mS/cm and in those esimates without a median plotted, the upper 95% credibility
interval continues to infinity. A full listing of all LCx estiamtes shown here is given in Suplemntary
Table S1.
7Figure 2: TKDT modelled lethal concentrations for x% of the test population or LCx (mS/cm) values
for seven different salts at 7ºC ± 1ºC showing six exposure periods (from left to right 24, 48, 72, 96,
120 and 144 hours); x= LCx 10, 25, 50 (from left to right). Median indicated by horizontal line within
box, 95% credibility intervals indicated by boxes. A full listing of all LCx estimates shown here is
given in Supplemntary Table S2. See also Supplementary Figure S3.
TKTD modelled LCx values always declined with increasing exposure period and the upper
95% credibility interval was always defined i.e., it was never infinity (Figure 2). There were
also differences in the toxicity of some salts apparent even after brief exposure periods. For
example, at 24 hours of exposure AMS had high a higher LC50 value than EWSS with no
over-lapping of their 95% credibility intervals. Nevertheless, credibility intervals did narrow
with increasing exposure period across all salts tested (Table 2).
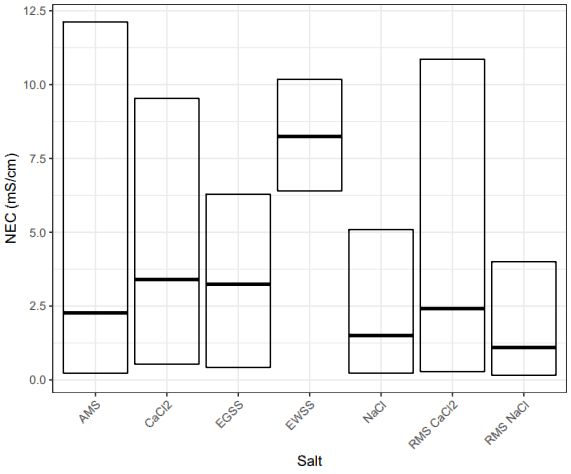
NEC values for the seven salts at 7ºC showed that EWSS was significantly less toxic
compared to NaCl, EGSS and RMS NaCl (Figure 3). However it does appear that NaCl and
RMS NaCl have a lower median NEC compared to EGSS, all other salts (AMS, CaCl2 and
RMS CaCl2) do have greater confidence intervals (Figure 3). The other salts had fewer
precision estimates of their NEC values and it is credible that these salts all had NEC values
that encompass estimates for the NEC values of EWSS, NaCl and RMS NaCl. Considering
only the median estimate of NEC values, EWSS (~8 mS/cm) was less toxic than all of the
other salts, which had similar toxicity’s ranging from least toxic to most toxic CaCl2
8(~2.5mS/cm), EGSS and RMS CaCl2 (~3mS/cm), AMS(~2.4mS/cm), NaCl(~2mS/cm) then
RMS NaCl(~1.75mS/cm).
Figure 3: No observed effect concentrations or NECs (mS/cm) values for seven different salts at 7ºC ±
1ºC using the TKDT model. Median indicated by error bars; 95% credibility intervals indicated by
boxes. A full listing of all NEC estiamtes shown here is given in Supplementary Table S3.
Experiment 2: Does water temperature have an effect on the salinity toxicity to
Colobruscoides giganteus.
As with the previous experiment with the seven salts, classically estimated LCx values for
CaCl2 and NaCl at the three temperatures (4°C, 7°C, 15°C) tended to decrease with
increasing exposure period but there were some exceptions (Figure 4). The LCx values of
CaCl2 at 7°C increased between 96 hours and 144 hours. Again, as with the previous
experiment, the upper credibility intervals for brief exposures (e.g., 24 and 48 hours) LCx
values was at infinity, thus providing very poor estimates of toxicity.
In terms of patterns in toxicity between temperatures, the classical LCx values show that
CaCl2 had similar toxicity at 4°C and 7°C but was more toxic at 15°C. In contrast, NaCl
toxicity tended to increase with increasing water temperature, see for example the 144-hour
LC50 values.
The classic LCx values with long exposure (i.e., 120 and 144 hours) showed NaCl was
considerably more toxic than CaCl2 at 7°C, while at 4°C and 15°C the differences in toxicity
between these salts were less. At 4°C and 15ºC the credibility intervals overlapped between
the salts for the 144-hour LC50 values. The difference in their toxicity was minimal at 4°C
and 15ºC compared to 7°C.
9Figure 4: Classical (log-logistical) modelled lethal concentrations for x% of the test population or
LCx values (mS/cm) to analytical grade CaCl2 and NaCl and temperature (4°C, 7°C, 15°C). The
multiple estimates for each x represent estimates (from left to right 24, 48, 72, 96, 120 and 144
hours). x= LCx 10, 25, 50 (from left to right). Median indicated by the horizontal line within box, 95%
credibility intervals indicated by boxes. The y-axis is curtailed at 17 mS/cm and in those estimates
without a median plotted, the upper 95% credibility interval continues to infinity. A full listing of all
LCx estiamtes shown here is given in Suplemntary Table S3.
Figure 5: Log scale TKDT modelled lethal concentrations for x% of the test population or LCx values
(mS/cm) to analytical grade CaCl2 and NaCl and temperature (4°C, 7°C, 15°C). The multiple
estimates for each x represent (from left to right 24, 48, 72, 96, 120 and 144 hours. x= LCx 10, 25, 50
10(from left to right). Median indicated by error bars; 95% credibility intervals indicated by boxes. A
full listing of all LCx estiamtes shown here is given in Suplemntary Table S4.See also Supplementary
Figure S4.
As with the previous experiment, the TKTD modelled LCx values always decreased with increasing
exposure period and the upper credibility interval was always defined (i.e., less than infinity) (Figure
5). For CaCl2 credibility intervals were much narrower at 15°C than at 4°C and 7°C. For NaCl,
credibility intervals were slightly wider at 4°C than the 7°C and 15°C.
Similar to the classical LCx values, there was no evidence of difference in the CaCl2 LCx
values between 4°C and 7°C. At 15°C CaCl2 was more toxic than at either of the other
temperatures tested. NaCl was least toxic at 4°C and this salt had similar toxicity at 7°C and
15°C.
Figure 6: No observed effect concentrations or NECs (mS/cm) values for NaCl and CaCl2 for temperature ranges
(4°C,7°C,15°C); median indicated by error bars, 95% credibility intervals indicated by boxes.
All estimations of NEC values for both salts at all three temperatures had NEC values with
overlapping credibility intervals. Considering median estimates, NEC values for both salts
were higher (indicating greater toxicity) at the intermediate temperature (7°C) than at both
4°C and 15°C.
Discussion
The different methods of toxicity estimation, i.e., classically modelled (i.e., log-logistic) LCx
values, TKTD modelled LCx values and TKTD modelled NEC values, provided different
estimates of toxicity. Classical LCx estimates were incalculably high for short exposure
periods with only the lower credibility interval estimated and the upper credibility intervals
stretching to infinity. This is a function of the salinity concentrations chosen having limited
mortality at 24 and often 48 hours. No doubt with the inclusion of high salinity
concentrations better estimates of classic 24 and 48-hour LCx values would have been
obtained. In contrast, the TKTD modelled LCx values always had upper credibility intervals
defined below infinity. Where a toxicity test aims to make estimates of LCx values across a
wide range of exposure periods (e.g., 24 to 144 hours, as in the current paper), there are
considerable advantages of using a TKTD model.
11Classical LCx values tended to, but did not always, decrease with increasing exposure period,
while TKTD LCx values always decreased with increasing exposure period. Toxicity depends
on both concentration and duration of exposure. With an increase in the duration of exposure
toxicity should either be unchanged (if there is no more mortality) or should increase.
Consequently, LCx values should not increase with increasing exposure periods, as
occasionally occurred with the classical LCx values.
The LCx values, whether estimated classically or by the TKTD model showed differences in
toxicity between some salts and the same salt at different water temperatures. The estimated
NEC values, however, had overlapping credibility intervals across salts or temperatures, with
one exception. This exception was that EWSS had a higher NEC value (~8mS/cm) than all
other salts (~1.75 mS/cm for RMS NaCl appearing to be more toxic and CaCl2 being the least
toxic of other salts ~3.2 mS/cm). Regardless of this exception, the NEC values were less
effective at detecting differences in toxicity between the salts or temperatures than both LCx
models. LCx values appear to be better for comparing toxicity between substance or the same
substance at different test temperatures. For aiding in the setting of environmental quality
guidelines, NEC values are likely to be more useful especially when using one of the more
sensitive taxa within a studied environment (C. giganteus), although environmental quality
guidelines should also consider sub-lethal toxicity and indirect effects of toxicants (Bray et al.
2018).
Experiment 1: What is the difference in toxicity of different salts to Colobruscoides
giganteus
The current study is the first that we are aware of which has compared the toxicity of analytical
grade salts to those used by de-icing operations. Our results show considerable variability in
the toxicity of NaCl dominated salts for example, in terms of classical mean LC50 values EGSS
(8/mS/cm) was considerably more toxic than all other NaCl dominated salts (10-16mS/cm),
two-fold RMS CaCl2 (16 mS/cm) at 144 hours (Table 2). In contradiction to both LCx models,
the NEC showed that EWSS was significantly less toxic than all other salts tested. All other
salts showed no differences in toxicity between each other when the NEC was applied as
indicated by overlapping credibility intervals.
Experiment 2: Does water temperature have an effect on the salinity toxicity to
Colobruscoides giganteus
Temperature has fundamental effects on almost all biological processes and it is thus not
surprising that it modulates the toxicity of many environmental contaminants including salt
toxicity to freshwater ectotherms (Orr and Buchwalter 2020, Verberk et al 2020). Previously,
four mayfly species showed lower (classical) 96-hour LC50 values (i.e., more toxic) for NaCl
when temperature was increased (Jackson & Funk. 2018). Our results show a similar effect, at
least for classical LC50 values for NaCl. For CaCl2, however, we found no apparent difference
in toxicity (as indicated by both LCx models) between 4°C and 7°C but higher toxicity at 15°C.
Increased temperature is thought to increase toxicity because of an increase in ion transport
rates and a higher energy expense during osmoregulation (Orr and Buchwalter. 2020, Verbeck
et al, 2020). However, apparent differences in some LCx values for different salt and/or
temperatures do not necessary indicate difference in toxicity long-term as shown by the NEC.
12The similarity in the NEC values for NaCl and CaCl2 at the different temperatures means that
we cannot exclude the hypothesis that both salts are similarly toxic at all three of the tested
temperatures but that it takes longer for the effect to occur at the colder temperatures due to
decreased metabolism at colder temperatures. Thus, comparisons between different salt,
temperatures, etc. with LCx values need to be treated with caution and may not necessarily
indicate real differences in long-term toxicity.
Why are there differences in toxicity indicated by LCx and NEC?
We showed apparent differences in toxicity between salts or between the same salt at
different exposure temperatures, indicated by one or both LCx models; however, this was not
reflected with NEC values. This appears to be because there was similar overall toxicity of
the different salt or exposure temperatures, but that for some salt or at some exposure
temperatures, it took longer exposures for the similar toxicity to be apparent.
NEC values are time independent, that is, they estimate a threshold of toxicity that has no
effect on the test population for any length of exposure for the relevant endpoint (Kon Kam
King et al. 2015), in our case mortality. This is because any LCx values are an estimate of the
concentration which cause the indicated proportion of mortality (i.e., x%) for the relevant
exposure period. In the case of LC50 values, 50% is a substantial amount of mortality, which
if this were to occur to natural populations could have profound consequences for their
persistence. While it is possible to estimate LCx values that are more protective, e.g., LC5
values, they still represent a concentration where an ecologically relevant effect (mortality) is
occurring. Moreover, any LCx value is representative of the toxicity for a given exposure
period, e.g., 72 hours, and make no estimation of what effect would occur if exposure were
longer, other than longer exposure would have on less of an effect. NEC values are therefore
more meaningful for determining environmental effects than LCx values and is widely
suggested as an improvement to the LCx (Proctor, 2019) at least when the exposure period is
lengthy, and especially when studying biota from cold regions as toxicity test duration should
have a lengthy exposure period, up to 42 days (Proctor, 2019).
NEC vs. LCx comparisons are quite limited in current scientific literature but see (Proctor,
2019). Proctor (2019), similarly with our results, found increased temperature lowered the
LCx value of subantarctic isopod, Limnoria stephenseni when exposed to copper. Like our
results Proctor (2019) also found no/little differences in NEC values (for copper) between
temperatures. She also observed at long exposure periods (~40 days) where LCx values
between temperatures become similar. She hypothesises that this is a result of polar taxa
requiring extended exposure to illicit an acute response as they respond slower to toxicants
than warmer temperature taxa.
When applying the NEC for example a few deaths late in the exposure period (as was the
case with EWSS) it can make a big difference to the precision of the NEC estimate. When the
aim of a toxicity test is to estimate NEC values, exposure periods should be long enough that
there is little or no more mortality at the later time periods (as in the case of EWSS).
Short term and long-term salinity inputs and outputs
In the case of short-term spikes in salinity, as can happen with de-icing salting operations
(Shenton et al. 2021), if the spike is short enough, they will not have time for long term effects
and thus LCx values might be more relevant than NEC values, although this remains to be
13demonstrated, as short-term exposure may result in latent effects which only become apparent
after exposure ceases. However, de-icing salts (as was the focus of these experiments) store in
the land and leach out into streams throughout the entire year, including in our study region
(Shenton et al. 2021, Moulding 2018), so that chronic exposure may well be relevant. The
highest salinity spikes in our study region (and other alpine areas) occurred in winter or early
spring due to de-icing activities (Shenton et al. 2021, Moulding 2018), where water
temperatures are generally low. To determine the long-term effect of salinity at such low water
temperatures requires lengthy experiments. The NEC may be a powerful tool for testing long
term survival of organisms from relatively short-term tests and would provide a more
environmentally sound estimate that can take other variables such as landscape salinity output
into consideration to understand any long-term effects from outputs in summer and autumn.
Conclusion
Our results suggest that when toxicological studies aim to compare the toxicity of different
substances (e.g., salts) or the same substances at different water temperatures, then generally
LCx values are better suited to detect differences in toxicity between the substances than NEC
values. In contrast, for studies that aim to estimate the concentration of a substance which,
with long term exposure, will not produce toxicity, then NEC values will generally be better
because it is independent of time and generally has a lower value than LCx results, producing
more conservative protection for freshwater biodiversity. While NEC values can be
estimated from short duration experiments, more precise estimates of NEC values will be
produced with experiments which last long enough that latter observations are recording little
or no mortality. Where studies aim to estimate LCx values across a range of exposure periods,
then better estimates will generally be obtained using a TKTD model.
We also recommend that de-icing operations consider the toxicity of the salts that they are
using and not analytical grade salts, as we observed considerable variability between the
toxicity of NaCl dominated salts. Careful selection of salts with relatively less toxicity, has
the potential to reduce the environmental harm of de-icing salts. We propose that the least
toxic salts were RMS CaCl2 (least toxic by 144-hour LC50 results) and EWSS (least toxic by
NEC). Further investigation is required, however, to consider toxicity to other species, sub-
lethal toxicity and effects of de-icing salts in natural or semi-natural (e.g., mesocosms)
system where multiple species are interacting (Clements and Kotalik 2016; Bray et al. 2018).
It is highly plausible that such studies could find the effect of de-icing salts at lower
concentrations than the concentrations we observed mortality in one species, under single
species laboratory test conditions.
Acknowledgments
We thank the Australian Alps national parks Cooperative Management Program for funding,
from which Shenton and Moulding received scholarships. Many thanks to the volunteers that
helped with collections for these experiments, Callum Mckinnon, Kaylin de Lembracht,
Brian Johnston and Hannah Moulding. Thank you to staff from NSW RMS and Perisher for
supplying salt samples and salt application information. The research reported was conducted
under a Scientific Licence (no. SL101713) from the NSW Parks and Wildlife Service.
14References
Blasius, B. J., & Merritt, R. W. (2002). Field and laboratory investigations on the effects of
road salt (NaCl) on stream macroinvertebrate communities. Environmental Pollution, 120(2),
219-231.Cañedo-Argüelles, M., et al. 2016 "Saving freshwater from salts." Science
351(6276): 9.
Bray, J.P., Reich, J., Nichols, S.J., Kon Kam King, G., Mac Nally, R., Thompson, R.,
O'Reilly-Nugent, A. and Kefford, B.J., 2019. Biological interactions mediate context and
species-specific sensitivities to salinity. Philosophical Transactions of the Royal Society B,
374(1764), p.20180020.
Cañedo Argüelles, M., et al. 2013 "Salinisation of rivers: an urgent ecological issue."
Environmental Pollution 173: 157-1674-916.
Clements, W.H. and Kotalik, C., 2016. Effects of major ions on natural benthic communities:
an experimental assessment of the US Environmental Protection Agency aquatic life
benchmark for conductivity. Freshwater Science, 35(1), pp.126-138.
Delignette-Muller, M.L., Ruiz, P. and Veber, P., 2017. Robust fit of toxicokinetic–
toxicodynamic models using prior knowledge contained in the design of survival toxicity
tests. Environmental science & technology, 51(7), pp.4038-4045.
Georg H. Niedrist 2020 Miguel Cañedo-Argüelles & Sophie Cauvy-Fraunié. Salinization of
Alpine rivers during winter months, Environmental Science and Pollution Research.
Jackson, J and Funk, D. 2018 Temperature affects acute mayfly responses to elevated
salinity: implications for toxicity of road de-icing salts
Jager, T., Albert, C., Preuss, T. G., & Ashauer, R. (2011). General unified threshold model of
survival—A toxicokinetic-toxicodynamic framework for ecotoxicology. Environmental
Science and Technology, 45(7), 2529–2540.
Johnson, B.R., Weaver, P.C., Nietch, C.T., Lazorchak, J.M., Struewing, K.A. and Funk,
D.H., 2015. Elevated major ion concentrations inhibit larval mayfly growth and development.
Environmental Toxicology and Chemistry, 34(1), pp.167-172.
Kon Kam King, G., Delignette-Muller, M.L., Kefford, B.J., Piscart, C. and Charles, S., 2015.
Constructing time-resolved species sensitivity distributions using a hierarchical toxico-
dynamic model. Environmental science & technology, 49(20), pp.12465-12473.
Macaulay, S.J., Buchwalter, D.B. and Matthaei, C.D., 2020. Water temperature interacts with
the insecticide imidacloprid to alter acute lethal and sublethal toxicity to mayfly larvae. New
Zealand Journal of Marine and Freshwater Research, 54(1), pp.115-130.
Mount, D.R., Gulley, D.D., Hockett, J.R., Garrison, T.D. and Evans, J.M., 1997. Statistical
models to predict the toxicity of major ions to Ceriodaphnia dubia, Daphnia magna and
Pimephales promelas (fathead minnows). Environmental Toxicology and Chemistry: An
International Journal, 16(10), pp.2009-2019.
15Mount, D.R., Erickson, R.J., Forsman, B.B., Highland, T.L., Hockett, J.R., Hoff, D.J.,
Jenson, C.T. and Norberg‐King, T.J., 2019. Chronic toxicity of major ion salts and their
mixtures to Ceriodaphnia dubia. Environmental toxicology and chemistry, 38(4), pp.769-783.
Moulding, B J.G., 2018. The Salinity Sensitivity of Stream Invertebrates in Australian Alpine
Rivers. Honours Thesis, University of Canberra
Niedrist, G.H., Cañedo-Argüelles, M. and Cauvy-Fraunié, S., 2021. Salinization of Alpine
rivers during winter months. Environmental Science and Pollution Research, 28(6), pp.7295-
7306.
Orr, S.E. and Buchwalter, D.B., 2020. It’s all about the fluxes: temperature influences ion
transport and toxicity in aquatic insects. Aquatic Toxicology, 221, p.105405.
Sauer, F. G., et al. 2016. "Effects of salinity on leaf breakdown: Dryland salinity versus
salinity from a coalmine." Aquatic Toxicology 177: 425-432.
Proctor, AH 2019, 'Improvements in ecotoxicological analysis methods for the derivation of
environmental quality guidelines: a case study using Antarctic toxicity data', PhD thesis,
University of Tasmania.
Ritz, C., Baty, F., Streibig, J.C. and Gerhard, D., 2015. Dose-response analysis using R. PloS
one, 10(12), p.e0146021.
Sanzo, D. and Hecnar, S.J., 2006. Effects of road de-icing salt (NaCl) on larval wood frogs
(Rana sylvatica). Environmental pollution, 140(2), pp.247-256.
Shenton, M.D., Nichols, S.J., Bray, J.P., Moulding, B.J.G. and Kefford, B.J., 2021. The
Effects of Road De-icing Salts on Water Quality and Macroinvertebrates in Australian Alpine
Areas. Archives of Environmental Contamination and Toxicology, pp.1-15.
Stefania, G., Lucaciu, I. and Grumaz, R., 2010. Microbiotests versus conventional toxicity
tests. International Multidisciplinary Scientific GeoConference: SGEM, 2, p.669.
Sutcliffe, D. W. 1984. "Quantitative aspects of oxygen uptake by Gammarus (Crustacea,
Amphipoda) a critical review." Freshwater Biology 14: 443-489.
Verberk, W. C., et al. (2020). "Energetics as a lens to understanding aquatic insect's
responses to changing temperature, dissolved oxygen and salinity regimes." Current opinion
in insect science
Website used for species identification
https://www.mdfrc.org.au/bugguide/display.asp?type=5&class=17&subclass=&Order=6&fa
mily=44&couplet=0 search “Colobruscoides”
1617
You can also read