Assessment of river mouth variability after jetty and groyne construction: A case study of the Volta River mouth, Ghana
←
→
Page content transcription
If your browser does not render page correctly, please read the page content below
東北地域災害科学研究          第58巻(2022)                                                                          111

Assessment of river mouth variability after jetty and groyne construction: A
                case study of the Volta River mouth, Ghana

Stephan Korblah Lawson1, Hitoshi Tanaka2, Keiko Udo3, Nguyen Trong Hiep4, and Nguyen Xuan
                                           Tinh5
Abstract
        The response of the Volta River mouth to the construction of a jetty and groyne system was
studied using satellite images from Landsat and Sentinel-2. Prior to the construction of these coastal
structures, the river mouth sandspits exhibited a cyclic morphological pattern which included sandspit
elongation, spit breaching and deposition of the breached updrift spit onto the downdrift beach. However,
a new morphological regime has been observed at the river mouth. Results from the image analysis has
shown that, intrusion of the sandspit into the estuary, development of offshore shoals, accretion and
erosion of the sandspits due to an alteration of the sediment budget are some morphological changes that
have occurred at the river mouth.
Keywords: Coastal structures, river mouth, sandspit, satellite image analysis, Volta River mouth.
1. INTRODUCTION
         In many coastal regions, jetties and groyne systems have been utilized in beach stabilization and
flood related projects. These coastal structures also facilitate tidal exchange and channel navigation
especially at river mouths or inlets. In the design phase of these projects, several attempts are made to
predict the interactions of these structures with prevailing hydrodynamic conditions. In most cases,
unforeseen alterations are observed at such locations. One of such cases is the construction of the Pranburi
Jetties in Thailand. A study by Phanomphongphaisarn et al. (2020) showed that the post construction
period disagreed with the simulations in the design phase of the project which resulted in the construction
of three detached breakwaters north of the jetty. This was done through the use of satellite images.
Another study by Tanaka & Lee (2003), at the Shiribetsu River mouth in Japan revealed a decrease in
wave set-up after a jetty was constructed.
        The Volta River mouth was chosen for the study mainly because of the presence of a jetty on the
western side of the river mouth. Also present on this side of the river mouth is a groyne system which
covers a 16 km stretch with each groyne spaced at 800 m. These structures were constructed as part of
the Ada Sea Defence Project (ASDP) from 2012 – 2016. The project was aimed at controlling the severe
beach erosion, restricting the growth of the updrift sandspit, improve tidal exchange and navigation
(Mensah & FitzGibbon, 2013).
2. STUDY AREA AND ENVRIONMENT
        The Volta River mouth is situated at Ada-Foah on the eastern coast of Ghana, West Africa (Figure
1). The river drainage area is approximately 400,000 km2 which is made up of catchment areas within
Mali, Burkina Faso, Ivory Coast, Ghana, Togo and Benin. Several hydro-electric and irrigation dams
have been constructed on the Volta River network. The Akosombo and Kpong dams are the closest dams
located upstream of the river mouth which have affected the flow rate and fluvial sediment supply to the
river mouth. Prior to dam construction, mean monthly flow rates over 4000 m3/s were recorded and this
subsequently reduced to about 2000 m3/s after dam construction. A study by Amenuvor et al. (2020)
indicates the reduction of the annual fluvial sediment supply from 180×106 to 13×106 m3/year due to dam
operations.
           The coastal zone around the river mouth is marked by a micro-tidal environment with tides being
semi-diurnal. The average tidal range is 1m with spring tides at 1.28m and neap tides at 0.64m (Allersma
1,2,4,5
        Department of Civil and Environmental Engineering, Tohoku University, 6-6-06 Aoba, Sendai
980-8579, Japan.
3
  International Research Institute of Disaster Science, Tohoku University, 468-1 Aoba, Sendai 980-8572,
Japan.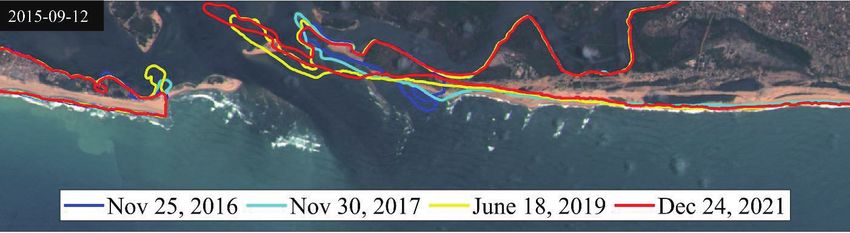
112

& Tilmans, 1993). The significant wave heights along the river mouth ranges from 0.5 to 3.30 m based
on wave data retrieved from the WaveWatch III model. The dominant wave direction is southwest from
swells generated in the Atlantic Ocean. In addition, the West African Monsoon affects the wave heights,
with the largest wave heights generated from March-October. The induced longshore currents along this
coast is unidirectional from the west to east and the average longshore sediment transport at the Volta
River mouth is about 1.25 ×10⁶ m3/year as determined by sandspit and wave analysis (Lawson et al.,
2021).

                     Figure 1. Map of the Volta River mouth at Ada-Foah, Ghana.

3. MATERIALS AND METHODS
3.1 Data Collection and Shoreline Extraction
         The primary dataset used in this study were satellite images retrieved from the Google Earth
Engine repository. These included images from Landsat 5 (TM), Landsat 7 (EMT+), Landsat 8 (OLI) and
Sentinel-2 (MSI). The image collection period for the study extended from March, 2002 to July, 2021.
This was chosen due to the significant morphological evolutions observed at the river mouth before and
after the completion of the ASDP.
         The shorelines for the study area were extracted using the Coastsat toolkit (Vos et al., 2019). The
toolkit uses a supervised image classification and a sub-pixel resolution border segmentation to extract
shorelines with a horizontal accuracy of 10m (Vos et al., 2019). The image classification stage enables
the definition of the sand, water, white-water and other land features whereas the sub-pixel segmentation
stage uses the Modified Normalized Water Index (MNDWI) to categorize the water and land pixels. The
shoreline is then defined using Otsu’s thresholding and the Marching Squares algorithms.
3.2 River Mouth Variability Analysis
        To ascertain the river mouth variability before and after the construction of the jetty and groyne
system, the river mouth sandspits were divided into three sectors. These included Sector 1 on the updrift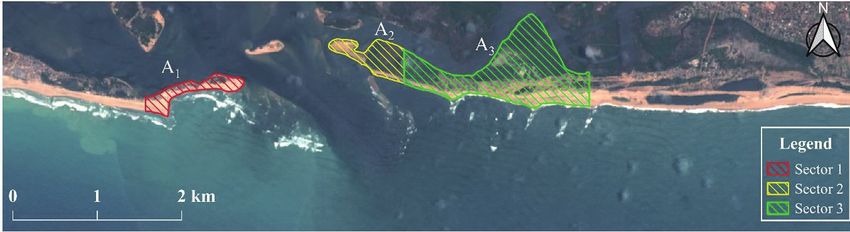
113

sandspit (red), Sectors 2 (yellow) and 3 (green) on the downdrift sandspit (Figure 2). Furthermore, the
sandspit areas for each sector was estimated for the study period to depict accretion and erosion trends at
the river mouth. For this analysis, the areas for Sector 1, 2 and 3 were denoted as A1, A2 and A3,
respectively (Figure 2).

          Figure 2. Definition of the three sectors used in the river mouth variability analysis.

4. RESULTS AND DISCUSSIONS
4.1 River Mouth Morphological Change
         Within the study period, a number of morphological changes were observed at the Volta River
mouth from the collected satellite images. The jetty at the river mouth was constructed with the purpose
of halting the lateral migration of the updrift sandspit from the west to the east (Figures 3a and 3b). This
resulted in an increase in the width of the river mouth which facilitated an efficient tidal exchange and
channel navigation. In the years following the construction of the jetty, there has been the frequent
formation of offshore shoals which could be attributed to changes in the water depth at the river mouth
and wave breaking. These shoals move landward and attach to the downdrift sandspit which led to a
reduction in the width of the river mouth (Figures 3c to 3e). In addition to this, the landward growth of
the updrift sandspit is observed (Figure 3c to 3e). This phenomenon has manifested in the intrusion of
both sandspits into the estuary (Figure 4). A more recent development at the river mouth is the multiple
breaching of the sandspits which has led to widening of the river mouth (Figure 3f). These distinct
changes at the river mouth give an indication of the river mouth’s response to alterations in the sediment
budget at the river mouth by the ASDP.

  Figure 3. Satellite images showing the various morphological evolutions at the Volta River mouth
                                           (2002 – 2021).
114
Figure 4. Shoreline variation of the Volta River mouth (2016 – 2021).
4.2 Variation of Sandspit Area
By plotting the sandspit area for the three defined sectors of the river mouth, the accretion and
erosion trends can be assessed. Figure 5 shows the time variation plot of the sandspit area for Sector 1.
Regression analysis for this sector after the jetty and groyne construction shows a sandspit area change
rate of 1.3×10⁴ m2/year from 2016 to 2020. The increment in sandspit area within this period is as a result
of the intrusion of the updrift spit into the estuary induced by sediment bypassing the jetty and the action
of breaking waves.
Figure 5. Updrift sandspit area variation for Sector 1.
With respect to Sector 2 on the downdrift spit, the regression analysis revealed an area change
rate of 4.1×10⁴ m2/year from 2013 to 2019 (Figure 6). This gain in sandspit area was mainly due to the
attachment of the offshore shoals to this section of the downdrift sandspit. Sector 3 on the other hand
shows the exact opposite of both Sectors 1 and 2. The analysis showed a sandspit area change rate of -
6.4×10⁴ m2/year from 2013 to 2021 for Sector 3 (Figure 7). This corresponds to the shoreline retreat
observed in Figure 4 for this sector of the river mouth. Table 1 shows a summary of the sandspit area
change rate for the three sectors of the river mouth.115
Figure 6. Downdrift sandspit area variation for Sector 2.
Figure 7. Downdrift sandspit area variation for Sector 3.
Table 1. Summary of sandspit area change rates for the three defined sectors.
Sector Sandspit area change Remarks
rate (m2/year)
1 1.3×10⁴ Spit intrusion
4
2 4.1×10 Spit intrusion
4
3 -6.4×10 Erosion116
4. CONCLUSION
From this study, the variability of the Volta River mouth has been investigated after the
construction of a jetty and groyne system. The study employed the use of remotely sensed images from
2002 to 2021. The results of the study for three sectors of the river mouth showed that while the sandspit
area for two sectors showed a positive trend (spit intrusion), the third sector was characterized by a
negative trend (erosion). Furthermore, the findings from the image analysis is unable to determine if the
jetty and the groyne system are the main cause of erosion on the third sector since chronic erosion along
this section of the of the river mouth has been an existing predicament. As such, further analysis would
be required to properly understand the variability of the river mouth through the use of advanced
numerical models. The results from the image analysis in this study could serve as a basis for conducting
such future studies.
REFERENCES
Allersma, E., & Tilmans, W. M. K. (1993). Coastal conditions in West Africa-A review. Ocean and
Coastal Management, 19(3), 199–240.
Amenuvor, M., Gao, W., Li, D., & Shao, D. (2020). Effects of Dam Regulation on the Hydrological
Alteration and Morphological Evolution of the Volta River Delta. Water, 12(3), 646.
Lawson, S. K., Tanaka, H., Udo, K., Hiep, N. T., & Tinh, N. X. (2021). Morphodynamics and
Evolution of Estuarine Sandspits along the Bight of Benin Coast, West Africa. Water, 13(21),
2977.
Mensah, K. O., & FitzGibbon, J. (2013). Responsiveness of Ada Sea Defence Project to salt water
intrusion associated with sea level rise. Journal of Coastal Conservation, 17(1), 75–84.
Phanomphongphaisarn, N., Rukvichai, C., & Bidorn, B. (2020). Impacts of long jetties construction on
shoreline change at the western coast of the gulf of Thailand. Engineering Journal, 24(4), 1–17.
Tanaka, H., & Lee, H. S. (2003). Influence of jetty construction on morphology and wave set-up at a
river mouth. Coastal Engineering Journal, 45(4), 659–683.
Vos, K., Splinter, K. D., Harley, M. D., Simmons, J. A., & Turner, I. L. (2019). CoastSat: A Google
Earth Engine-enabled Python toolkit to extract shorelines from publicly available satellite
imagery. Environmental Modelling & Software, 122, 104528.You can also read