Associations of indoor carbon dioxide concentrations, air temperature and humidity with perceived air quality and sick building syndrome symptoms ...
←
→
Page content transcription
If your browser does not render page correctly, please read the page content below
Hou, J., Sun, Y., Dai, X., Liu, J., Shen, X., Tan, H., Yin, H., Huang, K., Gao, Y., Lai, D.,
    Hong, W., Zhai., X., Norbäck, D., and Chen, Q. 2021. “Associations of indoor carbon
    dioxide concentrations, air temperature and humidity with perceived air quality and sick
    building syndrome symptoms in Chinese homes,” Indoor Air, DOI: 10.1111/ina.12810.

       Associations of indoor carbon dioxide concentrations, air
     temperature and humidity with perceived air quality and sick
              building syndrome symptoms in Chinese homes

     Jing Hou1, Yuexia Sun1,*, Xilei Dai1, Junjie Liu1, Xiong Shen1, Hongwei Tan2,
Haiguo Yin3, Kailiang Huang4, Yao Gao5, Dayi Lai1,6, Weiping Hong1, Xinping Zhai3,
                          Dan Norbäck7, Qingyan Chen8

1
  Tianjin Key Lab. of Indoor Air Environmental Quality Control, School of
Environmental Science and Engineering, Tianjin University, Tianjin, China 300350
2
  School of Mechanical Engineering, Tongji University, Siping Road 1239, Shanghai,
China 200092
3
  School of Building Services Science and Engineering, Xi’an University of
Architecture and Technology, Xi’an, Shaanxi, China 710055
4
  Department of Municipal and Environmental Engineering, Shenyang Jianzhu
University, Shenyang, China 110168
5
  Shenzhen Institute of Building Research Co., Ltd., Shenzhen, China 518049
6
  Department of Architecture, School of Design, Shanghai Jiao Tong University,
Shanghai, China 200240
7
  Department of Medical Sciences, Uppsala University and University Hospital, SE-751
85 Uppsala, Sweden
8
  School of Mechanical Engineering, Purdue University, West Lafayette, IN 47907,
USA

*
    Corresponding email: yuexiasun@tju.edu.cn

Practical implications
The findings of this study indicate the importance of indoor air humidity on perceived
indoor air quality and SBS symptoms. We found a high indoor CO2 concentration
weakened the benefit of high humidity for skin SBS symptoms. Ventilation and
humidity should be both considered in creating a proper home environment.

Abstract
The indoor environment is important for occupants’ health. From March 1st, 2018 to
February 28th, 2019, we continuously monitored indoor temperature (T), relative
humidity (RH) and CO2 concentration in bedrooms via an online system in 165
                                                 1
residences that covered all five climate zones of China. Meanwhile, we asked one
specific occupant in each home to complete questionnaires about perceived air quality
and sick building syndrome (SBS) symptoms at the end of each month. Higher CO2
concentration was significantly associated with a higher percentage of perceived stuffy
odor and skin SBS symptoms. Higher relative humidity was associated with higher
percentage of perceived moldy odor and humid air, while lower RH was associated with
a higher percentage of perceived dry air. Occupants who lived in residences with high
RH were less likely to have mucosal and skin SBS symptoms (adjusted odds ratio
(AOR): 0.73-0.78). However, the benefit of high humidity for perceived dry air and
skin dryness symptoms would likely be weaker if there is a high CO2 concentration
level.
Keywords Sick building syndrome; Home; CO2; Odors; Relative humidity; Perceived
dry air
1 Introduction
Since the 1970s, building construction has utilized energy conservation measures such
as reduced air exchange that commonly led to building-associated illness. In China, air
change rates in residential buildings are generally low, especially in the north.1,2 Low
air change rates mean high concentrations of indoor generated pollutants. Indoor
pollutants, for example, bioaerosols, volatile organic compounds and molds, are
associated with increased risk of a suite of symptoms called sick building syndrome
(SBS)3-6. Since WHO first reported on SBS in 1983,5 a large number of SBS studies
have been conducted to investigate SBS symptoms and their relationships with indoor
environmental factors.7-10 Since people spend most of their time at home,11-13 the
influence of the home environment on SBS should be further investigated. In China,
several studies of SBS have recently been performed.4,14-17 The CCHH (China, Children,
Homes, Health) study in Tianjin (a city in northeast China) reported that 14% of parents
have weekly general symptoms and 11% and 9% have weekly mucosal symptoms and
skin symptoms, respectively.18 The prevalences of weekly general symptoms, mucosal
symptoms and skin symptoms were 4.2-14.6%, 3.2-4.8% and 4.3%, respectively, in
Changsha (a city in central China) from the same study (CCHH study);16 and 13.5%,
8.5% and 5.2%, respectively, in Chongqing (a city in southwest China).14 Differences
in home environments and climate among different areas in China are related to
differences in prevalence of SBS. However, few studies on national investigation of
home environmental-related SBS symptoms exist.
Compared with evoking SBS symptoms, odors of some indoor pollutants can often be
detected at lower concentrations.19,20 Therefore, perception of odors is the primary
discriminant of indoor air quality and is often used to evaluate the acceptability of
indoor air.14,21,22 Moreover, perception of odors is associated with occupants’ health
problems.4,14,15,23,24 In homes, odors are mainly from human bio-effluents,
environmental tobacco smoke (ETS), bio-odorants released from fungus or mold,
perfume and cosmetics, and volatile building materials.19,25 Air humidity and
temperature influence the emission characteristics of building materials and affect the
2immediate and longer-term perceived odor.26,27 Fang et al.26 found the air was perceived
as less acceptable with increasing temperature and humidity. However, the issue is
complex because both the air temperature and humidity and pollutant emission
influence the perception of odor.
Indoor air humidity is important with respect to health22 but the association between
perceived humidity and air humidity is not clear because there are no specific sensory
receptors for humidity.28 In contrast, dryness has often been perceived in the presence
of dampness indicators.29.30 Studies have found that an increased air pollution level was
a more important factor for perceived ‘‘dryness’’ than low relative air humidity.31,32
Indoor environmental exposure level in residential buildings is uncertain because in
addition to indoor sourced pollutants it depends on outdoor conditions and the behavior
of building occupants.33 Both indoor pollutants and outdoor conditions change over
time.34.35 However, most studies of indoor environmental exposures used instantaneous
measurements,36 which may not be able to capture and represent the true variability and
may not be representative of actual exposures. A consecutive survey accompanied by
air quality measurements in real indoor space must be performed to characterize the
changes in air quality parameters and the prevalence of SBS.
The present study aimed to investigate 1) the relationship of CO2 concentration,
temperature, humidity with perceived odors and 2) the effect of CO2 concentration,
temperature, humidity on SBS symptoms with long-term (one year) measurements in
Chinese residences in five climate zones.
2 Methods
This study was conducted between March 1, 2018 and February 28, 2019. It was part
of a national investigation of ventilation in residences.1,37,38 We continuously monitored
indoor temperature (T), relative humidity (RH) and carbon dioxide in bedrooms for one
complete year using an online system in 165 residences in 11 representative
provinces/municipalities. These provinces/municipalities cover all five climate zones,
as shown in Figure 1. Table S1 in the supplementary information shows the climatic
characteristics of each of the five climate zones.39 The sample size for each zone was
roughly proportional to the number of families in the zone.40
In this study, indoor temperature, the relative humidity and carbon dioxide were
monitored and recorded every minute using an Ikair environmental monitoring kit,
which has measurement ranges of -40-125 °C for the air temperature, 0-100% for the
relative humidity and 400-10000 ppm for carbon dioxide. The measurement accuracies
for the parameters were ±0.3 °C, ±3% and 70 ppm or ±3% of reading respectively.
Occupants reported perceived odors and humidity, SBS symptoms and personal
demographic information through responses to questionnaires.
3Liaoning (14)
Xinjiang (17)
Beijing&
Tianjin (31)
Shaanxi (18)
Sichuan& Shanghai (18)
Chongqing (16)
Severe cold zone
Cold zone
Mild zone Yunnan (23)
Hot summer and cold winter zone Guangdong&
Hot summer and warm winter zone Guangxi (28)
Fig.1 Sample locations and number of participants in each zone
2.1 Questionnaires
In each month during the investigation period (March 2018-February 2019), a
questionnaire was administrated to one reference person in the household. This
individual was asked to answer questions about the responder’s experience in the
previous month. Supplementary Document “Questionnaire” shows the complete
questionnaire.
Questions about SBS symptoms comprised three groups: general SBS symptoms
(fatigue, heavy head, headache, dizziness, difficulty concentrating), mucosal SBS
symptoms (eye irritation, nose irritation, dry throat, cough), and skin SBS symptoms
(dry facial skin, dry ears, dry hands). Each question had three possible responses: (1)
Yes, often (every week); (2) Yes, sometimes; (3) No, never.
Questions about perceived indoor air qualities were about perceived odor and humidity.
They were: “Have you during the last month been bothered by any of the following
odors in your residence: (1) stuffy odor, (2) unpleasant odor, (3) moldy odor, (4) tobacco
smoke, (5) dry air, (6) humid air?” For each, there were three options for the response
(1) Often; (2) Sometimes; (3) Never.
2.2 Statistical analysis
Daily mean temperature and relative humidity were calculated and involved in data
analysis. While CO2 concentration between 0:00 am to 7:00 am (when homes were
occupied) was summarized to indicate indoor potential sources (i.e., occupants) and
ventilation rate.
In the analysis, answers on SBS symptoms and perceived indoor air quality were
classified into two categories (“No, never”, “Yes, often or sometimes”).
The statistical analyses were performed using STATA 14.0. Odds ratios of indoor
physical parameters for perceived indoor air qualities and SBS symptoms were
4calculated in three-level (climate zone, individual, and time-serial) logistic regression
models with adjustment for gender, age, allergic history and current smoker. Indoor
physical parameters were examined as both a continuous and a categorical variable.
The results are shown as adjusted odds ratios (AORs) with 95% confidence intervals
(CIs). We accepted P-values < 0.05 as statistically significant.
The Research Office at Tianjin University granted ethical approval for this study.
3 Results
A total of 1285 questionnaires from 165 residences in 12 months were returned. The
response rate was 64.9% with small fluctuations across five climate zones. Table 1
shows demographic information. Fig. 2 and Supplementary Table S2 summarize the
proportions of SBS symptoms among participating occupants. The percentage of
general SBS symptoms was the highest (74.0%), followed by mucosal SBS symptom
(65.8%). The highest percentage of general SBS symptom was reported in the cold zone
(78.5%), followed by the severe cold zone (76.2%). The highest percentage of mucosal
SBS symptoms and skin SBS symptoms were both reported for the severe cold zone
(mucosal SBS: 71.4%; skin SBS: 51.6%). Fig. 3 and Supplementary Table S3 show the
proportions of perceived odor and humidity. The most frequently perceived odor was
dry air (47.4%), followed by stuffy odor (46.1%). Supplementary Fig. S2 shows the
proportions of perceived odor and humidity in each climate zone. The highest
percentages of stuffy odor and unpleasant odor were both reported in the cold zone
(stuffy odor: 58.0%; unpleasant odor: 37.5%). The highest percentage of perceived dry
air was reported in the mild zone (63.2%), followed by the severe cold zone (59.1%)
and the cold zone (54.4%). The zones with hot summers reported a higher percentage
of perceived humid air (HSWW: 38.4%; HSCW: 35.5%).
Table 1 Demographic information for participating occupants (n =165).
Items n (%)
Age
20-29 28(17.0)
30-39 78(47.3)
40-49 31(18.8)
50-59 25(15.1)
60-69 2(1.2)
No information 1(0.6)
Gender
Male 72(43.6)
Female 93(56.4)
Allergic history
Yes 60(36.4)
No 105(63.6)
Current smoker
Yes 21(12.7)
No 144(87.3)
5No SC C M HSCW HSWW All
Yes 100
80
Percentage
60
General SBS
40
20
0
100
80
Percentage
60
Mucosal SBS
40
20
0
100
80
Percentage
60
Skin SBS
40
20
0
A r.
Ju .
O p.
b.
A r.
Ju .
O p.
b.
M pr.
Juy.
Se .
D v.
M pr.
Juy.
Se .
D v.
A l.
N ct .
A l.
N ct .
J a c.
Fen.
J a c.
Fen.
J .
O p.
b.
A r.
M pr.
Ju .
Se .
D v.
A ul.
N ct.
J a c.
Fen.
n
n
ug
ug
A r.
J .
O p.
M.
A r.
Ju .
O p.
b.
M pr.
Ju .
Seg.
D v.
M pr.
Juy.
Se .
D v.
A ul.
N ct.
A l.
N ct.
J a c.
Fen.
J a c.
Fen.
n
ay
ug
Ju .
O p.
b.
b
A r.
M r.
Juy.
ay
n
n
A l.
Se .
D v.
ug
N ct.
J a c.
Fen.
a
a
e
e
o
o
a
a
a
n
ug
a
a
e
o
e
u
o
o
e
M
a
p
a
M
a
e
o
M
M
M
2018 2019 2018 2019 2018 2019 2018 2019 2018 2019 2018 2019
Fig. 2 Proportions of sick building syndrome (SBS) symptoms in each month among
all the participating occupants. (General SBS: at least one general SBS symptom e.g.
fatigue, heavy head, headache, dizziness, concentration difficulty. Mucosal SBS: at
least one mucosal SBS symptom e.g. eye irritation, nose irritation, throat hoarse, cough.
Skin SBS: at least one skin SBS symptom e.g. dry facial skin, itchy ears, dry hands.
SC: severe cold zone; C: cold zone; M; mild zone; HSCW: hot summer and cold winter
zone; HSWW: hot summer and warm winter.)
6Stuffy odor Moldy odor Unpleasant odor
100
No
80 Yes
60
40
20
Percentage
0
Smoke odor Dry air Humid air
100
80
60
40
20
0
A .
M .
Ju .
n.
A l.
Se .
O .
D .
n.
b.
A .
M r.
.
n.
A l.
Se .
O .
D .
Fe .
A l.
b.
A .
M r.
.
n.
Se .
O .
D .
n.
b.
N .
.
N .
.
N .
.
ug
ov
ar
ec
ug
ov
ec
ug
ov
ec
pr
ar
ct
ct
ar
ct
ay
p
ay
p
n
ay
p
Ju
Ju
Ju
p
p
Ju
Ja
Fe
Ja
Ju
Ja
Fe
M
M
M
2018 2019 2018 2019 2018 2019
Fig. 3 Proportions of perceived odor and humidity in each month among all the
participating occupants.
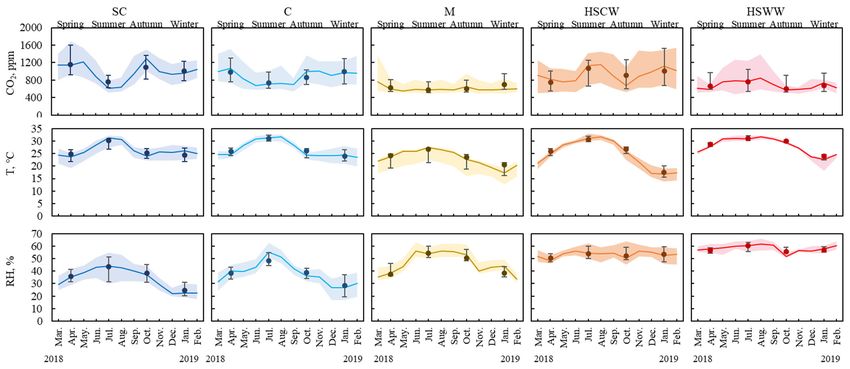
In the participating homes, median value of CO2, T and RH were 813 ppm, 25.6 ºC and
46.7%, respectively. Indoor temperature in each climate zone trended with outdoor
temperature (Supplementary Table S1). However, indoor temperatures in northern
China (severe cold zone and cold zone) (median: 23.5-26.1 ºC) were higher than in
southern China (median: 16.8-27.2 ºC) during heating season (November to March)
(Fig. 4), due to district heating systems used in northern China. The mild zone had
relatively constant and mild indoor temperatures (median: 17.3-27.4 ºC). The CO2
concentration in the mild zone was also relatively constant and low (median: 552-767
ppm). In the severe cold and the cold climate zones, CO2 concentration was high in
winter (median: 914-1141 ppm) and low in summer (median: 610-891 ppm). It is
interesting to find that in the south China with hot summer zone, CO2 concentration
was also high in summer (median: 773-1159 ppm). This may be due to occupants’ use
of air conditioning. Median RH varied from 22.2-61.6% in the five climate zones (Fig.
4). The hot summer and warm winter zone had the highest RH (51.9-61.6%) and the
severe cold zone had the lowest RH (22.2-43.9%). RH in the severe cold zone, the cold
zone and the mild zone changed with the seasons, i.e., it was higher in summer and
lower in winter.
7Fig.4 Monthly and seasonal average CO2 concentration (0:00-7:00), indoor temperature
(T, 24 hours) and related humidity (RH, 24 hours) in 165 Chinese homes (SC: severe
cold zone, N=31; C: cold zone, N=49; M; mild zone, N=23; HSCW: hot summer and
cold winter zone, N=34; HSWW: hot summer and warm winter, N=28. The lines are
median values of monthly average values in homes and the colored regions represent
the interquartile range of monthly average values in homes. The dots are median values
of seasonal average values in homes and the error bars represent the interquartile range
of seasonal average values in homes)
Table 2 shows the associations of SBS symptoms with age, gender, current smoker and
allergic history. “Older” was a risk factor for general SBS symptoms. Allergic history
was significantly associated with increases in SBS symptoms. Table 3 shows the
associations of perceived odor and humidity with age, gender, current smoker and
allergic history. Female gender was significantly associated with higher perceived
stuffy odor.
Table 2 Odds ratios (95% confidence interval)a of personal variables for sick building
syndrome (SBS) symptoms in three-level (climate zone-individual-time serial) logistic
regression analyses (n=1285)
One general SBS One mucosal SBS One skin SBS
b c
symptom symptom symptomd
e
Gender 2.15(0.93,4.93) 0.79(0.38,1.66) 1.39(0.67,2.88)
Agef 1.60(1.04,2.46)* 1.30(0.90,1.89) 1.37(0.95,1.97)
Allergic historyg 1.43(0.85,2.39) 3.66(2.21,6.05)*** 3.51(2.17,5.66)***
h
Current smoker 0.52(0.21,1.24) 1.61(0.67,3.88) 0.44(0.18,1.09)
a
***: P(often/sometimes) vs. none.
d
At least one skin SBS symptom e.g. dry facial skin, itchy ears, dry hands: yes (often/sometimes)
vs. none.
e
Male (reference) vs. female.
f
Age was divided into five groups: 20-29 years old, 30-39 years old, 40-49 years old, 50-59
years old and 60-69 years old.
g
No allergic history (reference) vs. allergic history.
h
Non-current smoker vs. current smoker.
Table 3 Odds ratios (95% confidence interval) a of personal variables for perceived odor and
humidity in three-level (climate zone-individual-time serial) logistic regression analyses
(n=1285)
Stuffy odor Moldy odor Unpleasant odor Dry air Humid air
b * *
Gender 2.36(1.16,4.79) 0.49(0.18,1.33) 2.16(1.02,4.57) 1.51(0.90,2.52) 1.15(0.67,1.97)
c
Age 0.96(0.66,1.39) 0.67(0.40,1.13) 0.90(0.62,1.31) 1.09(0.84,1.42) 1.13(0.85,1.49)
Allergic historyd 1.10(0.69,1.76) 0.88(0.43,1.78) 1.31(0.79,2.19) 1.19(0.81,1.76) 1.00(0.64,1.56)
e
Current smoker 0.55(0.22,1.36) 0.63(0.16,2.57) 0.35(0.12,1.05) 0.70(0.34,1.43) 0.62(0.28,1.39)
a
***: P1.35(1.02,1.79) 0.51(0.43,0.61) 1.57(1.28,1.92)
RH (per 10%) 0.92(0.78,1.09) *
0.92(0.77,1.10) *** ***
a
Adjusted for age, gender, allergic history and current smoker. ***: PFig.5 Adjusted odds ratios of relative humidity (RH) for perceived dry air in three-
level (climate zone-individual-time serial) logistic regression analyses in two CO2
concentration ranges (adjusted for age, gender, allergic history and current smoker)
Table 6 shows associations of SBS symptoms with indoor T, RH and CO2 concentration.
CO2 concentration was associated with increased general SBS and skin SBS symptoms,
but not significantly. Higher RH was significantly associated with reduced mucosal
SBS symptoms and skin SBS symptoms. Table 7 shows adjusted odds ratios of T, RH
and CO2 concentration with inter-quartile values for SBS symptoms. Adjusted odds
ratios of mucosal SBS symptoms and skin SBS symptoms were lower for higher RH.
In the rooms with high CO2 concentration, the AORs of RH for general and skin SBS
symptoms was higher than in low CO2 rooms (Fig. 6), which means the protective effect
of higher RH was stronger in low level CO2 concentration rooms.
Table 6 Adjusted odds ratios (95% confidence interval)a of CO2 (average during 0:00-
7:00), temperature (T, 24 hours) and relative humidity (RH, 24 hours) for sick
building syndrome (SBS) symptoms in three-level (climate zone-individual-time
serial) logistic regression analyses (n=1143b)
One general SBS One mucosal SBS One skin SBS
symptomc symptomd symptome
CO2 (per 100 ppm) 1.02(0.97,1.07) 1.00(0.96,1.04) 1.03(0.99,1.08)
T (per 1 ºC) 1.03(0.99,1.07) 0.99(0.95,1.03) 0.94(0.90,0.98)**
**
RH (per 10%) 0.96(0.80,1.14) 0.78(0.65,0.93) 0.73(0.62,0.87) ***
a
Adjusted for age, gender, allergic history and current smoker. ***Pvs. none.
Table 7 Adjusted odds ratios (95% confidence interval)a of CO2 (average during 0:00-
7:00), temperature (T, 24 hours) and relative humidity (RH, 24 hours) with inter-
quartile values for sick building syndrome (SBS) symptoms in three-level (climate
zone-individual-time serial) logistic regression analyses (n=1143b)
One general SBS One mucosal One skin SBS
symptomc SBS symptomd symptome
CO2
1st quartile (438-587 ppm) 1 1 1
2nd quartile (587-813 ppm) 1.41(0.74,2.69) 0.78(0.42,1.43) 1.78(0.96,3.29)
3rd quartile (813-1200 ppm) 0.66(0.30,1.43) 1.12(0.58,2.16) 2.71(1.16,6.35)*
4th quartile (1200-3904 ppm) 0.97(0.43,2.18) 0.94(0.44,2.01) 1.58(0.77,3.25)
T
1st quartile (7.1-21.7 ºC) 1 1 1
2nd quartile (21.7-25.6 ºC) 1.66(0.94,2.92) 1.11(0.59,2.09) 0.90(0.52,1.57)
3rd quartile (25.6-28.9 ºC) 1.98(0.96,4.09) 0.80(0.42,1.54) 0.58(0.29,1.18)
4th quartile (28.9-37.2 ºC) 1.20(0.61,2.33) 1.10(0.57,2.10) 0.53(0.27,1.01)
RH
1st quartile (10.9-35.2%) 1 1 1
2nd quartile (35.2-46.7%) 1.19(0.66,2.13) 0.66(0.36,1.21) 0.84(0.50,1.42)
0.36(0.18,0.70)*
3rd quartile (46.7-55.3%) 0.95(0.51,1.77) * 0.36(0.19,0.69)**
4th quartile (55.3-80.4%) 0.74(0.35,1.58) 0.53(0.22,1.27) 0.48(0.23,1.01)
a
Adjusted for age, gender, allergic history and current smoker. ***PFig.6 Adjusted odds ratios of temperature (T, 24 hours), relative humidity (RH, 24
hours) for sick building syndrome (SBS) symptoms in three-level (climate zone-
individual-time serial) logistic regression analyses in two CO2 concentration ranges
(adjusted for age, gender, allergic history and current smoker)
134. Discussion
This survey was conducted in all five of China’s climates zones. In this study, indoor
environment was subjectively and objectively evaluated by questionnaire and long-
term (1-year) real time monitoring in the surveyed homes. We found associations
between indoor environmental factors and SBS.
General SBS symptoms were the most prevalent, followed by mucosal SBS symptoms.
Skin SBS symptoms were the least prevalent. These are consistent with other Chinese
studies, for example, in Tianjin,4,18 and in Chongqing.14
Occupants with allergic history reported more SBS symptoms. Norbäck and Edling41
found that subjects who were prone to infections reported more SBS symptoms. In other
studies, both a history of allergic disorder and a history of atopy have been shown to be
risk factors for SBS symptoms.42-45 This is likely because an SBS symptom can be
caused by different mechanisms, including airway infections, inflammations and
allergic reactions.46 With regards to perceived odor and humidity, more reports by
occupants with a history of asthma, rhinitis and eczema suggest that symptomatic
people may be more sensitive to the indoor environment and/or more prone to report
poor indoor environment.47
Our results demonstrated associations between perceived and measured indoor air
quality. Perceived stuffy odor was associated with higher CO2 concentration. Perceived
moldy odor and humid air were associated with higher RH, while perceived dry air was
associated with low RH.. There have been different views about perceived “dry air”.
Some intervention studies have shown that an increase of RH may alleviate the
perceived dry air.48-50 Others, however, have shown that perceived dry air is not
necessarily associated with the actual air humidity.51 Instead, perceived dry air can
indicate the presence of air pollutants.52 It has been suggested that air pollution is a
more important determining factor for the sensation of dryness than low RH.7,27 In our
study, perceived dry air was associated with higher CO2 concentration. In addition, the
protective effect of higher RH on perceived dry air was weaker in rooms with high CO2
concentration. This observation suggests a modifying effect of CO2 concentration, a
proxy for ventilation,53 for the relation of RH to perceived dry air. This may be because
a lack of ventilation increases air pollution, which in turn decreases the ability of high
RH to decrease perceived dry air.
In this study, we found RH was a significant risk factor for SBS symptoms, especially
for mucosal SBS symptoms and skin SBS symptoms. Different air humidity will alter
mucous viscosity and mucociliary activity.54 Mucosal function depends strongly on the
humidity and heat of the inhaled air.54 Exposure to low RH aggravates eye tear film
stability, resulting in desiccation, hyperosmolarity and inflammatory reactions in the
eye.55 Studies of epidemiology, clinical studies, and experiments on human exposure
have indicated that low RH plays an important role in the increase of SBS
symptoms.56,57 Increase of bedroom RH has been proposed to have a beneficial effect.58
However, high RH may increase the emission of volatile organic compounds (VOCs)
from building materials.59-63 Moreover, in indoor environments with high humidity, the
presence of mold and house dust mites is higher.64 The protection of high RH for
mucosal SBS symptoms in our study may be because concentrations of VOCs in
14residential environments, in general, are orders of magnitude below thresholds for sensory irritation in the eyes and airways, from a toxicological point of view.65 Our findings support both the effect of indoor humidity on SBS symptoms, as well as the effect of indoor pollutants. In a room with high CO2 concentration, which indicted a more pollutant indoor environment, the benefits of high RH for skin SBS symptoms are less (See Fig. 6). Unfortunately, indoor pollutants, for example, formaldehyde, VOCs, particulate matter, were not measured simultaneously with these physical parameters (such as RH and CO2 concentrations). Further sophisticated studies are needed to elucidate the combined effects of RH and CO2 on SBS symptoms. Previous studies suggest that the risk of SBS continued to decrease with CO2 decreasing below 800 ppm in offices and schools.66 However, in this study, high CO2 concentration is not a very strong risk factor for SBS except for skin symptoms. CO2 in residences is mainly generated by human beings and related to the number of occupants. By itself, CO2 does not have deleterious effects on occupants under typical indoor exposure levels.68 But as a metabolic product, CO2 is a proxy for pollutants generated by occupants, so it is not surprising to find associations between CO2 and odors in this study. In the history of indoor air studies, CO2 has been used as an indicator for indoor air quality.69 CO2 produced by occupants may not be removed efficiently if ventilation rate is low. Therefore, it has been called as a proxy for ventilation. However, the home environment is characterized by low occupancy levels (compared to offices and schools). Building materials and furnishings may be another nonnegligible pollution source in homes and can have substantial influence on occupants’ health. Especially in present China, with the development of urbanization and modernization, more and more new chemical consumer products are used in modern homes. Under such circumstance, CO2 concentration may be not a comprehensive indicator of indoor air quality in homes. Strengths and Limitations A strength of this study is that our data covered all climate zones in China, for all seasons. Variable indoor physical parameters resulting from a range of outdoor RH and T in all seasons and climate zones broadened the study and increased the possibility of combining indoor physical parameters. Moreover, a full year’s measurement is longer than previous studies. That each self-report on SBS symptoms corresponding to simultaneous measurements allowed us to not be confounded by seasonal variations of measured or perceived indoor air quality. A limitation of our study is possible selection bias and recall bias. A relatively small number of subjects in each climate zones were included in this study, which could have biased the selection of participants. The percentage of SBS in each climate zone may be not representative. But considering the whole of China in this study, we have no prior information on occupants’ health status, and the sample size of this study was large with a good response rate (64.9%), so selection bias is unlikely. The short (one month) recall period can preclude recall bias in which occupants may overestimate or underestimate their SBS symptoms or perceived indoor air quality. In addition, as a number of statistical tests were performed, significance levels were high (p
most likely cannot explain the strong association. The second limitation is that we did
not consider outdoor seasonal pollutants such as pollen and ozone. Associations
between CO2/T/RH with perceived air quality and SBS symptoms might be confounded
by these exposures. The third limitation is that readings of monitors may drift during
the one year of measurement. The lower limit of CO2 sensor drifted from original -3%
to -10%. Hou et al. detailed the calibration methods and results.1

5 Conclusion
This study evaluated subjectively and objectively indoor environment in all five of
China’s climates zones based on a one-year continuously monitoring campaign and
monthly-repeated questionnaire survey.
CO2 concentration were positively associated with percentage of perceived stuffy odor.
Occupants who lived in residences with low CO2 concentration were less likely to have
skin SBS symptoms.
RH was positively associated with percentage of perceived moldy odor and humid air,
and negatively associated with perceived dry air. Increasing indoor air humidity to a
reasonable level alleviated mucosal SBS symptoms and skin SBS symptoms. However,
the benefit of high humidity for perceived dry air and skin dryness symptoms was
weaker under high CO2 concentration level.

Acknowledgements
This study is funded by the National Key Project of the Ministry of Science and
Technology, China (2016YFC0700500), the National Natural Science Foundation of
China (21207097), and Key Research and Development Program of Tianjin Science
and Technology Commission (19YFZCSN01170). Special appreciation to Louise B.
Weschler, who has polished our language and clarified our expression.

References
1.Hou J, Sun Y, Chen Q, et al. Air change rates in urban Chinese bedrooms. Indoor Air.
2019;29:828-839.
2.Hou J, Zhang Y, Sun Y, et al. Air change rates at night in northeast Chinese homes.
Build Environ. 2018;132:273‐281.
3.Norbäck D. An update on sick building syndrome. Curr Opin Allergy CL 2009;9:55-
9.
4.Sun Y, Hou J, Cheng R, et al. Indoor air quality, ventilation and their associations with
sick building syndrome in Chinese homes. Energy Build. 2019;197:112-119.
5.World Health Organization. Indoor Air Pollutants: Exposure and Health Effects.
EURO Reports and Studies 78, WHO. Geneva, 1983.
6.Redlich, C., Sparer, J., Cullen, M. Sick-building syndrome. Lancet. 1997;349:1013-
1016.
7.Sundell J, Lindvall T. Indoor air humidity, sensation of dryness as a risk indicator of
SBS. Indoor Air. 1993;3:382-390.
8.Engvall K, Norrby C, Norbäck D. Sick building syndrome in relation to building
dampness in multi-family residential buildings in Stockholm. International Archives of
                                            16
Occupational and Environmental Health. 2001;74:270-278.
9.Kishi R, Saijo Y, Kanazawa A, et al. Regional differences in residential environments
and the association of dwellings and residential factors with the sick house syndrome:
a nationwide cross-sectional questionnaire study in Japan. Indoor Air. 2010;19:243-254.
10.Imai N, Imai Y, Kido YPsychosocial factors that aggravate the symptoms of sick
house syndrome in Japan. Nurs Health Sci. 2008;10:101-109.
11.Tudor-Locke C, Washington T L, Ainsworth BE, et al. Linking the American Time
Use Survey (ATUS) and the compendium of physical activities: methods and rationale.
J Physical Activity Health. 2009;6:347-353.
12. Leech J.A., Nelson W.C., Burnett R.T., et al. It's about time: a comparison of
Canadian and American time-activity patterns, J. Expo. Anal. Environ. Epidemiol.
2002;12:427-432.
13.Brasche S., Bischof W. Daily time spent indoors in German homes-baseline data for
the assessment of indoor exposure of German occupants, Int. J. Hyg Environ. Health.
2005;208:247-253.
14.Wang J., Li B., Yang Q., et al. Odors and sensations of humidity and dryness in
relation to sick building syndrome and home environment in Chongqing, China, PLoS
One. 2013;8:e72385.
15.Bu Z, Wang L, Weschler L, et al. Associations between perceptions of odors and
dryness and children’s asthma and allergies: A cross-sectional study of home
environment in Baotou. Building and Environment. 2016;106:167-174.
16.Lu, C., Deng, Q., Li, Y., et al. Outdoor air pollution, meteorological conditions and
indoor factors in dwellings in relation to sick building syndrome (SBS) among adults
in China. 2016;560-561;186-196.
17. Lin Z., Wang T., Norback D., et al. Zhao, Sick building syndrome, perceived odors,
sensation of air dryness and indoor environment in Urumqi, China, Chin. Sci. Bull.
2014;59:5153-5160.
18. Huo X, Sun Y, Hou J, et al. Sick building syndrome symptoms among young parents
in Chinese homes. Build Environ. 2020;169:106283.
19. Cone J.E., Shusterman D. Health effects of indoor odorants, Environ. Health
Perspect. 1991;95:53-59.
20. Dalton P. Odor, irritation and perception of health risk, Int. Arch. Occup. Environ.
Health. 2002;75:283-290.
21. Nakaoka H., Todaka E., Seto H., et al. Correlating the symptoms of sick-building
syndrome to indoor VOCs concentration levels and odour, Indoor Built Environ.
2014;23:804-813.
22.Wolkoff P. Indoor air humidity, air quality, and health - an overview, Int. J. Hyg
Environ. Health. 2018;221:376-390.
23.Sundell J. On the association between building ventilation characteristics, some
indoor environmental exposures, some allergic manifestations and sub- jective
symptom reports, Indoor Air. 1994;4:7-49.
24.Zhang S, Ou C, Liu R, et al. Association between parental perceptions of odors and
childhood asthma in subtropical South China with a hot humid climate. Build Environ.
2019;159:106155.
1725.Morey P.R., Shattuck D.E. Role of ventilation in the causation of building-associated
illnesses, Occup. Med. 1989;4:625-642.
26.Fang L, Clausen G, Fanger PO. Impact of Temperature and Humidity on the
Perception of Indoor Air Quality. Indoor Air. 1998;8:80-90.
27.Cain W.S., Cometto-Muñiz J.E. Irritation and odor as indicators of indoor pollution,
Occup. Med. State Art Rev. 1995;10:133-145.
28.Nagda, N.L., Rector, H.E. A critical review of reported air concentrations of organic
compounds in aircraft cabins. Indoor Air. 2003;13:292-301.
29. Sun Y., Zhang Y.,Sundell J., et al. Dampness in dorm rooms and its asociations with
allergy and airways infections among college students in China: across-sectional study,
Indoor Air. 2009;19:174-182.
30.Hagerhad-Engman L., Bornehag C.G., Sundell J. Building characteristics associated
with moisture related problems in 8,918 Swedish dwellings, Int. J. Environ. Heal. R.
2009;19:251-265.
31.Sundell J, Lindvall T. Indoor air humidity, sensation of dryness as a risk indicator of
SBS. Indoor Air. 1993;3:382-390.
32.Sun Y, Hou J, Kong X, et al. “Dampness” and “Dryness”: What is important for
children's allergies? A cross-sectional study of 7366 children in northeast Chinese
homes. Building and Environment.2018;139:38-45.
33.Frontczak M,Wargocki P. Literature survey on how different factors influence
human comfort in indoor environments. Building and Environment. 2011; 46:922-937.
34.Foraster M, Künzli, N, Aguilera I, et al. High blood pressure and long-term exposure
to indoor noise and air pollution from road traffic. Environmental Health Perspectives.
2014;122:1193-1200.
35.Brown S. Chamber Assessment of Formaldehyde and VOC Emissions from Wood-
Based Panels. Indoor Air. 1999;9:209-215.
36.Al horr Y, Arif M, Katafygiotou M, et al. Impact of indoor environmental quality
on occupant well-being and comfort: A review of the literature. International Journal
of Sustainable Built Environment,2016;5:1-11.
37.Liu J, Dai X, Li X, et al. Indoor air quality and occupants' ventilation habits in China:
Seasonal measurement and long-term monitoring. Build Environ. 2018;142: 119-129.
38.Dai X, Liu J, Li X, et al. Long-term monitoring of indoor CO2 and PM2.5 in Chinese
homes: Concentrations and their relationships with outdoor environments. Build
Environ. 2018;144:238-247.
39.Ministry of Housing and Urban-Rural Development of the People’s Republic of
China. GB50176-2016 Code for thermal design of civil building. Beijing: China
Architecture & Building Press; 2016.
40.National Bureau of Statistics of China. China Statistical Yearbook 2017. Beijing:
China Statistics Press; 2017.
41.Norbäck D, Edling C. Environmental, occupational, and personal factors related to
the prevalence of sick building syndrome in the general population. Br J Ind Med
1991;48:451-462.
42.Apter A, Bracker A, Hodgson M, et al. Epidemiology of the sick building syndrome.
J Allergy ClinImmunol. 1994;94:277-288.
1843.Bjӧrnsson E, Janson CD, Boman G. Symptoms relatedto the sick building syndrome
in a general population sample:associations with atopy, bronchial hyper-responsiveness
andanxiety. Int J Tuberc Lung Dis. 1998;2:1023-1028.
44.Hodgson M. The sick-building syndrome. Occup Med. 1995;10:167-175.
45.Mendell M.J. Non-Specific Symptoms In Office Workers: A Review And Summary
Of The Epidemiologic Literature. Indoor Air. 1993;3:227-236.
46.Sahlberg B, Norbäck D, Wieslander G, et al. Onset of mucosal, dermal, and general
symptoms in relation to biomarkers and exposures in the dwelling: a cohort study from
1992 to 2002. Indoor Air.2012;22:331-338.
47.Brauer C, Mikkelsen S. The influence of individual and contextual psychosocial
work factors on the perception of the indoor environment at work: a multilevel analysis.
Int Arch Occup Environ Health 2010;83:639-651.
48.Hashiguchi N., Hirakawa M., Tochihara Y., et al. Effects of settingup humidifiers on
thermal conditions and subjective responses of patients and staff ina hospital during
winter. Appl. Ergon. 2008;39:158-165.
49.Norbäck D., Wieslander G., Nordstrӧm K., et al. The effect of air humidification on
symptoms and nasal patency, tear film stability, and biomarkers in nasal lavage: A 6
weeks' longitudinal study. Indoor Built Environ. 2000;9:28-34.
50.Nordstrӧm K., Norbäck D., Akselsson R. Effect of air humidification on the sick
building syndrome and perceived indoor air quality in hospitals: a four month
longitudinal study. Occup. Environ. Med. 1994;51:683-688.
51.Lagercrantz L. Sensation of dryness, humidity of air, comfort and health.
International Center for Indoor Environment and Energy: Technical University of
Denmark; 2005.
52.Wargocki P, Lagercrantz L, Witterseh T, et al. Subjective perceptions, symptoms
intensity and performance: a comparison of two independent studies, both changing
similarly the pollution load in an office. Indoor Air. 2002;12:74-80.
53.Persily AK. Field measurement of ventilation rates. Indoor Air. 2016;26:97-111.
54.Williams R., Rankin N., Smith T., et al. Relationship between the humidity and
temperature of inspired gas and the function of the airway mucosa. Crit. Care Med.
1996;24:1920-1927.
55.Wolkoff P. External eye symptoms in indoor environments. Indoor Air.
2017;27:246-260.
56.Wolkoff P., Kjærgaard S.K., The dichotomy of relative humidity on indoor air quality,
Environ. Int. 2007;33:850-857.
57.Suhalim, J.L., Parfitt, G.J., Xie, Y., et al. Effect of dessiccating stress on mouse
meibomiangl and function. Ocul. Surf. 2014;12:59-68.
58.Myatt, T.A., Kaufman, M.H., Allen, J.G., et al. Modeling the airborne survival of
influenza in a residential setting: the impacts of home humidification. Environ. Health.
2010;9:55.
59.Fang L, Clausen G, Fanger PO. Impact of temperature and humidity on chemical
and sensory emissions from building materials. Indoor Air. 1999;9:193-201.
60.Fechter, J.-O., Englund, F., Lundin, A. Association between temperature, relative
humidity and concentration of volatile organic compounds from wooden furniture in a
19model room. Wood Mater. Sci. Eng. 2006;1:69-75.
61.Huang, S., Xiong, J., Cai, C., et al. Influence of humidity on the initialemittable
concentration of formaldehyde and hexaldehyde in building materials: experimental
observation and correlation. Sci. Rep. 2016;6:1-9.
62.Markowicz, P., Larsson, L. Influence of relative humidity on VOC concentrations in
indoor air. Environ. Sci. Pollut. Res. 2015;22:5772-5779.
63.Wolkoff, P. Impact of air velocity, temperature, humidity, and air on long-term VOC
emissions from building products. Atmos. Environ. 1998;32:2659-2668.
64.Howieson S, Lawson A, McSharry C, et al. Domestic ventilation rates, indoor
humidity and dust mite allergens: Are our homes causing the asthma pandemic?
Building Services Engineering Research and Technology. 2003;24:137-147.
65.Huang, S., Wei, W., Weschler, L.B., et al. Indoor formaldehyde concentrations in
urban China: preliminary study of some important influencing factors. Sci. Total
Environ. 2017;590-591:394-405.
66.Seppänen OA, Fisk WJ, Mendell MJ. Associations of ventilation rates and CO2
concentrations with health and other responses in commercial and institutional
buildings. Indoor Air. 1999;9:226-252.
67.Wong, N.H., Huang, B. Comparative study of the indoor air quality of naturally
ventilated and air-conditioned bedrooms of residential buildings in Singapore. Build.
Environ. 2004;39:1115-1123.
68.Zhang X, Wargocki P, Lian Z, et al. Effects of exposure to carbon dioxide and
bioeffluents on perceived air quality, self-assessed acute health symptoms, and
cognitive performance. Indoor Air. 2017;27:47-64.
69.Persily A. Evaluating Building IAQ and Ventilation with Indoor Carbon Dioxide.
ASHRAE Transactions. 1997;103:193-204.
20You can also read