Astro2020 Science White Paper The Importance of Thermal Emission Spectroscopy for Understanding Terrestrial Exoplanets
←
→
Page content transcription
If your browser does not render page correctly, please read the page content below
Astro2020 Science White Paper

The Importance of Thermal Emission
Spectroscopy for Understanding Terrestrial
Exoplanets
Thematic Areas:                 ☒ Planetary Systems   ☐ Star and Planet Formation
 ☐Formation and Evolution of Compact Objects          ☐ Cosmology and Fundamental Physics
 ☐Stars and Stellar Evolution ☐Resolved Stellar Populations and their Environments
 ☐Galaxy Evolution              ☐Multi-Messenger Astronomy and Astrophysics

Principal Author:
Name: Michael R Line
Institution: Arizona State University
Email: mrline@asu.edu
Phone: 920-360-0536

Co-authors:
Sascha P. Quanz (ETH Zurich), Edward W. Schwieterman (UCR), Jonathan J Fortney (UCSC),
Kevin B. Stevenson (STScI), Tom Greene (NASA Ames Research Center), Robert Zellem
(JPL), Caroline Morley (UT-Austin), Tiffany Kataria (JPL), Luke Tremblay(ASU), Bertrand
Mennesson (JPL), Aishwarya Iyer (ASU), Dimitri Mawet (Caltech), Nicolas Iro (University of
Vienna), Lisa Kaltenegger (Cornell), Denis Defrere (University of Liege)

Co-signers: Edwin S. Kite (University of Chicago), Douglas A. Caldwell (SETI Institute),
Evgenya Shkolnik (Arizona State University), Diana Dragomir (MIT/UNM), Franck Marchis
(SETI Institute), Henry Ngo (NRC Canada), Jasmina Blecic (NYUAD), Tim Lichtenberg
(University of Oxford), Daniel Angerhausen (Bern University), Arif Solmaz (Çağ University),
Eric T. Wolf (CU Boulder), John Monnier (UMichigan), Stephen R. Kane (University of
California, Riverside), William Danchi (NASA/GSFC), Keivan Stassun (Vanderbilt University),
Diana Valencia (University of Toronto), Johannes Staguhn (JHU & NASA-GSFC)

                                                                                           0
Introduction
We can remotely sense an atmosphere by observing its reflected, transmitted, or emitted light in
varying geometries. This light will contain information on the planetary conditions including
atmospheric composition, surface temperature/pressure, cloud/aerosol properties, and weather.
Each of these approaches/techniques carry both complementary and redundant information as well
as their own unique challenges in interpretation. The challenge is in deciding the optimal
observational “regime(s)” (or combinations thereof) to characterize terrestrial planet atmospheres.
The goal of this white paper is to reiterate the importance of the thermal (~3 - 50 um) emission
spectroscopy regime for characterizing planets beyond our solar system.
Why is Planetary Thermal Emission Important?
For most planets, the energy budget of a planetary atmosphere is dominated by the absorption and
re-radiation of stellar energy (1). The temperature structure of the atmosphere (its temperature
as a function of height or pressure) is a diagnostic and a driver of planetary chemistry and
climate. An emission spectrum simultaneously encodes information about this temperature
structure and molecular abundances as well as the re-radiated luminosity of the planet. If we are
to understand the climates of terrestrial planet atmospheres, we need emission spectra. In
particular, the mid-IR (MIR) is a critical wavelength regime as it presents multiple absorption
features of multiple major molecules required to explore planetary conditions. For terrestrial
planets, the MIR can access signs of life: the combination of ozone with methane (and/or N2O),
which is a much more challenging observation in the visible. The importance of the MIR is well
known to the Earth and planetary science communities. Most Earth-bound climate and weather
satellites contain thermal emission sensitive instruments. For instance, global weather
forecasting relies upon space-based nadir sounding data obtained between ~4 and 13 microns
(GOES-R, 2) to retrieve the humidity, surface and tropospheric temperatures, and cloud-top
temperatures. Furthermore, decades of solar-system missions have relied upon thermal emission
measurements to accomplish their key science goals.
Lessons Learned from ~15 Years of Extrasolar Giant Planet Science
The community has made outstanding progress in understanding the nature of hot extrasolar
Jovian-like worlds (T > 600K, R > 4RE). From this experience, we’ve learned that thermal
emission measurements are key to constraining atmospheric composition, thermal structure,
climate, and circulation (e.g., 3-10). Emission spectroscopy has been the only approach for
understanding the atmospheric properties of young directly-imaged planets thus far (e.g., 11-13)
Composition: A key driver of exoplanet science of the past decade has been atmospheric
atomic/molecular abundance determinations, to look for enhancements compared to parent star
composition, and to understand ratios between these species. Identifying differences in
atmospheric elemental abundances when compared to the parent star composition aid in testing
planetary formation models (e.g., 14-16). Infrared (IR) wavelengths provide multiple strong
molecular bands for the most important C, N, and O-bearing molecules. The strength of multiple
bands is critical to overcoming degeneracies inherent in fitting models to spectra (e.g., 17) leading
to more stringent abundance constraints.
1Thermal IR emission observations are also much less influenced by the presence of
clouds; clouds are currently the largest uncertainty in atmospheric modeling (18,19).
Transmission spectra are easily influenced by particulates due to the slant path geometry (20).
Reflected light spectra largely rely on a bright scattering layer to increase signal and are also in a
regime sparse in strong molecular absorbers. Interpretations of spectra in these two regimes are
therefore highly dependent upon the cloud modeling assumptions. However, long-wave IR
spectra, due to the much stronger molecular opacity relative to cloud opacity (per “unit-cloud”)
and simpler geometry, are much less sensitive (though not entirely insensitive) to the cloud
modeling assumptions. Mitigating the role of uncertain cloud properties is imperative to our
understanding of atmospheric composition.
Vertical Structure, Climate, & Circulation: Thermal emission observations have proven to be
the only reliable way of determining the vertical thermal structure of extra-solar atmospheres.
Highly irradiated hot Jupiter’s were hypothesized to possess stratospheric inversions (similar to
Earth’s ozone induced inversion) due to the presence of strongly UV/optical absorbing metal
oxides (21). IR Emission observations were critical to determining the presence of these inversions
via the detection emission features over the HST and Spitzer wavelength ranges (e.g., 9) as well
the molecular absorbers causing them (22-24). Assessing the plausibility of the existence and
abundances of these species, through chemical arguments, is dependent upon our knowledge of
the thermal structure. Furthermore, the vertical thermal structure is the key property governing
the presence of obscuring equilibrium condensate clouds and the dominant molecular species
in Jovian worlds. Broad wavelength coverage emission spectroscopy of both the day and night
“sides” of an irradiated transiting planet allow for a full accounting of the global energy balance
(e.g., 25,26,4) allowing for the derivation of the planetary bond albedo. More ambitious phase
curve observations of tidally locked planets (hence longitude) directly probe the day-to-night heat
transport (e.g., 27, 28), global cloud coverage (24,29), and horizontal variations in gas-phase
chemistry (30).
The Need for Thermal Emission in Characterizing Temperate Terrestrials
Temperate terrestrial worlds will be much cooler (~300K) than many planets characterized thus
far. Nearly 90% of their thermal radiation will emit between 5 and 30 um. In order to address
similar fundamental questions about atmospheric composition, climate, and circulation, MIR
wavelengths will necessarily be required.
Is this Planet Terrestrial? Establishing if a planet is rocky is one of the first steps in determining
its habitability prospects. Current exoplanet demographics suggest that rocky or “terrestrial”
planets typically have radii less than ~1.5 that of Earth (31,32). Transiting planet characterization
will always have the advantage of well-known masses/radii (within precision limits). However,
most terrestrial worlds we are likely to characterize in the future will not be transiting due to
statistics and the intrinsic stellar photon noise limit for transiting planets. Reflected light
observations, while incredibly diagnostic of planetary conditions (e.g., 33,34), suffer from the
inherent albedo-vs.-radius degeneracy. Without knowing a-priori the reflectivity of the planet,
the radius could be unknown up to a factor of ~7 (35) which could mean the difference between
2a terrestrial planet, a Super-Earth, or a Neptune-like world (36). Thermal emission
spectroscopy, however, (through imaging) does not suffer from the albedo-radius degeneracy.
If the distance is known, like with brown dwarfs (e.g., 37,38), the radius can be obtained
photometrically as the planetary temperature information is encoded independently within the
spectral shape.
Composition and Bio-Indicators: The thermal IR is a rich spectral region for detecting
biosignature gases including the chemical disequilibrium between them (39, 40) and this has
generally been true throughout geologic time on our own planet (41). Studies of the geochemical
evolution of Earth’s atmosphere suggest that false negatives for remote life detection may be
common in reflected light because Vis/Near-IR (NIR) spectral features for O2 did not co-occur
with substantial CH4 (> 10 ppm) and correspondingly detectable NIR features at low spectral
resolving powers (42). However, CO2-CH4 disequilibrium is suggested as a biosignature for
reducing atmospheres like the Archean Earth (4.0-2.5 Ga; 43) with CO2 and CH4 producing the
strongest spectral features in the MIR (15 um and 7.7 um, respectively). After the Great Oxidation
Event (44), the most potentially detectable bio-indicator for Earth’s atmosphere was the
disequilibrium between O2 and CH4 (e.g., 45), which is revealed in the MIR via the simultaneous
presence of O2’s photochemical product, O3 (9.65 um) and the strong CH4 band at 7.7 um. The
MIR also includes strong signatures from H2O (5-7 um; >17 um), a key requirement for planetary
habitability, and N2O (7.6-8.8 um), another biosignature gas produced by microbes via incomplete
denitrification. The presence of CO2 and H2O also informs planetary climate. The vertical
distribution of H2O in the atmosphere is important for determining the presence of oceans and its
impact on photochemistry may suggest that biosignature trace gases possess a strong and active
source (39). In general, detecting biosignature pairs and establishing planetary context is important
in part to rule out abiotic mechanisms for putative biosignature production (35), which is strongly
supported by MIR observations.
Thermal Structure, Climate, and Circulation: Thermal emission observations of terrestrial
planets are the only way to determine the surface (or deepest layer) temperature, presence/absence
of a stratospheric inversion, and tropospheric lapse rates (e.g., dry or moist adiabat). These
quantities in turn provide context for the inferred composition (e.g., is there a water cold trap at
the tropopause?, is there an ozone induced inversion?) and the basic planetary climate. Thermal
emission phase curve observations of a tidally locked terrestrial planet (transiting or non-
transiting) can be used to determine if that planet has an atmosphere (46). An airless body would
show strong “day-to-night” temperature contrast (e.g., like Mercury). Furthermore, in non-tidally
locked planets (e.g., Earth), variability with time could be indicative of weather, as observed in
brown dwarfs (47), or of variable surface features (land/ocean/ice) due to changing emissivity’s
(48)
Future Thermal IR Spectroscopy Platforms for Terrestrial Planets
JWST: JWST will be the first observatory to obtain high-precision (< 50 ppm), moderate spectral
resolving power (R > 100) emission spectra for warm-to-hot planets over wavelengths of ~1 - 11
um containing key information for the determination of vertical temperature profiles, molecular
3abundances, and planetary climate through phase resolved observations (e.g., 49,50). However,
the JWST instruments are not optimized for precision terrestrial planet atmosphere
observations; covering this large wavelength range will require observing 3 or 4 secondary
eclipses (or as many observations per planetary phase) and the instruments may have systematic
noise floors. Ultimately, JWST’s capabilities will not be truly known until it acquires on-sky data.
The first tests of its precision will likely come from the Transiting Exoplanet Community ERS
program (51), which will perform a full-orbit phase curve observation using MIRI and
observations of a bright source using NIRISS/SOSS, both probing the thermal emission spectrum
of the planets.
OST: The Origins Space Telescope large mission concept will improve on JWST’s performance
by observing the 3-20 um spectral range simultaneously and will minimize systematic noise by
incorporating a densified pupil spectrograph design (52,53). Adding to this its larger field of
regard (relative to JWST), Origins is expected to achieve the necessary precision to constrain a
temperate terrestrial planet’s thermal structure and assess the likelihood of liquid water on its
surface (see white paper by Kataria et al.).
Ground-Based: Detecting thermal emission from terrestrial exoplanets is extremely challenging
from the ground due to the high thermal background from Earth’s atmosphere and the telescope.
ESO is currently preparing the NEAR experiment in collaboration with the Breakthrough
Foundation, where the goal is to upgrade the VISIR mid-IR imager at the VLT with an adaptive
optics system and an optimized filter and vortex coronagraph centered at ~11.2 um to search for a
(super)Earth companion in the habitable zone around Alpha-Centauri in a 100-h observing
campaign in summer 2019 (54). Going from 8-10 m class telescopes to the 30-40 m ELTs will
significantly reduce the required telescope time for such an experiment.1 Searching for the thermal
emission of terrestrial planets around the nearest stars in the L, M or N band is one of the prime
science cases for the MIR ELT Imager and Spectrograph (METIS) for the European ELT (55) and
also PSI and MICHI at the TMT (56). However, even in the era of the ELTs only a handful of
stars in the immediate vicinity of the Sun can be probed for true Earth analogs as for more
distant objects the required time-on-target becomes prohibitively long.
Nulling Interferometry: In the long run, in order to investigate the atmospheric diversity of
dozens of terrestrial exoplanets via their thermal emission, one has to go to space. While the
thermal background noise is less of a challenge, the required spatial resolution is, and only nulling
interferometry is able to provide sufficient spatial resolution, contrast and sensitivity to allow for
the detection of small planets orbiting stars within 20-25 pc (e.g., 57-59). This approach was
already actively pursued more than a decade ago with NASA’s TPF-I concept (59) and the ESO
Darwin mission (60), which, in the end, both were not implemented. Since then long-term radial
velocity and transit surveys have significantly advanced our understanding of the exoplanet
population allowing a much more robust estimate of the expected yield of a space-based mid-IR
nulling interferometer (58), which may even exceed that of large, space-based Vis/NIR telescopes
searching for planets in reflected light. Furthermore, key technologies, e.g., formation flying and
1
In the background limit the time to complete an observation with a fixed SNR scales with 1/D4.
4starlight suppression, were developed further and have reached a promising readiness level (40),
as well as record-braking dynamic ranges with ground-based nulling interferometers such as the
Keck Interferometer Nuller and the Large Binocular Telescope Interferometer (61, 62). One of
the next steps is to reassess key science requirements in terms of wavelength coverage, spectral
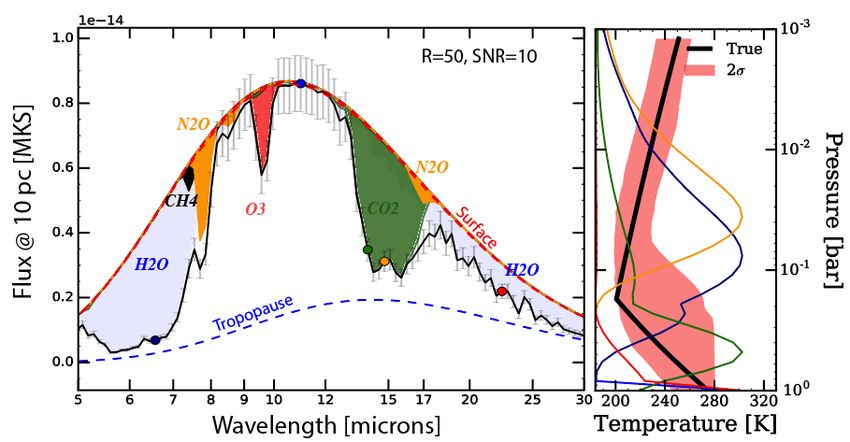
resolution and required SNR (cf. 63). Preliminary simulations suggest that the 3-30 um range with
an R~50 and SNR of 10 is sufficient to search for and identity the suspected main molecular
constituents and robustly derive abundance ratios (Figure 1, and 64). This is broadly consistent
with the requirements for TPF-I/Darwin (39).
Figure 1: Simulation of a cloud-free Earth at 10 pc in the Mid-IR (left, black line) as observed with a space-
based interferometer with a R=50, SNR=10 (light grey error bars). The key molecular absorbers are
highlighted along with the surface and tropopause blackbodies. The colored dots indicate the wavelengths
for which the thermal emission contribution functions are shown in the middle panel. The middle panel
shows the temperature structure (black) and the thermal emission contribution functions (colored curves—
where the emission originates at that wavelength). The pink error envelope represents the potential
temperature structure constraints under the R=50, SNR=10 setup. The table on the right illustrates potential
constraints on key properties. Abundance constraints are given as a “to within factor”.
Final Thoughts
We have illustrated above that the MIR thermal emission is rich in the information required to
characterize temperate terrestrial planets and to assess their potential habitability. Such emission
observations are able to provide information regarding the thermal structure (including surface
temperature and pressure), planetary radius, presence/absence of an atmosphere (through phase
curve observations), and meaningful molecular/bio-signature gas abundance constraints. We
strongly encourage the community to support the need for space-based mid-IR platforms for
addressing the Earth 2.0 challenge. Ultimately, a complete understanding of temperate terrestrial
worlds will have to rely upon a synergistic approach utilizing a combination of emitted,
transmitted, and reflected light from both space and ground-based platforms.
5References
1. Goody, R., & Yung, Y., 1995, “Atmospheric Radiation: theoretical basis”, Oxford Univ. Press
2. Schmit, Timothy J., et al., 2008, JAMC, 47
3. Charbonneau, D., et al. , 2008, ApJ, 686
4. Stevenson, K.B., Desert, J.M., Line, M.R., et al., 2014, Science, 346, 838
5. de Kok, Remco J., et al., 2013, A&A, 554
6. Swain, M. R., et al. 2008, ApJ, 674
7. Deming, D., et al. , 2010, ApJ, 726
8. Grillmair, C.J., Burrows, A., Charbonneau, D., et al., 2008, Nature, 456, 76
9. Evans, T.M., Sing, D.K., Kataria, T., et al., 2017, Nature, 548, 58
10. Line, M.R., Stevenson, K.B., Bean, J., et al., 2016, AJ, 152, 203
11. Ingraham, P., Marley, M.S., Saumon, D., et al., 2014, ApJL, 794, L15
12. Macintosh, B., Graham, J.R., Barman, T., et al., 2015, Science, 350, 64
13. Samland, M., Molliere, P., Bonnefoy, M., et al., 2017, A&A, 603, A57
14. Oberg, K.I., Murray-Clay, R.,& Bergin, E.A., 2011, ApJL, 743, L16
15. Fortney, J.J., Mordasini, C., Nettelmann, N., et al., 2013, AoH, 775, 80
16. Mordasini, C., van Boekel, R., Molliere, P., Henning, T.,& Benneke, B., 2016, ApJ, 832, 41
17. Madhusudhan, N., 2018, Handbook of Exoplanets, 104
18. Marley, M.S., Ackerman, A.S., Cuzzi, J.N.,& Kitzmann, D., 2013, Comparative Climatology of
Terrestrial Planets, 367
19. Pachauri, R., & Meyer, L., 2014, IPCC-AR5
20. Fortney, J.J., 2005, MNRAS, 364, 649
21. Fortney, J.J., Lodders, K., Marley, M.S., & Freedman, R.S., 2008, ApJ, 678, 1419
22. Mansfield, M., Bean, J.L., Line, M.R., et al., 2018, AJ, 156, 10
23. Arcangeli, J., Desert, J.M., Line, M.R., et al., 2018, ApJL, 855, L30
24. Parmentier, V., Line, M.R., Bean, J.L., et al., 2018, A&A, 617, A110
25. Cowan, N.B., & Agol, E., 2011, ApJ, 726, 82
26. Schwartz, J.C., Kashner, Z., Jovmir, D., & Cowan, N.B., 2017, ApJ, 850, 154
27. Perez-Becker, D., & Showman, A.P., 2013, ApJ, 776, 134
28. Knutson, H.A., Charbonneau, D., Allen, L.E., et al., 2007, Nature, 447, 183
29. Mendonca, J.M., Malik, M., Demory, B.O., & Heng, K., 2018, AJ, 155, 150
30. Cooper, C.S., & Showman, A.P., 2006, ApJ, 649, 1048
31. Rogers, L.A., 2015, ApJ, 801, 41
32. Chen, J., & Kipping, D., 2017, ApJ, 834, 17
33. Lupu, R.E., Marley, M.S., Lewis, N., et al., 2016, AJ, 152, 217
34. Feng, Y.K., Robinson, T.D., Fortney, J.J., et al., 2018, AJ, 155, 200
35. Meadows, V.S., Reinhard, C.T., Arney, G.N., et al., 2018, AsBio, 18, 630
36. Guimond, C.M., & Cowan, N.B., 2018, AJ, 155, 230
37. Line, M.R., Teske, J., Burningham, B., Fortney, J.J., & Marley, M.S., 2015, ApJ, 807, 183
38. Line, M.R., Marley, M.S., Liu, M.C., et al., 2017, ApJ, 848, 83
39. Des Marais, D. J., Harwit, M. O., Jucks, K. W., et al. 2002, AsBio, 2
40. Defrere, D., Leger, A., Absil, O., et al. 2018, Experimental Astronomy, 46
41. Rugheimer, S. & Kaltenegger, L. 2018, ApJ, 854, 19
42. Reinhard, C. T., Olson, S. L., Schwieterman, E. W., et al. 2017, AsBio, 17
643. Krissansen-Totton, J., Olson, S., & Catling, D. C. 2018, Science Advances, 4, eaao5747
44. Luo, G., Ono, S., Beukes, N. J., et al. 2016, Science Advances, 2, e1600134–e1600134
45. Sagan, C., Thompson, W. R., Carlson, R., et al. 1993, Nature, 365
46. Selsis, F., Wordsworth, R.D., & Forget, F., 2011, A&A, 532, A1
47. Apai, D., Radigan, J., Buenzli, E., et al., 2013, ApJ, 768, 121
48. Feldman, D., Collins, W., Incus, R., et al., 2014, PNAS, 111
49. Greene, T.P., Line, M.R., Montero, C., et al., 2016, ApJ, 817, 17
50. Feng, Y.K., Line, M.R., Fortney, J.J., et al., 2016, ApJ, 829, 52
51. Bean, J.L., Stevenson, K.B., Batalha, N.M., et al., 2018, PASP, 130, 114402
52. Matsuo, T., Itoh, S., Shibai, H., Sumi, T., Yamamuro, T., 2016 ApJ, 823, 139
53. Matsuo, T., Greene, T., Roellig, T., McMurray, R., et al., 2018, Proc. SPIE 10698, 1069844
54. Kasper, M., Arsenault, R., Kaufl, H.-U., et al., 2017, The Messenger, 169, 16
55. Quanz, S.P., Crossfield, I., Meyer, M.~R., Schmalzl, E., & Held, J., 2015, International Journal of
Astrobiology, 14, 279
56. Meyer, M.R., Currie, T., Guyon, O., et al., 2018, arXiv:1804.03218
57. Cockell, C.~S., Leger, A., Fridlund, M., et al., 2009, AsBio, 9, 1
58. Kammerer, J., & Quanz, S.P., 2018, A&A, 609, A4
59. Lawson, P.R., Lay, O.P., Martin, S.~R., et al., 2007, Proc. SPIE, 6693, 669308
60. Leger, A., Mariotti, J.M., Mennesson, B., et al., 1996, Ap&SS, 241, 135
61. Colavita, M.M., Serabyn, E., Millan-Gabet, R., et al., 2009, PASP, 121, 1120
62. Hinz, P.M., Defrere, D., Skemer, A., et al., 2016, Proc. SPIE, 9907, 990704
63. Quanz, S.P., Kammerer, J., Defrere, D., et al., 2018, Optical and Infrared Interferometry and Imaging
VI, 10701, 107011I
64. von Paris, P., Hedelt, P., Selsis, F., Schreier, F., & Trautmann, T., 2013, A&A, 551, A120
7You can also read