ASX Announcement - ASX ...
←
→
Page content transcription
If your browser does not render page correctly, please read the page content below
ASX Announcement
12 May 2021

           AusNet Services Full Year 2021 Results
                Release and Presentation
The following documents are attached:

1.   AusNet Services Full Year 2021 Results Release

2.   Investor Presentation

Naomi Kelly
Company Secretary

         This announcement was authorised for release by the Board of AusNet Services Ltd.

 Investor Relations Enquiries                                  Media Enquiries
 John Nicolopoulos                                             Adrian Hill
 Head of Tax & Investor Relations                              Acting Executive General Manager
 +61 3 9695 6301 or +61 409 672 912                            Regulation and External Affairs
                                                               + 61 3 9483 0989
ASX Announcement
12 May 2021

           AusNet Services Full Year 2021 Results
AusNet Services (AusNet) reported its full year results for the period ended 31 March 2021 (FY2021),
announcing a total dividend of 9.5cps, at the upper end of the FY2021 dividend guidance range of 9.0 -
9.5cps, franked to 40%.
The year was highlighted by a challenging and rapidly changing external environment. Against this
backdrop we delivered a solid performance across a number of important outcomes, including:
    •   We reprioritised, deferred, and stopped several non-critical works and projects to minimise
        customer disruption and support our people;
    •   We concluded our 2021-26 Electricity Distribution Price Review. The final outcome supports our
        customers while also allowing for expenditures to maintain and improve network reliability and
        safety;
    •   We demonstrated our emergency management capability in our response to several major
        customer interruptions during the year;
    •   We strengthened our balance sheet in order to take advantage of future growth opportunities;
        and
    •   After adjusting for a number of one-off and unusual items, we delivered slightly improved
        financial performance across all key metrics.

Going forward, the external environment will continue to present challenges that may impact our future
performance and will require us to adapt, manage and respond.
Tony Narvaez, Managing Director of AusNet said, “Our response to the significant challenges during
the year has demonstrated our resilience. We continue to adapt our organisation and strategy, to deliver
value to all our stakeholders, as we play our role in supporting the energy transition. We remain focused
on positioning our business to succeed in an environment of government policy change and
intervention, extreme weather events and technological change. Our transformation program will help
us adapt to the changing energy landscape and deliver improvements across our key strategic
priorities.”

  A$M                                             FY 2021             FY 2020               Variance

  Revenues                                          1,924.5            1,977.6                 ↓2.7%
  EBITDA                                            1,154.6            1,196.6                 ↓3.5%
  Earnings before interest and tax                   690.7               732.1                 ↓5.7%
  Profit before income tax                           424.1               415.4                 ↑2.1%
  Net profit after tax                               302.1               290.7                 ↑3.9%
  Cash flow from operations                          844.5               720.6                ↑17.2%

  Dividend (cps)                                       9.50              10.20                 ↓6.9%

  Franking                                             40%                50%
Operating & Financial Review

The declines in both revenue and EBITDA were impacted by several material items across both FY2020
and FY2021:
•   In the current year, we recognised a $30.7 million impairment charge against the goodwill and
    certain software assets of our Geospatial business that services both our internal regulated
    businesses as well as external customers. This impairment is as a result of a change in strategic
    direction to explore partnership models with specialist providers.
•   The prior year included additional revenues from our catch-up recognition of historical gifted assets
    ($19.1 million), the revenue arising from the completion of the West Gate Tunnel relocation project
    ($20.7 million), and $14.7 million of bushfire remediation costs as a result of the major bushfire event
    in December 2019 / January 2020.
•   There were several items that had a material impact on revenues but only a minimal impact on
    EBITDA. These were the $9.2 million decrease in our easement tax obligation, the cessation of our
    material sales business in Growth & Future Networks in late FY2020 ($16.2 million), and the prior
    year sale of inventory ($12.8 million) to Downer as part of our transfer of electricity distribution
    maintenance functions.
After excluding all of these items, revenue and EBITDA increased by $24.8 million and $14.4 million
respectively. This residual increase in revenue is largely reflective of $26.7 million higher Transmission
Use of System (TUoS) recoveries, which is a combination of prior year under recovery and higher
current year TUoS expense of $13.8 million.
Operating expenses (after excluding these items as well as the TUoS expense increase) declined $3.4
million largely due to our transformation program which delivered $9.0 million of operating cost savings
for the year (net of implementation costs). This was partly offset by a $7.0 million increase in non-
discretionary costs associated with bushfire insurance, land tax and various levies from regulators.
While EBITDA was $42.0 million lower, net profit after tax increased by $11.4 million or 3.9 per cent.
Recently completed contracted infrastructure projects resulted in a $9.6 million increase in lease interest
income. In addition, net finance charges were reduced due to reversal of previous hedge accounting
losses, while a $13.3 million income tax credit was recognised as a result of amended tax returns for
the 2016-2019 period that were lodged in the current year.
Cash flows from operations improved by 17.2 per cent to $844.5 million. This was primarily due to the
prior year including non-recurring cash payments, including a $20.1 million improvement in tax paid due
to prior year true-up amounts, $11.4 million to Downer as part of the transfer of the electricity distribution
maintenance program, and bushfire response costs. In addition, cash EBITDA (which excludes items
such as impairment, gifted assets and curtailment gain) and working capital both improved.

                                                                                                            2
Outlook
We remain focused on driving improvement across our key strategic priorities of customer passion,
energised people, operational excellence, and accelerating growth. We are committed to maintaining
strong capital management settings. This will enable us to successfully manage risks and take
advantage of future opportunities, deliver long-term shareholder value, and ultimately play a role in
contributing to a sustainable energy future. The following guidance is provided:

       •   FY22 dividend guidance of 9.5 cps
       •   FY22 franking outcome to be determined when FY22 tax profile is confirmed
       •   Targeting $13.5bn asset base by FY26, ($11bn Regulated Asset Base, $2.5bn1 Contracted
           Infrastructure Assets)
       •   Forecast Net Debt to Regulated and Contracted Asset Base of less than 70% to FY26

Dividend Key Dates
The FY2021 final dividend of 4.75 Australian cps is 40% franked. The Dividend Reinvestment Plan
(DRP) will be in operation for the FY2021 final dividend at a 2% discount to the average trading price.
The average trading price will be the average of the volume weighted average price of shares sold in
ordinary market transactions on the ASX between 25 May 2021 and 7 June 2021 (inclusive).

For further information please refer to the DRP rules at www.ausnetservices.com.au.

Relevant dates:
12 May 2021                       Announcement of Full Year 2021 Results and final dividend
20 May 2021                       Ex-dividend date for final dividend
21 May 2021                       Record date for final dividend
24 June 2021                      Payment of final dividend

1   Total value under contract (unconditional), regardless of construction phase, currently $1,021m

                                                                                                      3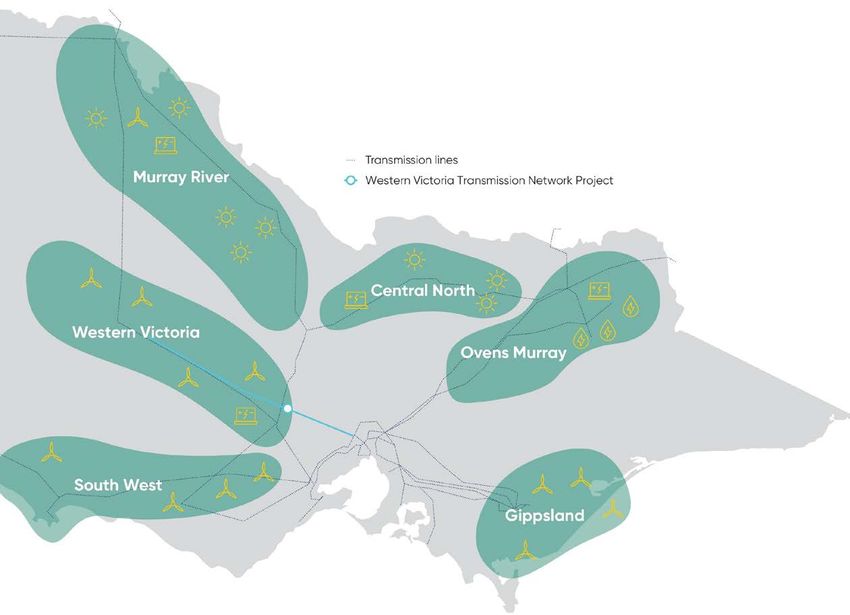
About AusNet Services

Headquartered in Melbourne, Australia, AusNet engages over 1,500 employees to service over 1.5
million customers. AusNet is the largest diversified energy network business in Victoria, owning and
operating over $11 billion of regulated and contracted assets. The company owns and operates three
core regulated networks - electricity distribution, gas distribution and the state-wide electricity
transmission network. The company also has an unregulated business called Growth & Future Networks
(includes Mondo business and customer-initiated excluded transmission services), focusing on
contracted infrastructure and energy services.

For more information visit AusNet Services’ website, www.ausnetservices.com.au.

Naomi Kelly
Company Secretary

         This announcement was authorised for release by the Board of AusNet Services Ltd.

 Investor Relations Enquiries                                    Media Enquiries
 John Nicolopoulos                                               Adrian Hill
 Head of Tax & Investor Relations                                Acting Executive General Manager
 +61 3 9695 6301                                                 Regulation and External Affairs
                                                                 + 61 3 9483 0989

                                                                                                  4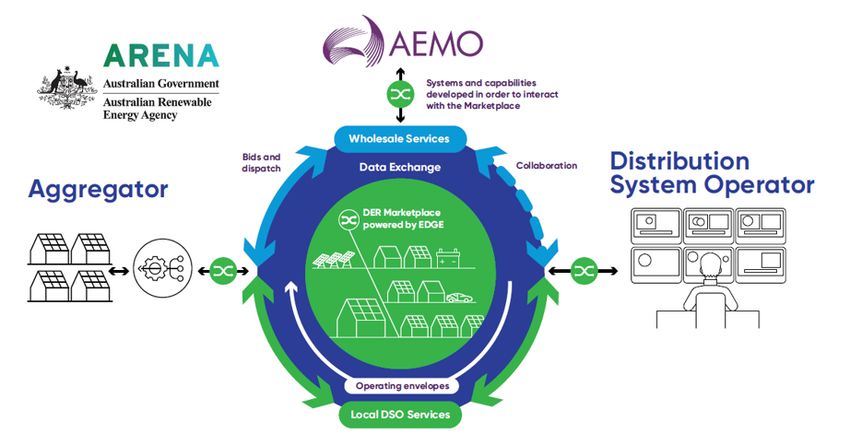
Full Year
2021 Results
For the period ended 31 March 2021

                                     Connecting
                                     Communities
Disclaimer
The AusNet Services Group (AusNet) comprises AusNet Ltd and its subsidiaries.

The information in this presentation is not a prospectus, product disclosure statement or other offering document and does not constitute an offer, invitation or
recommendation to subscribe for, retain or purchase any securities in AusNet. The information is an overview (in summary form) and does not purport to be complete or
contain all the information necessary to make an investment decision. This presentation is not financial product advice and does not take into consideration the
investment objectives, financial situation or particular needs of any particular person. You should consider the appropriateness of the information having regard to your
individual objectives, financial situation (including taxation position) and needs, and seek independent professional advice. This presentation, and the information in this
presentation, will not form the basis of any contract or commitment.

This presentation has been prepared by AusNet on the information available. To the maximum extent permitted by law, no representation or warranty, express or
implied, is made as to the fairness, accuracy, completeness or correctness of the information, opinions and conclusions in this presentation and AusNet, its directors,
officers, employees, agents and advisers disclaim all liability and responsibility (including for negligence) for any direct or indirect loss or damage which may be
suffered by any recipient through use or reliance on anything contained in or omitted from this presentation.

This presentation contains certain “forward-looking statements” and prospective financial information. These forward-looking statements and information are based on
the reasonably held beliefs of AusNet management as well as reasonable assumptions made by and information currently available to AusNet management, and are
current only as of the date of this presentation. All statements other than statements of historical facts included in this presentation, including without limitation,
statements regarding AusNet forecasts, business strategy, synergies, plans and objectives, are forward-looking statements. Past performance is also not an indicator of
future performance. In addition, when used in this presentation, the words “guidance”, “forecast”, “estimate”, “expect”, “anticipated” and similar expressions are
intended to identify forward - looking statements. Such statements are subject to significant assumptions, risks and uncertainties, many of which are outside the control
of AusNet and are not reliably predictable, which could cause actual results to differ materially, in terms of quantum and timing, from those described in this
presentation. In receiving this presentation, you agree to the above restrictions and limitations. You are strongly cautioned not to place undue reliance on forward-
looking statements, particularly in light of the current economic climate and significant volatility, uncertainty and disruption caused by the COVID-19 pandemic.

Non-IFRS information

•   Other than as indicated, the financial information contained in this document is directly extracted or calculated from the annual financial report. Throughout this
    document some non-IFRS financial information is stated (operating expenses excluding certain items and regulated and contracted asset bases). We believe these
    non-statutory measures provide useful information to understand the financial performance of the Group, but should not be considered as an indication of, or
    substitution for reported information.

•   The non-IFRS financial information has not been audited by the Group’s auditors.
                                                                                                                                                                               2
FY21 $302M
Highlights NPAT
↑ 4%
$845M $1,155M 9.50cps
Cash flow EBITDA (40% franked)
↑ 17% ↓4% FY21 Dividend
2.71 7.2/10 (avg) 8.3/10 (avg)
Recordable Injury Electricity Distribution Gas Distribution
Frequency Rate Customer Satisfaction Customer Satisfaction
(RIFR) ↑ 3% ↑ 5%
↓ 32%
3External
Environment
COVID-19: supported customers, employees and
partners by adapting new ways of working.
Strengthened business through proactive capital
management and reprioritised expenditure
Policy & Regulatory: continued customer
engagement to inform regulatory proposals
Energy Transition: supporting various Victorian
Government Policy initiatives to facilitate
renewable generation. Advancing Western
Victoria Transmission Network Project to increase
network capacity
Extreme weather: supporting communities with
bushfire and storm restoration
4Our strategy Own and operate the best energy
networks, growing through connecting
people with new energy
AusNet’s key strategic priorities
customer energised operational accelerate
passion people excellence growth
Guides us in everything Thriving and supported Always finding the best Through the energy
to achieve and safest way transition
5Growth FY21 Asset Base $11.2bn
Renewable Energy Zone
Development Plan
(RDP)
$10.3bn Regulated Asset Base
(RAB) ↑ 3%
Victorian Government’s RDP
$0.9bn Contracted Asset Base could enable 10GW of
(CAB)1 ↑ 3% renewable energy generation
capacity in Victoria across 6
Renewable Energy Zones
Investing in a new
energy future
Targeting FY26 Asset
Opportunity Pipeline
Base $13.5bn
8,000MW of renewable $11bn Regulated Asset Base
projects (wind 4,500MW, solar
2
1,300MW, storage 2,000MW, $2.5bn Contracted Infrastructure
other 200MW) Assets
1 Contracted assets in service or currently under construction
2 Total value under contract (unconditional) regardless of 6
construction phase, currently $1,021mResponsible and
Sustainable Business
Our ESG commitments FY21 Highlights
Extended COVID-19 customer bill relief to Dec 2020
(gas distribution) and Jan 2021 (electricity distribution).
Deferred non–essential maintenance to minimise
disruption and outages
Environment Social
We are committed to We are committed to Bushfire mitigation. Continued investment including
managing the impacts of protecting and supporting REFCL* and other safety measures of $108m (FY20:
climate change and our our people and
customers, whilst having a
$147m)
effect on the environment
positive impact in the
communities in which we Launched Employee Network Groups in addition to
operate Young Professionals Network - Women, Disability,
Working Parents and Cultural and Ethnic Diversity
Modern Slavery. Developed risk framework and tools to
identify and manage risks of modern slavery in our
operations and supply chain
Governance
We are committed to ethical, Task Force on Climate Related Financial Disclosures.
robust & transparent business Updated climate risk assessment & scenario analysis
practices.
7
* Rapid Earth Fault Current LimiterInvestment Essential infrastructure Accelerating Growth
highlights • 100% own and operate a portfolio of
regulated and contracted
infrastructure assets totalling $11.2bn
• Targeting $13.5bn asset base by FY26,
comprising $11bn RAB, $2.5bn1
contracted infrastructure assets
Our purpose is to “connect • Essential infrastructure assets based in • Continue to pursue Iarge-scale
Victoria (energy transmission and
communities with energy & distribution) with over 1.5m customers
transmission projects and renewable
accelerate a sustainable connections
future” Diverse asset base with staggered
•
regulatory resets
Financial Discipline Sustainability
• Prudent financial metrics and What it means for AusNet
sustainable dividends. Stand alone
credit ratings from Moody’s (A3) and • Operating an economically,
S&P (A-) environmentally and socially
sustainable business, delivering safe
• Predictable cash flows and revenues, and reliable energy to customers
predominantly set on a regulated
• Managing key environmental, social
revenue cap basis or under long term
and governance risks and
fixed price contracts
opportunities to support long-term
• Diversified debt portfolio, both in growth and performance
1Total value under contract (unconditional) regardless of terms of maturity and source 8
construction phase, currently $1,021mFinancial
Performance
9Capital
Management Funding $2.3bn of
Liquidity1
Issued AUD $1,732m hybrids
& AUD $400m long term
bonds in FY21 $1.5bn of cash & short-
term deposits
FY21 cost of funds 4.24%
$0.8bn undrawn bank
(FY20: 4.46%)
debt facilities
Prudent, long term
funding to support
growth pipeline
Prudent maturity Ratings & metrics
profile
FFO / Net Debt 11.3%2
Less than 15% of debt
portfolio maturing in any 67% Net Debt/RCAB 3
Note:
1.
2.
As at 31 March 2021
Based on 12 months to 31 March 2021. Calculated as EBITDA less
given year A-/Stable (S&P)
customer contributions, tax paid, net interest paid (inclusive of
interest income, lease interest income & capitalised finance
charges) add 50% Hybrid Interest Expense, and Loss on sale of Average debt tenor 7.6yrs A3/Stable (Moody's)
(FY20: 6.8yrs)
assets divided by face value of debt (including 50% equity credit
adjustment for Hybrid Securities) less cash and cash equivalents
and short-term deposits
3. Debt at face value less cash divided by Regulated / Contracted
Asset Base. Includes full amount of Hybrids, despite receiving 50% 10
equity creditFinancial Performance
• EBITDA decline impacted by geospatial impairment A$M FY 2021 FY 2020 Variance
($31m) and prior year gifted asset adjustment ($19m)
Statutory Result
• NPAT further impacted by $25m hedge accounting
gain (FY20: $22m loss) and tax credit from June 2015
Revenue 1,924.5 1,977.6 ↓2.7%
corporate restructure ($13m)
• Higher residential volumes for electricity distribution in EBITDA 1,154.6 1,196.6 ↓3.5%
first half offset by milder summer and 9.5% price
reductions from 1 Jan 2021 EBIT 690.7 732.1 ↓5.7%
• Completion of large unregulated infrastructure PBT 424.1 415.4 ↑2.1%
connections in prior year have contributed additional
$14m in revenue and lease interest income NPAT 302.1 290.7 ↑3.9%
• Strong cash flow supporting total dividends at the Cash flow from operations 844.5 720.6 ↑17.2%
upper end of guidance range, 40% franked (FY20 50%
franked) Dividends (cps) 9.50 10.20 ↓6.9%
11EBITDA Performance
• Regulated revenue flat for gas distribution and transmission, small decline in electricity distribution (excl TuoS recovery) from 1 Jan 2021
price decline and lower cross boundary revenue
• Key transformation savings include operating model change, contract savings and enhanced asset management
Total EBITDAaL
19
$1,189m
21
15 6 2
31 9 GFN
↓17%
109
13
Gas
Related to Prior Year Distribution ↑6%
168
$M 1,197 Electricity
Transmission ↑1%
367
1,155
Electricity
Distribution ↓4%
545
EBITDA FY20 Gifted asset Tower FY20 bushfires Geospatial Net TUOS Transformation Insurance, taxes Other revenue EBITDA FY21 EBITDAaL FY21
adjustment relocations impairment recovery Cost Savings & levies movements
(net)
Note: Chart excludes $9m movement in easement and land tax which are pass through items and inventory sale due to Downer outsourcing in FY20 ($13m) at book value. Tower relocations relate to West Gate
Tunnel Project which saw several transmission towers removed and replaced.
12Cash Flow from Operations
• Improved receivable collections relative to prior period ($42m)
• FY20 cash flow includes employee leave payments ($11m) arising from transfer of employees to delivery partners
61
4 20
39
$M
845
721
720
FY20 Cash flow EBITDA (excluding Net Finance Income Tax Change in Working FY21 Cash flow
non-cash items) Costs Paid paid Capital
13Capital Investment
Total Capex
$989M
219
Total Capex
• Growth and Future Networks spend declined due to $765M
completion of major wind farm connections in prior
period
109 105
• Electricity distribution impacted by deferral of non–
critical works, supporting customers during COVID-19
100
lock-down $M 168
• Growth / maintenance capex split 63%/37%
151
• FY21 capital investment includes customer
contributions $85m (FY20: $124m)
• FY21 Regulated & Contracted Asset Base of $11.2bn
(RAB: $10.3bn, CAB $892m) up 2.8% (FY20: $10.9bn)
497
406
FY 2021 FY 2020
Electricity Distribution Electricity Transmission
Gas Distribution Growth & Future Networks 14Dividend and Capital Investment Funding
• Dividends remain fully covered by strong operating cash flows (EBITDA is used as a proxy when considering dividends)
295
79
$M
276 Dividend coverage 1.41x
1,155 Growth capex
$469m
Debt 189
359
505
DRP 134
146 Cash 146
EBITDA (excluding Net Finance Income Tax Maintenance Capex Free Cash Flow FY21 Gross Growth Capex
non-cash items) Costs Paid Paid Dividend Funding
Note: Capital investment as per cash flow statement $745m. Estimated regulatory straight-line depreciation $467m (indexation $111m) 15Core Networks
16
16Network Highlights
Electricity Electricity Gas
Transmission Distribution Distribution
• Practical completion achieved for • Practical completion achieved for 250MW of • Continued network expansion, with 310km
730MW of wind and solar connections wind and solar connections of new gas pipelines and 3% customer
growth
• West Melbourne Terminal Station Rebuild - • New connection growth of 2%
energisation of new 66kV gas insulated • Customer Satisfaction of 8.3 (avg), up 5%
switchgear and 220/66kV transformers • Customer Satisfaction 7.2 (avg), up 3%
• As a founding member of the Australian
• Progressed major terminal station rebuilds • Connected additional 21,000 residential Hydrogen Centre, AusNet is working on a
at Springvale and Fishermans Bend customers’ solar PV systems, adding more than feasibility project in its network area
120MW of generation capacity
• Replacement and cutover of seven,
500kV Transmission Towers due to a major • August storms saw 140,000 customers impacted.
wind event in January 2020 Concerted emergency response effort from
AusNet and delivery partners to restore supply
• REFCL project progressing to plan with
compliance achieved at 13 zone substations in
Tranche 1 & 2
17Regulation
EDPR 2021-26 TRR 2022-27
• Final Decision is an endorsement of the agreements reached with the • Proposal submitted to the AER in October 2020. Draft Decision expected
Customer Forum – a customer representative body established in an by July 2021
Australia first trial of directly negotiated price/service agreements
• Final Decision due January 2022. New period commences 1 April 2022
• Increase in allowed real returns from Draft Decision, due to
application of the AER’s Inflation Review and an increase in the 10
year government bond rate
Victorian Renewable Energy Zones (REZ) Development Plan
• Victorian Government has released a Directions Paper outlining a plan
• Opex approved, incorporating an increase of $45m to reflect higher
to unlock 10GW of renewable energy capacity enabled by $540m REZ
insurance premiums
Fund
• Capex approved to enable investment in network safety, security
and reliability, including in assets that will help reduce bushfire risk,
such as the REFCL program GAAR 2023-28
• Continued investment that will allow more customers to connect their • Proposal to be submitted to the AER by 1 July 2022. Draft Decision
solar panels and batteries to the network and export power expected by December 2022
• A new incentive scheme that rewards improvements in customer • Final decision due by April 2023. New period commences 1 July 2023
experience • Joint engagement with Australian Gas Infrastructure Group
1 July 2021 1 April 2022 1 July 2023
EDPR 2021-26 TRR 2022-27 GAAR 2023-28 18Growth &
Future Networks
As part of the operating model
transformation, Growth & Future
Networks incorporates the Mondo
business and customer-initiated
excluded transmission services
19Infrastructure Growth Pipeline NEM-wide growth2
The pipeline of opportunities positions the business well for 26GW of VRE needed to replace
coal-fired generation by 2040
long-term growth. Targeting $2.5bn asset base by FY261
Grid-scale connection opportunities
• Preliminary works of c.1,500MW including
Golden Plains Wind Farm and Ryan Corner /
Hawkesdale Wind Farms
Western Victoria Transmission
Network Project
• Broad Area of Interest narrowed down to
several corridor options for further
investigation and consultation
Renewable Energy Zones
• Undertaking feasibility studies
System Strength Remediation
10GW
• Network partner for 300MW Victorian Big
Battery
increased energy capacity
Map source: Victorian Renewable Energy Zones Development Plan Directions
Paper February 2021 which could unlock 10GW of renewable energy generation
capacity
2 VRE = Variable Renewable Energy. Source: AEMO 2020 Integrated System Plan.
26GW includes Victoria.
20
1 Total value under contract (unconditional) regardless of construction phase, currently $1,021mEnergy Services
Investing in new and emerging technologies and behind-the-meter assets to transition to a new energy future
as part of a decentralised energy market
Energy Demand & • Industry flagship project that will
influence future market design
Deakin University • Microgrid development
located at Waurn Ponds
Generation Exchange Microgrid Project campus
(EDGE) Project – DER • Innovative initiative with AEMO
Marketplace Trial and co-funded with ARENA to • Project combines intelligent
develop a marketplace where solar and battery technology
Distributed Energy Resources to achieve a diversified
play a significant role in energy ecosystem
providing value to customers
21Guidance
1. FY22 dividend guidance of 9.5 cps
2. FY22 franking outcome to be
determined when FY22 tax profile is
Outlook
confirmed
3. Targeting $13.5bn asset base by
FY26, ($11bn RAB, $2.5bn1
contracted infrastructure assets)
4. Forecast net debt to regulated and
contracted asset base ofAppendices
23Tax and Items contributing to lower expected net tax payable
franking profile Instant Asset Write-off incentive
• Announced as part of the 2020-21 Federal Budget. Immediate deduction
allowed for the full value of new, eligible, depreciable assets of any value
that are first used or installed before 30 June 2022.
Non-assessable gifted asset revenues (VPN decision)
• AusNet is pursuing (by way of objection) a $37.5m refund of tax paid on FY16-
FY20 gifted asset revenue. Currently being considered by ATO.
Lower net tax payable expected in
Tax Base Step-up arising from June 2015 restructure
FY22, due to accelerated tax • AusNet filed an objection during FY21 concerning tax consolidation and
depreciation and refunds sought for capital allowance outcomes arising from the June 2015 corporate
restructure.
non-assessable gifted asset • Specifically, the objection contends that the interaction of capital gains tax
revenues (VPN decision) and tax consolidation provisions results in a higher uplift in tax base from the
time of restructure.
• Based on several assumptions, AusNet estimates this potential uplift to be up
to $485m, which if, and to the extent successful, would be realised over the
life of the assets and noting that some of this benefit relates to prior periods
and therefore any refund of tax may trigger franking deficit tax.
• An objection decision is pending from the ATO. If the objection is rejected,
FY22 franking outcome to be AusNet will consider options available to clarify the operation of the law. The
determined when FY22 tax profile is ultimate outcome of the objection is inherently uncertain.
• If appeal options are not sought, or AusNet is ultimately unsuccessful, there is
confirmed no change to the current tax payment profile as AusNet has adopted the
ATO’s position throughout this period of uncertainty and has paid tax
accordingly.
24The Energy Supply Chain
Note: Network data as at 31 March 2021
25Electricity Transmission Network
• Regulated revenues predominantly decreased due to FY 2020
A$M FY 2021 Variance
lower easement tax pass-through ($9m) (Restated)
• FY22 revenue cap $579m (includes $174 m of easement
Revenue 601.2 612.3 ↓1.8%
land tax pass-through and $14m incentive revenues)
• Customer-initiated excluded prescribed and excluded
EBITDA 366.6 364.1 ↑0.7%
negotiated transmission services are now captured in
the ‘Growth & Future Networks’ segment $34m (FY20:
$56m). EBITDA Margin 61.0% 59.5% ↑2.5%
EBIT 270.5 270.5 0.0%
EBIT Margin 45.0% 44.2% ↑1.8%
Regulated Asset Base 3,690 3,620 ↑1.9%
26Electricity Distribution Network
• Expected revenue cap from 1 July 2021 to 30 June 2022, A$M FY 2021
FY 2020
Variance
$812m, includes TUOS pass through of $117m, $6m STPIS (Restated)
penalty and $26m jurisdictional scheme (solar PFIT & ESV
levy) pass through (subject to AER approval) Revenue 922.7 934.7 ↓1.3%
• FY21 TUOS revenue $115m (FY20:$89m). FY21 TUOS costs EBITDA 545.4 566.4 ↓3.7%
$107m (FY20:$93m)
EBITDA Margin 59.1% 60.6% ↓2.5%
• FY21 metering revenue $47m (FY20: $48m)
• Customer contributions $69m (FY20: $91m), lower due to EBIT 287.5 304.7 ↓5.6%
true up from prior periods
EBIT Margin 31.2% 32.6% ↓4.3%
• Excluded revenues $24m (FY20: $27m)
• Operating expenses include allocation of geospatial Volumes (GWh) 7,426 7,531 ↓1.4%
impairment $19m
Connections 768,460 753,601 ↑2.0%
Regulated Asset
4,874 4,694 ↑3.8%
Base
27Gas Distribution Network
• Higher revenues due to a 4% increase in average tariffs and A$M FY 2021 FY 2020 Variance
additional volumes due to COVID-19 restrictions and
favourable weather
Revenue 224.9 223.8 ↑0.5%
• Customer contributions $9m (FY20: $9m)
• Other revenues $1m (FY20: $2m) EBITDA 167.9 159.0 ↑5.6%
EBITDA Margin 74.7% 71.0% ↑5.2%
EBIT 107.4 96.9 ↑11.0%
EBIT Margin 47.8% 43.3% ↑10.4%
Volume (PJ) 70.2 68.3 ↑2.8%
Connections 752,882 732,479 ↑2.8%
Regulated Asset
1,708 1,676 ↑1.9%
Base
28Growth & Future Networks
• Segment includes Mondo business and customer- A$M FY 2021
FY 2020
Variance
initiated excluded prescribed and excluded (restated)
negotiated transmission services previously in the Revenue 185.2 217.3 ↓14.8%
electricity transmission segment $34m (FY20:
$56m). Reduction in customer-initiated revenue Lease Interest
due to West Gate Tunnel Project tower relocations 34.3 24.7 ↑38.9%
Income
in FY2020 ($21m)
EBITDA after lease
109.0 131.8 ↓17.3%
• Higher lease interest income due to completion of income (EBITDAal)
several renewable connections in FY20
EBITDAal margin 49.7% 54.4% ↓8.6%
• Cessation of materials sales business, net EBITDA
impact of $1m EBIT after lease
59.6 84.7 ↓29.6%
• Operating expenses include allocation of income (EBITal)
geospatial impairment $12m
EBITal Margin 27.2% 35.0% ↓22.3%
Contracted Asset
892 867 ↑2.9%
Base 1
1 Contracted assets in service or currently under construction
29Debt Maturity Profile
• Net Debt $7.4bn (as at 31 Mar 2021) - offshore debt shown at hedged rates, includes $1.5bn cash and short-term deposits
150
160
246 160
A$M
284
1082
506
825 350
806
650
51 543 550
207 425
335 63
250 252
180 200 200
125 107 99 110
70
EUR A$ MTNs US$ HKD JPY NOK S$ Hybrid* US$ Hybrid* A$ Hybrid* € Hybrid*
Note: First call date for hybrid securities: $US & $S in Sep 2021; $A Oct 2025 & € in Sep 2026
30Sound Fundamentals Financial Metrics FY 2021 FY 2020 Market Capitalisation $7.0bn $6.4bn Total Assets $14.6bn $14.3bn Regulated / Contracted Asset Base $11.2bn $10.8bn Total Borrowings (Face Value) $9.0bn $7.7bn Net Debt 1 $7.6bn $8.9bn Net Gearing (Carrying Value) 2 69% 75% Net Debt (Face Value) to Regulated / Contracted Asset Base 3 67% 67% FFO / Net Debt 4 11.3% 10.2% Credit Ratings (S&P / Moody’s) A- / A3 A- / A3 Note 1. Net debt is debt at carrying value. Includes full amount of Hybrids, despite receiving 50% equity credit 2. Calculated as net debt at carrying value divided by net debt at carrying value plus equity 3. Debt at face value less cash divided by Regulated / Contracted Asset Base. Includes full amount of Hybrids, despite receiving 50% equity credit 4. Based on 12 months to 31 March 2021. Calculated as EBITDA less customer contributions, tax paid, net interest paid (inclusive of interest income, lease interest income & capitalised finance charges) add 50% Hybrid Interest Expense, and Loss on sale of assets divided by face value of debt (including 50% equity credit adjustment for Hybrid Securities) less cash and cash equivalents including short term deposits 31
Current Regulatory Determinations

                                                 Electricity distribution                  Electricity distribution                 Electricity transmission         Gas distribution
      Regulatory period
                                                        2016-20                                   2021-26                                   2017-22                     2018-22

      Beta                                                    0.70                                       0.60                                     0.70                     0.70

      Risk Free Rate                                         2.93%                                     1.46%                                     2.52%                    2.73%

      Cost of Debt                                           5.52%                                     4.64%                                     4.94%                    5.04%

      Gamma                                                   0.40                                      0.585                                     0.40                     0.40

      Market Risk Premium                                    6.50%                                     6.10%                                     6.50%                    6.50%

      Nominal Vanilla WACC                                   6.31%                                     4.83%                                     5.80%                    5.94%

      Return on Equity                                       7.50%                                     5.12%                                     7.10%                    7.30%

      Net Capex (Nominal)                                  $1,788m                                    $1,570m                                   $780m                    $522m

      Opex (Nominal)                                       $1,355m                                    $1,400m                                  $1,225m                   $293m

      Revenue (Nominal)                                    $3,524m                                    $3,771m                                  $2,742m                   $1,040m

 Note: Data in table is based on original regulatory determinations. Electricity Distribution includes Metering. EDPR 2021-26 period comes into effect 1 July 2021
                                                                                                                                                                                        32
Further Information and Contacts
Headquartered in Melbourne, Australia, AusNet engages over 1,500 employees to service over 1.5 million customers. AusNet Services is the
largest diversified energy network business in Victoria, owning and operating over $11 billion of regulated and contracted assets. The
company owns and operates three core regulated networks - electricity distribution, gas distribution and the state-wide electricity
transmission network. The company also has an unregulated business called Growth & Future Networks (includes Mondo business and
customer-initiated excluded transmission services), focusing on contracted infrastructure and energy services.
For more information visit www.ausnetservices.com.au
For further information contact:
AusNet Services Ltd
Investor Relations
Level 31
John Nicolopoulos 2 Southbank Boulevard Southbank
Victoria 3006 Australia
Head of Tax & Investor Relations
+61 3 9695 6301 Locked Bag 14051
Melbourne City Mail Centre
Victoria 8001 Australia
Media Relations
Tel: +61 3 9695 6000
Adrian Hill Fax: +61 3 9695 6666
Acting Executive General Manager Regulation
& External Affairs
+ 61 3 9483 0989 33You can also read