Atlantic Herring Fishery Management Plan Framework Adjustment 8 and 2021-2023 Atlantic Herring Fishery Specifications
←
→
Page content transcription
If your browser does not render page correctly, please read the page content below
Atlantic Herring Fishery Management Plan

     Framework Adjustment 8 and
   2021-2023 Atlantic Herring Fishery
             Specifications
          Including an Environmental Assessment and
             Initial Regulatory Flexibility Analysis

                         DRAFT
                   September 2020
          (New alternatives in Green)

                        Prepared by the
          New England Fishery Management Council
                    In consultation with the
           National Marine Fisheries Service and the
          Mid-Atlantic Fishery Management Council
Document history
Initial Framework Meeting:   January 2020
Final Framework Meeting:     September 2020
Preliminary Submission:      October 2020
Final Submission:            ???

Cover image
Downloaded from FishWatch: www.FishWatch.gov.
1.0 TABLE OF CONTENTS
1.0      TABLE OF CONTENTS ................................................................................................................ 3
  1.1         Tables.......................................................................................................................................... 4
  1.2         Figures ........................................................................................................................................ 4
  1.3         Acronyms .................................................................................................................................... 4
2.0      INTRODUCTION AND BACKGROUND .................................................................................... 6
  2.1        Purpose and Need........................................................................................................................ 6
  2.2        Goals and Objectives................................................................................................................... 6
3.0      ALTERNATIVES UNDER CONSIDERATION ........................................................................... 6
  3.1        2021-2023 Atlantic Herring Specifications with Alternatives ..................................................... 6
      3.1.1        Overfishing Limit and Acceptable Biological Catch ............................................................. 6
      3.1.2        Management Uncertainty and Annual Catch Limit ............................................................... 8
      3.1.3        Border Transfer ................................................................................................................... 10
      3.1.4        Research Set-Aside.............................................................................................................. 11
  3.2       Summary of Specifications Alternatives Under Consideration ................................................. 12
  3.3       2021-2023 Status Quo Atlantic Herring Specifications............................................................. 14
      3.3.1        Domestic Annual Harvest.................................................................................................... 14
      3.3.2        Domestic Annual Processing ............................................................................................... 14
      3.3.3        U.S. At-sea Processing ........................................................................................................ 15
      3.3.4        Management Area Sub-ACLs for 2021-2023 ...................................................................... 15
      3.3.5        Seasonal (monthly) Sub-ACL Divisions ............................................................................. 16
      3.3.6        Fixed Gear Set-Aside .......................................................................................................... 17
      3.3.7        River Herring/Shad (RH/S) Catch Caps .............................................................................. 17
  3.4         Carryover of Unharvested Catch ............................................................................................... 18
      3.4.1        Automatic rollover of up to 10% of each sub-ACL not harvested (No Action – Alternative
      1)           18
      3.4.2        Prohibit automatic carryover of unharvested catch to fishing years 2021-2022 (Alternative
      2)           19
      3.4.3 Allow up to 5% of each sub-ACL not harvested to automatically rollover to fishing years
      2021-2022 (Alternative 3) ................................................................................................................. 19
  3.5        Adjust measures that potentially inhibit mackerel fishery from achieving optimum yield ........ 20
      3.5.1        Increase the herring incidental possession limit................................................................... 20
      3.5.2        Modify the seasonal closure of Area 1B .............................................................................. 23
4.0      AFFECTED ENVIRONMENT .................................................................................................... 24
5.0      ENVIRONMENTAL IMPACTS OF ALTERNATIVES.............................................................. 66

Framework 8 – September 2020                                                                                                                                  3
APPENDICES
      1. Final SSC Report (August 2020)
      2. Background analyses on herring and mackerel incidental catch limits and monthly fishing effort

1.1 TABLES
Table 1. OFL/ABC Alternative 1 (No Action) for 2019-2021 Atlantic herring specifications.................... 7
Table 2. OFL/ABC Alternative 2 for 2021-2023 Atlantic herring specifications (SSC Recommendation) 8
Table 3. Management uncertainty buffer options for 2021-2023 .............................................................. 10
Table 4. Range of potential RSA allocations under consideration combined with Alternative 2 for
   OFL/ABC and Options 1 and 2 for management uncertainty ............................................................. 12
Table 5. Summary of Atlantic herring specifications for all OFL/ABC and management uncertainty buffer
   alternatives ......................................................................................................................................... 13
Table 6. 2019 RH/S catch caps in the herring fishery, implemented by NMFS through in-season
   adjustment (mt) .................................................................................................................................. 17
Table 7. Summary of 2019 allocated quota, estimated catch, and potential carryover for FY2021........... 18
Table 8. Possession limits proposed in Option B. ..................................................................................... 20
Table 9. Possession limits proposed in Option C. ..................................................................................... 21
Table 10. Possession limits proposed in Option D. ................................................................................... 21
Table 11. Possession limits proposed in Option E. ................................................................................... 22
Table 12. Summary of incidental herring possession limits alternatives under consideration ................... 23

1.2 FIGURES
Figure 1. ABC control rule adopted in Amendment 8................................................................................. 7
Figure 2. Atlantic herring management areas............................................................................................ 16

1.3 ACRONYMS
ABC                    Acceptable Biological Catch
ACL                    Annual Catch Limit
ALWTRP                 Atlantic Large Whale Take Reduction Plan
AM                     Accountability Measure
AP                     Advisory Panel
APA                    Administrative Procedures Act
ASMFC                  Atlantic States Marine Fisheries Commission
BMSY                   Biomass that would allow for catches equal to Maximum Sustainable Yield
                       when fished at the overfishing threshold (FMSY)
BiOp, BO               Biological Opinion, a result of a review of potential effects of a fishery on
                       Protected Resource species
CEQ                    Council on Environmental Quality

Framework 8 – September 2020                                                                                                                              4
DFO         Department of Fisheries and Oceans (Canada)
DMF         Division of Marine Fisheries (Massachusetts)
DMR         Department of Marine Resources (Maine)
EA          Environmental Assessment
EEZ         Exclusive economic zone
EFH         Essential fish habitat
ESA         Endangered Species Act
F           Fishing mortality rate
FMP         Fishery management plan
FW          Framework
FY          Fishing year
GARFO       Greater Atlantic Regional Fisheries Office
GB          Georges Bank
GOM         Gulf of Maine
HAPC        Habitat area of particular concern
HPTRP       Harbor Porpoise Take Reduction Plan
IFM         Industry-funded monitoring
LOA         Letter of authorization
MA          Mid-Atlantic
MAFMC       Mid-Atlantic Fishery Management Council
MMPA        Marine Mammal Protection Act
MPA         Marine protected area
MSA         Magnuson-Stevens Fishery Conservation and Management Act
MSY         Maximum sustainable yield
NEMAP       Northeast Area Monitoring and Assessment Program
NEFMC       New England Fishery Management Council
NEFOP       Northeast Fisheries Observer Program
NEFSC       Northeast Fisheries Science Center
NEPA        National Environmental Policy Act
NMFS        National Marine Fisheries Service
NOAA        National Oceanic and Atmospheric Administration
OBDBS       Observer database system
OY          Optimum yield
PDT         Plan Development Team
PRA         Paperwork Reduction Act
RFA         Regulatory Flexibility Act
RPA         Reasonable and Prudent Alternatives
SA          Statistical Area
SARC        Stock Assessment Review Committee
SAW         Stock Assessment Workshop
SMB         Squid Mackerel Butterfish FMP (MAFMC)
SNE         Southern New England
SNE/MA      Southern New England-Mid-Atlantic
SSB         Spawning stock biomass
SSC         Scientific and Statistical Committee
TEWG        Technical Expert Working Group
TRAC        Trans-boundary Resources Assessment Committee
VEC         Valued Ecosystem Component
VMS         Vessel monitoring system
VTR         Vessel trip report

Framework 8 – September 2020                                           5

2.0 INTRODUCTION AND BACKGROUND
2.1 PURPOSE AND NEED
To be completed later as Council develops this action.

2.2 GOALS AND OBJECTIVES
This action has two goals. First, the 2021-2023 Atlantic herring fishery specifications are intended to
meet the overall goal of the Atlantic Herring FMP, as modified in Amendment 1 to, “manage the Atlantic
herring fishery at long-term sustainable levels consistent with the National Standards of the Magnuson-
Stevens Fishery Conservation and Management Act.”
The specific measurable actions, or objectives identified to achieve the primary goal of this action were
also defined in Amendment 1. Specifically, the stated objectives for setting specifications in this FMP are
to: harvest the resource consistent with the definition of overfishing; prevent overfishing of discrete
spawning components; avoid adverse effects on the age structure of the stock; optimize yield; minimize
the race to fish; provide opportunities in other fisheries; promote and support research; promote
compatible U.S. and Canadian management of this stock; and continue close coordination with other
federal, state, and ASMFC management plans and promote real-time management of the fishery.
The secondary goal of this action is to consider adjustments to the herring plan that potentially inhibit the
mackerel fishery from achieving optimum yield. The specific measurable actions, or objectives for the
secondary goal of this action are: 1) consider an increase in the incidental herring possession limit up to
40,000 pounds; and 2) modify the seasonal closure of Area 1B, which is currently closed January through
April.

3.0 ALTERNATIVES UNDER CONSIDERATION
3.1 2021-2023 ATLANTIC HERRING SPECIFICATIONS WITH ALTERNATIVES
3.1.1 Overfishing Limit and Acceptable Biological Catch
The SSC met July 29, 2020 and provided overfishing limit (OFL) and acceptable biological catch limit
(ABC) recommendations for this action using the Amendment 8 ABC control rule (approved in
November 2019), (See Appendix I).
        Amendment 8 ABC control rule: The control rule is biomass-based, when biomass is greater
        than 0.5 for the ratio of SSB/SSBMSY, the maximum fishing mortality allowed is 80% of FMSY, so
        20% of FMSY is left for herring predators. Under this policy as biomass declines, fishing mortality
        declines linearly, and if biomass falls below 0.1 for the ratio of SSB/SSBMSY, then ABC is set to
        zero, no fishery allocation (Figure 1).
        Amendment 8 also implemented that ABC should be set for three years but with annual
        application of the control rule. This allows ABC to vary between years within a three-year
        period, the ABC may not be constant if biomass is projected to change during a specification
        timeframe.

Framework 8 – September 2020                                                                                6
Figure 1. ABC control rule adopted in Amendment 8.

3.1.1.1 No Action OFL/ABC (Alternative 1)
No Action (Alternative 1) would maintain the 2021 Atlantic herring fishery specifications that were
implemented by Framework 6 (Table 1). Specification of Atlantic herring ABC would be 16,131 mt for
all three fishing years, which is higher than the SSC recommendation (Table 2).
Table 1. OFL/ABC Alternative 1 (No Action) for 2021-2023 Atlantic herring specifications
            Year                           OFL (mt)                           ABC (mt)
            2021                            69,064                              16,131
            2022                            69,064                              16,131
            2023                            69,064                              16,131

Rationale: No Action would maintain the same OFL and ABC values implemented under Framework 6.
This would provide more stability for the fishery but would include OFL and ABC values above levels
recommended by the SSC and would not be based on the best available data using more updated
information.

3.1.1.2 OFL and ABC consistent with the Amendment 8 ABC control rule
        (Alternative 2)
Alternative 2 would implement the OFL and ABC consistent with the ABC control rule that was
approved in Amendment 8, described in more detail in Section 3.1.1. These OFL and ABC
recommendations were reviewed and approved by the SSC (Table 2).

Framework 8 – September 2020                                                                          7
Table 2. OFL/ABC Alternative 2 for 2021-2023 Atlantic herring specifications (SSC
   Recommendation)
             Year                            OFL (mt)                              ABC (mt)
             2021                              23,423                                 9,483
             2022                              26,292                                 8,767
             2023                              44,600                                 8,767

Rationale: Alternative 2 would set OFL and ABC consistent with the ABC control rule approved in
Amendment 8 but maintaining the ABC for 2022 for 2023 as well. The original projection for 2023 ABC
was 11,025 mt; however, the SSC recommended the ABC for 2023 be reduced to better address scientific
uncertainty (See SSC Memo for more details – Appendix I).
In summary, the SSC was prepared to implement the harvest control rule selected through the
Amendment 8 MSE process. However, the SSC had reservations about the projections for Atlantic
herring and were concerned about the assumptions regarding future recruitment. The SSC
considered that the projected increase in biomass in 2023 was uncertain and were concerned
about setting ABC based on this value. In addition, the SSC supported the NEFMC’s and
NEFSC’s intent to conduct a management track assessment in 2022; therefore, 2023 values could
be revised based on verified estimates of recruitment and projections.

3.1.2 Management Uncertainty and Annual Catch Limit
The difference between the Atlantic herring ABC and the stock-wide annual catch limit (ACL) equates to
what the Council specifies as management uncertainty. Beyond the precaution inherent to the ABC
control rule, the management uncertainty specification further ensures that Atlantic herring catch will not
exceed the ABC in a given year by buffering against uncertainty related to the management system.
Management uncertainty is deducted from the ABC to derive a stock-wide ACL, which is the U.S.
Atlantic herring optimum yield (OY).
During the 2019-2021 specifications process, the Council considered a range of deductions for
management uncertainty based on three possible factors:
    1. Canadian catch of Atlantic herring (New Brunswick (NB) Weir Fishery);
    2. Uncertainty around estimates of state waters Atlantic herring catch; and
    3. Uncertainty around estimates of Atlantic herring discards.
The potential sources of management uncertainty were reviewed for this action and it was determined that
the same three sources likely encompass most of the management uncertainty in this fishery. After the
options are described below there is a summary table comparing the alternatives under consideration
(Table 3). Section ??? summarizes estimated catch levels for these sources of uncertainty and includes
more detail about these aspects of the FMP.

3.1.2.1 Management uncertainty options and associated ACLs
3.1.2.1.1 No Action management uncertainty buffer used in FY2020 (Option 1 - 4,560 mt)
Under No Action, the management uncertainty buffer used in FY2020 would be implemented again for
2021-2023, 4,560 mt. That amount would be subtracted from the ABC to produce the fishery-wide ACL.

Framework 8 – September 2020                                                                              8
Rationale: The No Action alternative for management uncertainty is the allocation used in the previous specifications package. This value was calculated by taking the last ten years of NB weir catch to determine a potential management uncertainty buffer. NB weir catch has been very variable over the years with some high catches followed by lower catches. When this option was selected in Framework 6 the Council identified this alternative as preferred because there did not seem to an apparent trend in recent NB weir catches; therefore, using more years could better capture the variability. While 2018 catch levels were relatively high for recent years, above 11,000 mt., at the time, the Council is not aware of any information to suggest this would happen again in 2019 or 2020. There have been high catches in the past as well that were not followed by high catches in subsequent years. This buffer is larger than all NB weir catch from the last ten years except for three years (2018, 2013 and 2010). 3.1.2.1.2 3-year average (2017-2019) (Option 2 – 6,244 mt) The management uncertainty buffer for 2021-2023 would be based on the most recent 3-year average (2017-2019) catch totals from the NB weir fishery (Table 31), 6,244 mt. That amount would be subtracted from the ABC to produce the fishery-wide ACL. Rationale: This alternative is based on the same method used to set the management uncertainty buffer in earlier specification packages, 3-year average of NB weir catch from the most recent three years available (2017-2019). Using the 3-year average as the management uncertainty buffer would be 6,244 mt, which is higher than the No Action alternative of 4,560 mt. This buffer is also larger than the annual NB weir catch from each of the last ten years except for three years (2018, 2013 and 2010). 3.1.2.1.3 5-year average (2015-2019) (Option 3 – 4,587 mt) The management uncertainty buffer for 2021-2023 would be based on the most recent 5-year average (2015-2019) catch totals from the NB weir fishery (Table 31), 4,587 mt. That amount would be subtracted from the ABC to produce the fishery-wide ACL. Rationale: This alternative uses the last five years of NB weir catch to determine a potential management uncertainty buffer. A five-year option was considered in previous action as well but was not selected. NB weir catch has been very variable over the years with some high catches followed by lower catches. This alternative is larger than the annual NB weir catch for over half of the last ten years, with several years above 4,587 mt (2018, 2013, and 2010). 3.1.2.1.4 10-year average (2010-2019) (Option 4 – 4,669 mt) The management uncertainty buffer for 2021-2023 would be based on the most recent 10-year average (2010-2019) catch totals from the NB weir fishery (Table 31), 4,669 mt. That amount would be subtracted from the ABC to produce the fishery-wide ACL.The range of alternatives under consideration for management uncertainty are summarized in Table 3. Rationale: This alternative uses the last ten years of NB weir catch to determine a potential management uncertainty buffer. This alternative produces a value in the middle of other options considered. NB weir catch has been very variable over the years with some high catches followed by lower catches. The Council selected this method as preferred in the last specifications package (2019-2021) because there is no apparent trend in recent NB weir catches; therefore, using more years could better capture the variability. This buffer is larger than all NB weir catch from the last ten years except for three years (2018, 2013 and 2010). Framework 8 – September 2020 9
Table 3. Management uncertainty buffer options for 2021-2023
 Management Uncertainty Option            Herring catch (mt)

 No Action (Option 1)                                     4,560

 3-year average (Option 2)                                6,244

 5-year average (Option 3)                                4,587

 10-year average (Option 4)                               4,669

Trigger values for reallocation of unused quota to Area 1A
There is a provision in the Herring FMP that allows NMFS to reallocate 1,000 mt from the management
uncertainty buffer to Area 1A if NMFS determines that the New Brunswick weir fishery lands less than a
specified amount through October 1. The associated trigger, or specified amount varies based on the
management uncertainty buffer option selected. The associated triggers for each option are in Table 4 and
were calculated using the same ratio as a previous trigger and management uncertainty buffer (4,000 mt /
6,200 mt has a ratio of 0.645). These are not alternatives, the trigger associated with each management
uncertainty buffer option is summarized in Table 4, the trigger values would not mix and match with the
various management uncertainty buffer options. If estimated landings in the New Brunswick weir fishery
are less than the appropriate trigger before October 1, NMFS will add 1,000 mt to Area 1A available
catch through a Federal Register notice. The stock-wide ACL and Area 1A sub-ACL would remain in
place.
Table 4. Trigger values associated with each management uncertainty buffer option in this action.
                                      No Action      3-year Option      5-year Option      10-year Option
 Uncertainty buffer value (mt)              4,560              6,244              4,587               4,669
 Trigger (mt)                               2,942              4,027              2,959               3,012
 Rollback (mt)                              1,000              1,000              1,000               1,000

3.1.3 Border Transfer
The Border Transfer (BT) specification is U.S.-caught herring transshipped to Canada via Canadian
carrier vessels and used for human consumption. This specification is not a set-aside; rather, it is a
maximum amount of Atlantic herring caught by U.S. vessels from Area 1A that can be transshipped to
Canadian vessels for human consumption. GARFO tracks BT utilization through a separate dealer code.
Note that setting border transfer at a value above 0 does not require that such transfers occur, but it
provides the possibility for transfer, as opposed to, for example, selling the herring for bait.

3.1.3.1 No Action – maintain border transfer at 100mt (Alternative 1)
Alternative 1 (No Action) would set border transfer at 100 mt for FY2021-2023. If selected, U.S. vessels
would be permitted to transfer up to 100 mt of herring to Canadian vessels at-sea.
Rationale: While this specification has traditionally been set at 4,000 mt, for the 2019-2021 specifications
the Council felt that level was too high under the recent quota levels. The Council selected 100 mt as the
preferred alternative for 2019-2021. It was discussed that while this activity has not occurred in recent
years (Table ???), it has been a traditional part of the U.S. herring fishery and is important for positive

Framework 8 – September 2020                                                                             10
trade relations between several U.S. and Canadian seafood companies. The Council recognized that this activity may not take place because the incentives to export herring for food may not be strong because of expected high domestic bait prices, but the Council wanted to help maintain positive trade relations between Canada and the U.S. and recognize this historical part of the fishery in some way by setting the limit above 0 mt. The Council recommended border transfer be set to 0 mt in the 2019 in-season action. Overall quotas were being reduced substantially from about 50,000 mt to 15,000 mt so it was desirable to preserve as much herring as possible for the bait market in the U.S., compared to potentially transferring some herring to Canadian vessels at sea for the food market. The incentive for border transfer is not currently available and not likely to occur. 3.1.3.2 Set border transfer at 0 mt or up to 250 mt (Alternative 2) This alternative would allow border transfer to be set at 0mt or up to 250 mt for 2021-2023. If selected, and greater than 0mt, U.S. vessels would be allowed to transfer herring to Canadian vessels that have a permit for this activity. Vessels would be subject to additional reporting requirements for border transfer. At final action, the Council will need to specify what border transfer would be between 0mt and 250mt, the value could vary between years. Rationale: This alternative is more flexible than No Action because it would enable the Council to select a lower border transfer value than Alternative 1 (100mt) or a slightly higher allocation, up to 250 mt. Incentives are still low to transfer fish to Canadian vessels, but this alternative provides that ability, or it could be set at zero to prevent border transfer. 3.1.4 Research Set-Aside The Research Set-Aside (RSA) program is a competitive grants process administered by the Northeast Fisheries Science Center. Proposals are requested for research, and incoming proposals are reviewed and ranked by a technical body. With competitive grants awarded through this process, different entities will apply. In the past, the Council has allocated either 0% or 3% of the sub-ACL for each management area for the RSA program. The regulations allow a set-aside of up to 3% in any or all herring management areas. The most recent specifications, FY2019-2021, deducted 3% of each sub-ACL for the RSA program and identified four research priorities: portside sampling, river herring bycatch avoidance, electronic monitoring, and research to support herring stock assessments. 3.1.4.1 RSA allocation of 3% of each sub-ACL (No Action – Alternative 1) This alternative would allocate 3% of each sub-ACL for the research set-aside program (FY2021-2023). Table 5 summarizes the range of possible RSA allocations at 3% of the ACL when combined with OFL/ABC Alternative 2 (applying the ABC control rule). With OFL/ABC Alternative 2 the range of possible RSA allocations would be about 97 mt to 148 mt for 2021 and about 76 mt to 126 mt for 2022 and 2023, depending on which options is selected for management uncertainty. The larger the management uncertainty buffer, the smaller the remaining ACL, thus RSA allocations are lower. If No Action (Alternative 1) for OFL/ABC is selected, RSA allocations would be larger since the total ACL is larger. Rationale: The RSA program can be useful and provide important information about the herring resource and monitoring of this fishery when the set-aside can be effectively harvested. Improving overall data collection can improve the management of the herring resource. Framework 8 – September 2020 11
3.1.4.2 RSA allocation of 3% of each sub-ACL for FY2021, and 0% for FY2022 and
        FY2023 (Alternative 2)
This alternative would allocate 3% of each sub-ACL for FY2021, but 0% for FY2022 and 2023. Table 5
summarizes the range of possible RSA allocations at 3% of the ACL for OFL/ABC Alternative 2
(applying the ABC control rule). RSA Alternative 2 is the column to the far right of that table (about 97
mt – 148 mt for 2021 depending on the various management uncertainty buffers under consideration, and
0mt for 2022 and 2023).
Rationale: An RSA award has already been granted for FY2021-2023 so this alternative would provide
set-aside to support that previously approved project. However, with recent quota reductions it has
proven more difficult to harvest RSA in recent years and if quota goes unharvested it reduces
opportunities for the herring fishery overall. The Council recently conducted a review of all RSA
programs in this region and the report highlighted several modifications that could be made to the
program to improve effectiveness. Also, herring specifications are currently being set every two years,
and Herring RSA awards have recently been granted on three years cycles. Taking a temporary pause in
the program may provide time to better sync up the RSA program with the specifications cycle, and
potentially address other issues with the herring RSA program. Future specifications packages can adjust
these percentages up to 3%, including a set-aside for FY2023 since the next package will cover fishing
years 2023-2025.
Table 5. Range of potential RSA allocations under consideration combined with Alternative 2 for
   OFL/ABC and Options 1 and 2 for management uncertainty
                            Management
                            Uncertainty             Area     Area                      RSA
                            Buffer         ACL = 1A          1B      Area 2 Area 3 (No                      RSA
 Year     OFL      ABC      Options        DAH      (28.9%) (4.3%) (27.8%) (39%) Action)                    (Alt.2)
   2021    23,423     9,483           4560     4,923      1,423      212     1,369     1,920         148         148
                                      6244     3,239       936       139       900     1,263          97          97
   2022    26,292     8,767           4,560    4,207      1,216      181     1,170     1,641         126              0
                                      6,244    2,523       729       108       701       984          76              0
   2023    44,600     8,767           4,560    4,207      1,216      181     1,170     1,641         126              0
                                      6,244    2,523       729       108       701       984          76              0

3.2 SUMMARY OF SPECIFICATIONS ALTERNATIVES UNDER
    CONSIDERATION
This section is not a separate alternative, it combines several alternatives from above to illustrate the
combination of several alternatives together. Table 6 summarizes the potential specifications under
consideration for all measure combined, including the total ACL and sub-ACLs for each combination.
There are two alternatives for OFL/ABC (Section 3.1.1) and four alternatives for the management
uncertainty buffer (Section 3.1.2.1). It is important to note that set-asides have not been removed from
these sub-ACLs yet. After final sub-ACLs a fixed gear set-aside is removed from the Area 1A sub-ACL.
In this case the Council recommends that remain at 30mt. If that is not harvested by November 1, it
automatically reverts to the Area 1A sub-ACL. Furthermore, RSA would be removed before final sub-
ACLs are allocated to the fishery. This action is considering a range of 0-3% for RSA.

Framework 8 – September 2020                                                                           12
Table 6. Summary of Atlantic herring specifications for all OFL/ABC and management uncertainty buffer alternatives
Area Sub ACLs
Management
Uncertainty ACL = Area 1A Area 1B Area 2 Area 3
Year OFL ABC Buffer Options DAH (28.9%) (4.3%) (27.8%) (39%)
4,560 11,571 3,344 498 3,217 4,513
6,244 9,887 2,857 425 2,749 3,856
4,587 11,544 3,336 496 3,209 4,502
2021 30,668 16,131 4,669 11,462 3,313 493 3,186 4,470
4,560 11,571 3,344 498 3,217 4,513
6,244 9,887 2,857 425 2,749 3,856
OFL / ABC Alternative 1
4,587 11,544 3,336 496 3,209 4,502
2022 30,668 16,131 4,669 11,462 3,313 493 3,186 4,470
4,560 11,571 3,344 498 3,217 4,513
6,244 9,887 2,857 425 2,749 3,856
4,587 11,544 3,336 496 3,209 4,502
2023 30,668 16,131 4,669 11,462 3,313 493 3,186 4,470
4,560 4,923 1,423 212 1,369 1,920
6,244 3,239 936 139 900 1,263
4,587 4,896 1,415 211 1,361 1,909
2021 23,423 9,483 4,669 4,814 1,391 207 1,338 1,877
4,560 4,207 1,216 181 1,170 1,641
6,244 2,523 729 108 701 984
OFL / ABC Alternative 2
4,587 4,180 1,208 180 1,162 1,630
2022 26,292 8,767 4,669 4,098 1,184 176 1,139 1,598
4,560 4,207 1,216 181 1,170 1,641
6,244 2,523 729 108 701 984
4,587 4,180 1,208 180 1,162 1,630
2023 44,600 8,767 4,669 4,098 1,184 176 1,139 1,598
Framework 8 – September 2020 133.3 2021-2023 STATUS QUO ATLANTIC HERRING SPECIFICATIONS
The Council does not always consider alternatives for all the herring fishery specifications. The
specifications stemming from the ACL that are status quo measures are summarized in this section.
3.3.1 Domestic Annual Harvest
The Atlantic Herring FMP specifies that domestic annual harvest (DAH) is set less than or equal to OY.
Domestic annual harvest (DAH) is based on the expected catch from U.S. fishing vessels during the
upcoming fishing year and equals OY for the U.S. fishery.
Stock-wide ACL = OY ≤ DAH
The Herring FMP, as modified by Amendment 4, also specifies that domestic annual harvest (DAH) will
be composed of domestic annual processing (DAP) and the amount of Atlantic herring that can be taken
in U.S. waters and transferred to Canadian herring carriers for transshipment to Canada (border transfer or
BT).
DAH = DAP + BT
When specifying DAH for the Atlantic herring fishery, important considerations relate to the actual and
potential capacity of the U.S. harvesting fleet. Recent fishery performance (landings) is also an important
factor in this fishery. The Herring FMP was implemented in 2001 and since that time total landings in the
U.S. fishery have decreased.
Table ??? summarizes total Atlantic herring catch as a percentage of the total available catch in each year
from 2003-2018. Atlantic herring catch has been somewhat consistent over the time period (and in
previous years); however, the quota allocated to the fishery (stock-wide ACL/OY) has decreased 50%
over the twelve-year period from 2003-2014. Allocations and landings increased after 2014 for several
years, increased for several years, and decreased dramatically more recently.
In prior years when considering the DAH specification, the Council has evaluated the harvesting capacity
of the directed Atlantic herring fleet and determined that the herring fleet is capable of fully utilizing the
available yield from the fishery. Therefore, the DAH specification for the 2019-2021 fishing years would
remain equal to the stock-wide Atlantic herring ACL, i.e., the U.S. OY specified by the Council for each
of the 2019-2021 fishing years.
3.3.2 Domestic Annual Processing
Domestic Annual Processing (DAP) is defined in the Herring FMP as the amount of U.S. harvest that
domestic processors will use, combined with the amount of the resource that will be sold as fresh fish
(including bait). DAP was set equal DAH in 2019 since border transfer was 0 mt, and minus 100 mt for
BT for 2020-2021 (Section 3.1.3).
Processing, with respect to the Atlantic herring fishery, is defined in the regulations as the preparation of
Atlantic herring to render it suitable for human consumption, bait, commercial uses, industrial uses, or
long-term storage, including but not limited to cooking, canning, roe extraction, smoking, salting, drying,
freezing, or rendering into meat or oil. The definition of processing does not include trucking and/or
transporting fish.
Because quotas have been reduced substantially in recent years, it is likely that the U.S. will be able to
utilize all the available DAP in 2019-2021. Therefore, the DAP specification for the 2019-2021 fishing
years would remain equal to the DAH specification minus the BT specification.
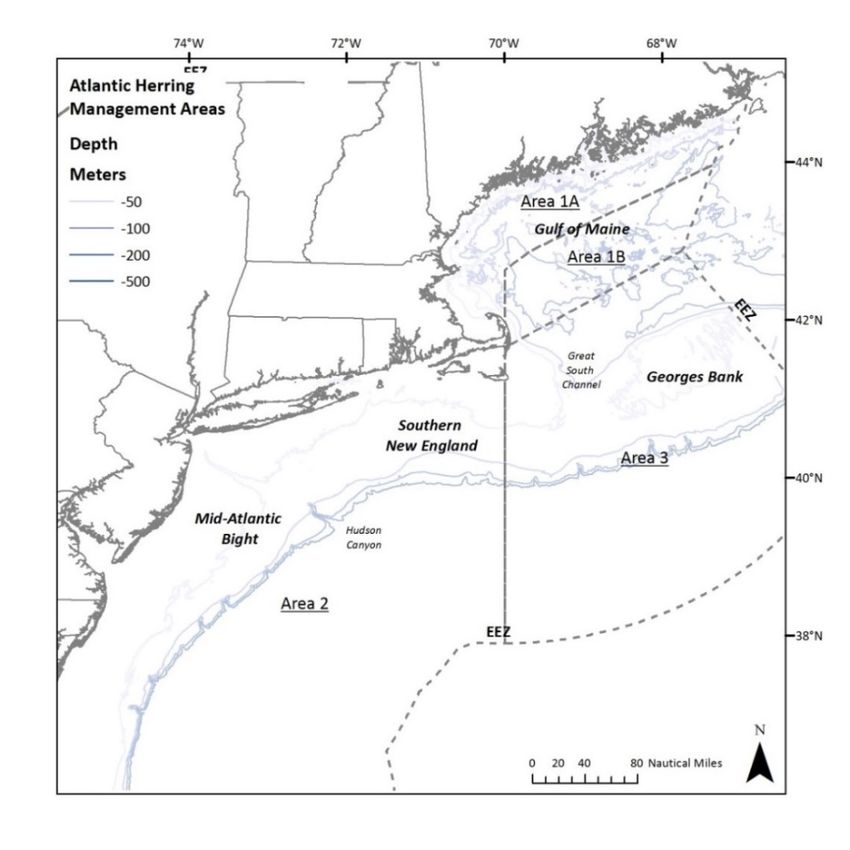
Framework 8 – September 2020 143.3.3 U.S. At-sea Processing The Atlantic Herring FMP states that “part of DAP may be allocated for at-sea processing by domestic vessels that exceed the vessel size limits” (Herring FMP, Section 3.6.6). This allocation will be called the ‘U.S. at-sea processing’ (USAP) allocation. The term ‘at-sea processing’ refers to processing activities that occur in the Exclusive Economic Zone outside state waters. When determining this specification, the Council will consider the availability of other processing capacity, development of the fishery, status of the resource, and opportunities for vessels to enter the herring fishery.” The USAP specification serves as a cap for USAP activities, it is not a separate allocation but a limit within the domestic catch limit to be used for this purpose. During the 2007-2009 fishing years, the Council maintained a USAP specification of 20,000 mt (Areas 2/3 only) based on information received about a new at-sea processing vessel that intended to utilize a substantial amount of the USAP specification. At that time, landings from Areas 2 and 3 – where USAP is authorized – were considerably lower than allocated sub-ACLs for each of the past several years. Moreover, the specification of 20,000 mt for USAP did not restrict either the operation or the expansion of the shoreside processing facilities during the 2007-2009 fishing years. However, this operation never materialized, and none of the USAP specification was used during the 2007-2009 fishing years. Consequently, the Council set USAP at zero for the 2010-2012, 2013-2015, and 2016-2018 fishing years. The Council has not received any information that would suggest changing this specification for the 2019-2021 fishing years. Therefore, the specification for the 2019-2021 fishing years will remain at 0 mt. 3.3.4 Management Area Sub-ACLs for 2021-2023 The total ACL for Atlantic herring is divided into four separate sub-ACLs intended to minimize risk to individual stock components while maximizing opportunities for the fishery to achieve OY. Area 1A is the inshore Gulf of Maine, Area 1B is considered offshore Gulf of Maine, Area 3 is primarily an offshore area of Georges Bank, and Area 2 includes all Southern New England and the Mid-Atlantic (Figure 2). The current herring management area boundaries have been in place since 2001 (Amendment 1). Since Framework 2, specifications for fishing years 2013-2015, the sub-ACLs have been allocated in the same proportions for the last seven fishing years: 28.9% for Area 1A, 4.3% for Area 1B, 27.8% for Area 2, and 39% for Area 3. The Council has specified that the sub-ACL proportions shall remain the same for 2021-2023 as well. Framework 8 – September 2020 15
Figure 2. Atlantic herring management areas

3.3.5 Seasonal (monthly) Sub-ACL Divisions
The herring sub-ACL in two of the four management areas is allocated by season, allocating 0% for
several months, essentially closing the area to directed herring fishing during those months. The Council
has specified that the seasonal sub-ACL divisions that have been in place since 2013 remain in place for
this action as well (unless changed by alternatives under consideration in Section 4.5.2):
    •   Area 1A: 0% January-May; 100% June-December;
    •   Area 1B: 0% January-April; 100% May-December.

Framework 8 – September 2020                                                                            16
3.3.6 Fixed Gear Set-Aside
Amendment 1 to the Atlantic Herring FMP allows up to 500 mt of the Area 1A sub-ACL to be allocated
for the fixed gear fisheries in Area 1A (weirs and stop seines) that occur west of 67°16.8′ W long. (Cutler,
Maine). This Fixed-Gear Set-Aside (FGSA) is available for harvest by fixed gear within the specified area
until November 1 of each fishing year. Any portion of this allocation that has not been harvested by
November 1 is transferred back to the sub-ACL allocation for Area 1A. Because this set-aside is taken
from and returned (if unused) to 1A, it was proportionally reduced relative to the 1A sub-ACL rather than
the overall ACL. Table ??? has updated catch estimates from the fixed gear fishery through 2014. This
set-aside acknowledges a historical, state water fishery that has taken place in Maine for many years. The
set-aside has been 500 mt some years, was 295 mt from 2013-2018, and some years the Council has
recommended it be set to zero. Most recently in 2019 it was set to 39 mt; this value was recommended by
the Council as a reduction that would be proportional to other reductions in the fishery.
Amendment 2 to the Interstate FMP (ASMFC 2009) requires fishermen East of Cutler to report catch
weekly through the federal IVR system, or any future reporting system. MEDMR requires the Maine state
commercial fixed gear fishermen to comply with the federal IVR weekly reporting requirements and
regulations as well as reporting monthly to MEDMR. That action also modified the date that FGSA
reverts to Area 1A to December 31. The state of Maine has also implemented a closure to state permitted
fixed gear operators when it is estimated that 92% of the fixed gear set-aside has been harvested. This
state regulation coupled with mandatory daily reporting requirements has reduced the level of
management uncertainty related to state water catch in the herring plan. The Council recommends that the
fixed gear set-aside for 2021-2023 should be set at 30 mt, the same level as FY2020. This value
maintains some level of catch to recognize the historical importance of this fishery in Maine. Since this
fishery targets small fish, age 2 fish, the fishery is likely to be limited soon since recruitment has been
well below average recently. Because our region does not have a robust survey for young fish, supporting
a small, fixed gear fishery could provide additional observations of incoming year classes and potentially
serve as an additional way to sample recruitment.
3.3.7 River Herring/Shad (RH/S) Catch Caps
The Council has specified that the RH/S catch caps implemented in the 2019 in-season adjustment
implemented by NMFS will rollover for 2020 and 2021; MWT GOM = 76.7 mt, MWT Cape Cod = 32.4
mt, MWT SNE/MA= 129.6 mt, and BT SNE/MA = 122.3 mt (Table 7). These caps were first
implemented in the 2016-2018 specifications package and were used again for 2019. These caps would be
set based on removals from the reference period before caps were in place. Since there is no biologically
based estimate of RH/S, these caps at least represent a maximum amount of bycatch from a reference
period.
During the 2016-2018 specification process these values were derived from the method that was
considered the best technical approach for determining recent RH/S catch estimates in support of the
goals and objectives of Framework 3, primarily to provide strong incentive for the industry to continue to
avoid RH/S and reduce RH/S catch to the extent practicable. When the PDT developed this method, it
argued that these years represent a “reference period” before catch caps were adopted (2008-2014). Going
forward, the PDT did not recommend adding additional years to this reference period. Including the years
that the fishery is under a cap may provide incentive for fishermen to increase their RH/S catch, which is
in opposition to the goal of the RH/S catch caps.
Table 7. 2019 RH/S catch caps in the herring fishery, implemented by NMFS through in-season
adjustment (mt)
MWT GOM MWT Cape Cod MWT SNE/MA BT SNE/MA
RH/S catch cap 76.7 32.4 129.6 122.3
Framework 8 – September 2020 173.4 CARRYOVER OF UNHARVESTED CATCH
In the herring plan, any unharvested catch in a herring management area in a fishing year (up to 10% of
that area’s sub-ACL) shall be carried over and added to the sub-ACL for that herring management area
for the fishing year following the year when total catch is determined (Framework 2, NEFMC 2013).
Section 648.201 of the herring regulations specify the carryover provisions. In Framework 6, the Council
recommended NMFS temporarily prohibit the automatic carryover of unharvested herring catch from
2018 to 2020 due to relatively large reductions in quota between the two fishing years. Carryover of
unharvested quota from 2018 could have potentially negative unintended consequences on some
participants in the fishery that fish in different areas and seasons (NEFMC, 2018).
This action is considering several alternatives related to carryover of unharvested catch from 2019 and
2020. Table 8 summarized the allocations and estimated catch for FY2019 that could be available for
carryover to FY2019. Areas 1A, 1B and 3 all had at least 10% of sub-ACLs unharvested. 2019 catch
values are not final yet, but based on these preliminary estimates, there would be an automatic carryover
of about 1,155 mt from 2019 unharvested quota to FY2021. Overages for Area 2 (over 600 mt) would
likely be reduced from the sub-ACL for Area 2 in FY2021 to account for the overage in that area from
FY2019.
Table 8. Summary of 2019 allocated quota, estimated catch, and potential carryover for FY2021
Allocated Estimated Remaining 10% Carryover
Area %
2019 Quota 2019 Catch* Quota to 2021
1A 5,223 4,689.50 89.79% 533.5 522.3
1B 628 140.6 22.39% 487.4 62.8
2 4,062 4,737.30 116.62% -675.3
3 5,700 3,144.70 55.17% 2,555.3 570
Total 15,613 12,712.10 81.42% 1,155
* Preliminary 2019 catch values, subject to change after final 2019 catch reports are final.
3.4.1 Automatic rollover of up to 10% of each sub-ACL not harvested
(No Action – Alternative 1)
No action would maintain the automatic carryover of unharvested catch up to 10% of each sub-ACL.
Specifically, up to 10% of each area’s sub-ACL in 2019, 2020 and/or 2021 would automatically rollover
and be added to the sub-ACL for each herring management area in 2021, 2022 and/or 2023, respectively.
However, the overall ACL would not increase in 2021-2023.
Rationale: The primary intent is to help optimize yield overall. There are constraints in this fishery that
can inhibit the ability for the fishery to harvest the full sub-ACL in each area. Allowing some unharvested
catch to rollover gives some flexibility to provide additional access to unharvested catch. Because the
total ACL is not also adjusted upwards to account for the rollover, there is no additional risk of the fishery
exceeding overall catch limits or causing overfishing. The total fishery would still be closed when 95% of
the total ACL is projected to be caught in the year that rollover was granted. Because this measure allows
a sub-ACL increase for a management area, but it does not allow a corresponding increase to the
stockwide ACL the overall harvest would remain constrained by the stock-wide ACL. Consequently, the
fleet would be required to forego harvest in one or more management areas to harvest the carryover
Framework 8 – September 2020 18available in a subarea. This measure maintains the management uncertainty buffer between ABC and the
stock-wide ACL, while giving the fleet some flexibility in choosing where to harvest the stock-wide ACL
3.4.2 Prohibit automatic carryover of unharvested catch to fishing
years 2021-2022 (Alternative 2)
Under Alternative 2, unharvested quota from the 2019 or 2020 herring management area sub-ACLs
would not automatically rollover to 2021 and /or 2022, respectively. This alternative is intended to be
temporary, for this specifications package only. After the 2020 fishing year ends, the prohibition would
automatically sunset or expire; and up to 10% of unharvested 2021 quota would automatically carryover
to 2023 sub-ACLs, unless modified by a future action.
Rationale: Alternative 2 was considered because the amount of carryover from 2019 (about 1,100 mt) is a
substantial amount relative to the total ACL for 2021 (about 4-5,000 mt depending on which alternative is
selected for management uncertainty, about 20-30% of the total 2021 ACL). A rollover of that size could
have negative unintended consequences on some participants in the fishery. Specifically, if some areas are
fished first including carryover, other areas that typically see herring landings later in the year may have
less access if the total ACL is already harvested and directed herring fishing is closed before each sub-
ACL is harvested.
The Council is generally supportive of carryover in this fishery to help optimize yield, but when overall
quotas are relatively small, and the carryover amounts are relatively large, the unintended consequences
and distributional impacts on different vessels from different areas could be problematic. It was also noted
that adding carryover could cause a race to fish mentality to gain as much access to the resource before
other users if fish are concentrated in one area. Furthermore, if the herring resource is as low as currently
estimated, it may not be advantageous to harvest additional catch at this time. While the fishery would
still close when 95% of the total ACL is caught, the rollover could enable more fish to be removed from
one area compared to total removals being more spread out across all areas. This measure was selected in
Framework 6 to temporarily prohibit carryover of unharvested 2018 quota increasing 2020 allocations.
However, it has been noted that the reductions from year 1 to year 3 in that case were greater than values
under consideration in this action (about 5,000 mt unused quota in 2018 versus about 1,100 mt unused
quota in 2019).
3.4.3 Allow up to 5% of each sub-ACL not harvested to automatically
rollover to fishing years 2021-2022 (Alternative 3)
Alternative 3 would maintain the automatic carryover of unharvested catch, but it would be changed from
up to 10% to up to 5% of each sub-ACL. Specifically, up to 5% of each area’s sub-ACL in 2019 or 2020
would automatically rollover and be added to the sub-ACL for each herring management area in 2021
and/or 2022, respectively. However, the overall ACL would not increase in 2021 or 2022. After the 2020
fishing year ends, the 5% automatic carryover would sunset or expire, and it would revert to 10% unless
modified by a future action.
Rationale: This alternative was developed as a compromise between 0% (prohibition on carryover) and
10% carryover. This option considers the poor status of the stock by finding a balance that allows for an
increased contribution to the recovering biomass but allows flexibility to carryover some unused quota to
help support the depressed fishing industry.
Framework 8 – September 2020 193.5 ADJUST MEASURES THAT POTENTIALLY INHIBIT MACKEREL FISHERY
FROM ACHIEVING OPTIMUM YIELD
Two specific measures in the herring plan have been identified that potentially inhibit the mackerel
fishery from achieving optimum yield in that fishery – the 2,000 pound herring incidental catch
possession limit and the seasonal closure of Area 1B from January through April. This action includes
several options to adjust these measures to improve access to the mackerel fishery since many participants
in the herring fishery also prosecute mackerel.
3.5.1 Increase the herring incidental possession limit
When 92% of the sub-ACL for a herring management area (Area 1A, 1B, 2 and 3) or 95% of the total
ACL for the herring fishery is projected to be caught a 2,000 pound incidental catch limit is implemented
to close the directed herring fishery. This relatively low possession limit makes it very challenging to
target mackerel, especially in certain areas and seasons when herring and mackerel mix. The options
under consideration for modifying the incidental herring possession limit are summarized in Table 13.
The action would not change measures in the Mackerel FMP: when 90% of the mackerel ACL is
estimated to be caught, a 40,000-pound mackerel possession limit is implemented for that fishery, and
when 98% is estimated to be caught a 2,000-pound incidental limit is implemented. Also, these measures
do not impact Area 1A. Area 1A herring fishing would remain under the current measures in place for
that management area - when 92% of the sub-ACL for Area 1A is projected to be caught a 2,000-pound
possession limit is implemented.
3.5.1.1 Option A – No Action (2,000 pounds)
When 92% of the sub-ACL for a herring management area (Area 1A, 1B, 2 and 3) or 95% of the total
herring ACL is estimated to be caught, a 2,000 lb incidental catch limit is implemented to close the
directed herring fishery in that area, or the entire area when 95% of the total herring ACL is estimated to
be caught.
3.5.1.2 Option B – Implement a two-step incidental possession limit (40,000
pounds first then 2,000 pounds)
Implement a two-step incidental possession limit similar to the mackerel plan, where a higher possession
limit is implemented first to slow the directed fishery down, and a lower possession limit is implemented
later when the fishery is very close to the full sub-ACL.
The first possession limit of 40,000 lb would be triggered at the current thresholds of 92% of a sub-ACL
or 95% of the total ACL. And when herring catch is estimated to reach 95% of a sub-ACL or 98% of the
total herring ACL a 2,000 lb incidental possession limit would be implemented in that area or fishery
wide (Table 9).
The increased possession limit would be limited to Areas 1B, Area 2 and Area 3 only.
Table 9. Possession limits proposed in Option B.
Option B Sub-ACL Total ACL
STEP 1 40,000 lb possession limit at 92% 40,000 lb at 95%
STEP 2 2,000 lb possession limit at 95% 2,000 lb at 98%
Framework 8 – September 2020 203.5.1.3 Option C – Implement a two-step incidental possession limit (range of
5,000-20,000 pounds first than 2,000 pounds)
Implement a two-step incidental possession limit similar to the mackerel plan, where a higher possession
limit is implemented first to slow the directed fishery down, and a lower possession limit is implemented
later when the fishery is very close to the full sub-ACL.
The first possession limit would be between 5,000 and 20,000 pounds and would be triggered when the
estimated herring catch is 90% of a sub-ACL, there is no step 1 relative to the total ACL. And when the
estimated herring catch reaches 95% of a sub-ACL or 95% of the total herring ACL, a 2,000 lb incidental
possession limit would be implemented in that area, or in all areas if the total herring ACL is projected to
be caught (Table 10). Before final action the Council will need to identify the specific possession limit
between 5,000 and 20,000 pounds if this option is selected.
The increased possession limit would be limited to Areas 1B, Area 2 and Area 3 only.
Table 10. Possession limits proposed in Option C.
Option C Sub-ACL Total ACL
STEP 1 5,000-20,000 lb possession limit at N/A
90%
STEP 2 2,000 lb possession limit at 95% 2,000 lb at 95%
3.5.1.4 Option D – Herring Management Area 2 only - Implement a two-step
incidental possession limit (40,000 pounds first than 5,000 pounds)
Implement a two-step incidental possession limit with the same possession limits as the mackerel plan,
where a higher possession limit of 40,000 pounds is implemented first to slow the directed fishery down,
and a lower possession limit of 5,000 pounds is implemented later when the fishery is very close to the
full sub-ACL. This measure is only under consideration for the Area 2 sub-ACL; it does not relate to
possession limits in other areas and has no bearing on the possession limits related to the total ACL, only
the Area 2 sub-ACL.
The first possession limit of 40,000 lb would be triggered when herring catch is estimated to be 90% of
the Area 2 sub-ACL. And when herring catch is estimated to be 98% of the Area 2 sub-ACL a 5,000 lb
incidental herring possession limit would be in place for the remainder of the fishing year (Table 10). This
alternative does not change the possession limits related to the total ACL, that would remain the same,
when estimated catch reaches 95% of the total ACL a 2,000 lb. possession limit is implemented in all
areas.
This alternative could be selected with other options under consideration in this action. For example, this
action may change the incidental herring possession limits in Areas 1B and 3 under a different option and
this option could be selected for Area 2 only.
Table 11. Possession limits proposed in Option D.
Option D - Area 2 only Area 2 Sub-ACL Total ACL
STEP 1 40,000 lb poss limit at 90% N/A
STEP 2 5,000 lb poss limit at 98% 2,000 lb at 95%
Framework 8 – September 2020 21Rationale: The Council developed additional alternatives for Area 2 to increase the flexibility in that area
to harvest mackerel. Implementing an incidental herring possession limit earlier, when 90% of a sub-ACL
is estimated to be caught provides more herring to target other fisheries.
3.5.1.5 Option E – Herring Management Areas 2 and 3 only - Implement a two-
step incidental possession limit (40,000 pounds first than 5,000 pounds)
Implement a two-step incidental possession limit with the same possession limits as the mackerel plan,
where a higher possession limit of 40,000 pounds is implemented first to slow the directed fishery down,
and a lower possession limit of 5,000 pounds is implemented later when the fishery is very close to the
full sub-ACL. This measure is only under consideration for the Area 2 and Area 3 sub-ACL; it does not
relate to possession limits in other areas and has no bearing on the possession limits related to the total
ACL, only the Area 2 and Area 3 sub-ACLs.
The first possession limit of 40,000 pounds would be triggered when herring catch is estimated to be 85%
of the Area 2 and/or Area 3 sub-ACLs. When herring catch is estimated to be 98% of the Area 2 and/or
Area 3 sub-ACLs a 5,000 pounds incidental herring possession limit would be in place for the remainder
of the fishing year (Table 10).
This alternative could be selected with other options under consideration in this action. For example, this
action may change the incidental herring possession limits in Areas 1B under a different option and this
option could be selected for Area 2 and Area 3 only. This alternative does not change the possession
limits related to the total ACL, that would remain the same, when estimated catch reaches 95% of the
total ACL a 2,000 lb. possession limit is implemented in all areas.
Table 12. Possession limits proposed in Option E.
Option E - Area 2 and 3 only Area 2 and/or Area 3 Sub-ACL Total ACL
STEP 1 40,000 lb poss limit at 85% N/A
STEP 2 5,000 lb poss limit at 98% 2,000 lb at 95%
Rationale: The Council developed additional alternatives for Area 2 and Area 3 to increase the flexibility
in those areas to harvest mackerel. Implementing an incidental herring possession limit earlier, when 85%
of a sub-ACL is estimated to be caught, provides more herring to be used more incidentally for vessels
targeting other fisheries.
Framework 8 – September 2020 22Table 13. Summary of incidental herring possession limits alternatives under consideration
Option A (All Areas) Sub-ACL Total ACL
No Action 2,000 lb at 92% 2,000 lb at 95%
Option B (Areas 1B, 2 and 3) Sub-ACL Total ACL
Step 1 40,000 lb at 92% 40,000 lb at 95%
Step 2 2,000 lb at 95% 2,000 lb at 98%
Option C (Areas 1B, 2 and 3) Sub-ACL Total ACL
Step 1 5,000-20,000 lb at 90% N/A
Step 2 2,000 lb at 95% 2,000 lb at 95%
Option D (Area 2 only) Sub-ACL Total ACL
Step 1 40,000 lb at 90% N/A
Step 2 2,000 lb at 98% 2,000 lb at 95%
Option E (Areas 2 and 3) Sub-ACL Total ACL
Step 1 40,000 lb at 85% N/A
Step 2 2,000 lb at 98% 2,000 lb at 95%
3.5.2 Modify the seasonal closure of Area 1B
Area 1B has been closed January through April for over five years since Framework 2 (2014). The
Council approved allowing sub-ACL splitting during the specifications process, to provide more
flexibility to allocate the herring ACL among the management areas in the most effective way possible.
Allowing sub-ACLs to be split seasonally (by month) may help to reduce derby fishing and distribute the
catch throughout the fishing year, allowing for additional fishing opportunities, and reducing the
probability that the entire sub-ACL would be caught early in the fishing year. The Council noted that this
may allow the fishery to maximize opportunities when market conditions may be more favorable.
The Area 1B sub-ACL is relatively small, and overages have been observed in several of the years before
Framework 2 was implemented. The proposed split in Area 1B was intended, in part, to address this
problem. Delaying the fishery in 1B until May would allow more time for overage or carryover
determinations. Amendment 8 later considered eliminating the seasonal closure in Area 1B as a measure
to reduce potential negative impacts of localized depletion on other users of the herring resource, but that
alternative was not selected as part of the preferred alternative.
3.5.2.1 No Action (maintain the seasonal closure of Area 1B)
Area 1B would remain closed January-April. The seasonal split of this herring management area, as well
as other herring management areas, could always be revisited in future specification packages.
3.5.2.2 Eliminate the seasonal closure of Area 1B
The seasonal closure of Area 1B that has been in place from January – April would be removed. A
seasonal closure of that area could be considered again in a future action in the Herring FMP, but if this
alternative is selected, the seasonal closure would be removed.
Framework 8 – September 2020 23You can also read