Atlantic Mackerel Fishery Information Document - Squarespace
←
→
Page content transcription
If your browser does not render page correctly, please read the page content below
Atlantic Mackerel Fishery Information Document
                                           July 2021

This Fishery Information Document provides a brief overview of the biology, stock condition,
management system, and fishery performance for Atlantic mackerel (“mackerel” hereafter), with
an emphasis on 2020. Data sources for Fishery Information Documents include unpublished
National Marine Fisheries Service (NMFS) survey, dealer, vessel trip report (VTR), permit, and
Marine Recreational Information Program (MRIP) databases and should be considered
preliminary. For more resources, including previous Fishery Information Documents, please visit
http://www.mafmc.org/msb.

Key Facts
   •   Mackerel began a rebuilding program on November 29, 2019, which was designed to
       rebuild the stock by 2023.
   •   Compared to the previous assessment, the Spawning Stock Biomass (SSB) in 2016 (the
       terminal year from that previous assessment), was revised downward by 29% in the new
       (still draft) 2021 Management Track Assessment (MTA).
   •   The new MTA indicated that SSB increased 39% from 2016 to 2019. The SSB in 2019 is
       estimated to be 24% of the updated biomass target. Overfishing was still occurring
       through 2019 and was 108% greater than the overfishing proxy. Rebuilding by 2023
       appears very unlikely.
   •   SSB is estimated to have increased 180% from 2014 (the time series minimum) to 2019.
   •   The 2017 recruitment estimate was the lowest in the time series and recruitment has been
       below the long term median since 2008 except for one year (the 2015 year class).
   •   In the new MTA, the estimated proxy for Maximum Sustainable Yield declined by 17%
       (to 34,103 metric tons (MT) annually) compared to the previous assessment.
   •   The new MTA’s conclusions are consistent with the 2021 Canadian assessment.
   •   The SSB estimates from the range-wide egg survey, a key index in the assessment,
       reached a minimum in 2010 and have been below the median since 2005.
   •   The fishery was not constrained by the river herring and shad (RH/S) cap in 2020, and
       ended the year at about 46% of the commercial quota.
   •   2019 and 2020 catches were below even the most conservative rebuilding option (with the
       lowest 2019-2020 catch limits), so regardless of which rebuilding plan the Council had
       selected, the current findings would have persisted.

                                               1
Basic Biology
Mackerel is a semi-pelagic/semi-demersal (may be found near the bottom or higher in the water
column) schooling species primarily distributed between Labrador (Newfoundland, Canada) and
North Carolina. The stock is considered to comprise two spawning contingents: a northern
contingent spawning primarily in the southern Gulf of St. Lawrence and a southern contingent
spawning in the Mid-Atlantic Bight, Southern New England and the western Gulf of Maine. The
two contingents mix during winter months on the Northeast U.S. shelf. The Canadian fishery
likely primarily catches the northern contingent while the U.S. fishery likely catches both
contingents.
Mackerel spawning occurs during spring and summer and progresses from south to north as
surface waters warm. Atlantic mackerel are serial, or batch spawners. Eggs are pelagic. Post-
larvae gradually transform from planktonic to swimming and schooling behavior at about 30-50
mm. Almost all fish are mature by age 3 in most years. Age 2 maturity appears to vary between
around 50% to nearly 100%. Atlantic mackerel are opportunistic feeders that can ingest prey
either by individual selection of prey organisms or by passive filter feeding. See
https://www.nefsc.noaa.gov/nefsc/habitat/efh/ for more life history information.

Status of the Stock
Based on the 2018 assessment (NEFSC 2018, available at http://www.mafmc.org/ssc-
meetings/2018/may-8-9), the mackerel stock was declared overfished, with overfishing occurring
in 2016 (the last year of data in the assessment). A 2021 management track assessment (MTA)
indicates that while trends since 2014 are positive, the stock is only 24% of the biomass
rebuilding target. The productivity of the stock appears to have declined. In the recent MTA, the
estimated proxy for Maximum Sustainable Yield declined by 17% to 34,103 metric tons (MT)
compared to the previous assessment. Past assessments (which used different methods and data)
appear to have been overly optimistic about the stock’s productivity. 1

Management System and Fishery Performance
Management
The Mid-Atlantic Fishery Management Council (the Council or MAFMC) established
management of mackerel in 1978 and the management unit includes all federal East Coast
waters. Expected Canadian landings are deducted from the total Acceptable Biological Catch
(ABC) that is recommended by the Council’s Scientific and Statistical Committee (SSC).
Access is limited with several tiers having different trip limits. Stricter trip limits are triggered
when the quota is approached. Additional summary regulatory information is available at
https://www.fisheries.noaa.gov/region/new-england-mid-atlantic.

1
  Referencing 1997 Federal Register publications, the 1997 mackerel allowable biological catch was
specified about ten times higher than what we now think the total SSB was in that year.

                                                   2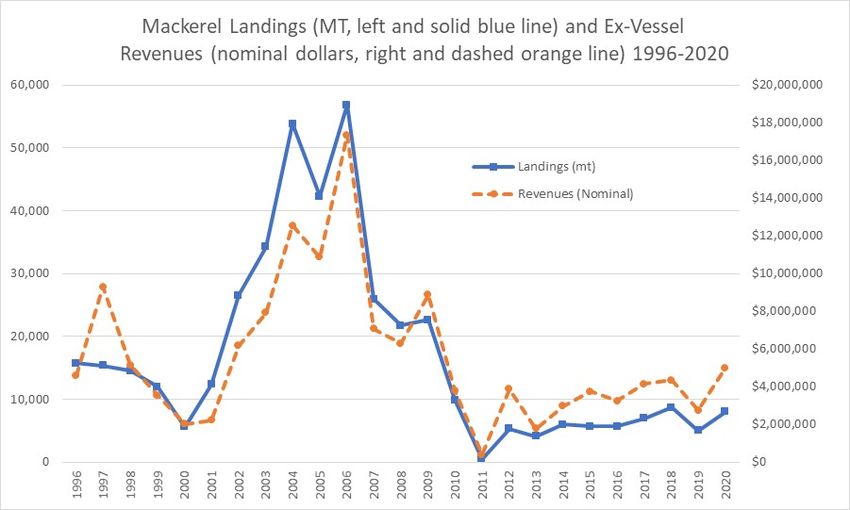
At its May 2019 meeting, the SSC considered preliminary results from the 2019 Canadian Atlantic
mackerel assessment, which indicated lower than expected recruitment in 2016-2018. The SSC
determined that it would not be appropriate to recommend the original higher 2020 rebuilding
ABC level based on recruitment levels in 2016-2018 that may be lower than those anticipated in
the rebuilding plan. Instead, the SSC recommended maintaining the ABC for 2020 at the level
established for 2019 (ABC = 29,184 mt). In 2020 the SSC endorsed maintenance of the existing
ABC for 2021-2022 (2022 interim), pending the findings of the above-referenced MTA.
Fisheries
Figure 1 describes mackerel catches (all known sources) 1960-2019. Figures 2-3 describe
domestic landings, ex-vessel revenues (nominal), and prices (inflation adjusted) since 1996.
Figures 4-5 illustrate preliminary landings throughout the year for 2019-2021.
Table 1 describes 2020 Mackerel landings by state, and Table 2 describes 2020 Mackerel
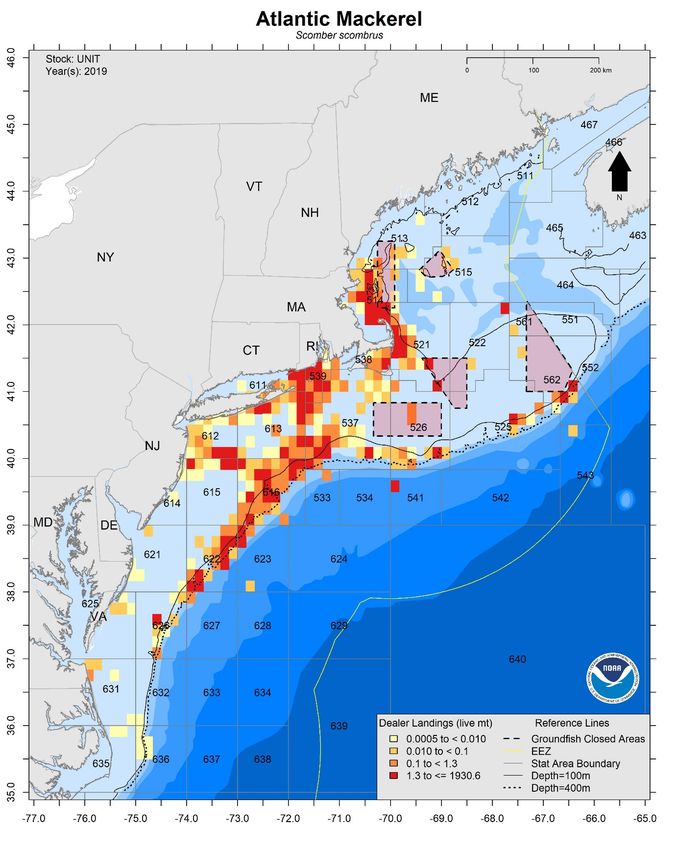
landings by gear type. Figures 6/7 describe the location of 2018/2019 mackerel landings.
Figure 1. Total catch of northwest Atlantic mackerel between 1960 and 2019 by all known sources. U.S.
recreational catch represents recreational landings plus discards, Canada represents Canadian landings
(discards are not available), and other countries represents landings by all other countries.
3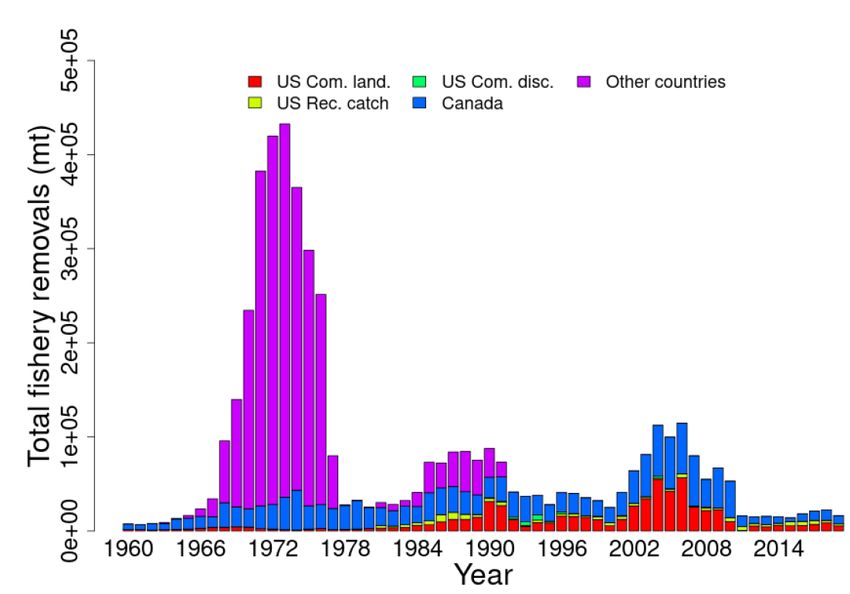
Figure 2. U.S. Mackerel Landings and Nominal Mackerel Ex-Vessel Values 1996-2020. Source: NMFS
unpublished dealer data.

THIS SPACE INTENTIONALLY LEFT BLANK

                                               4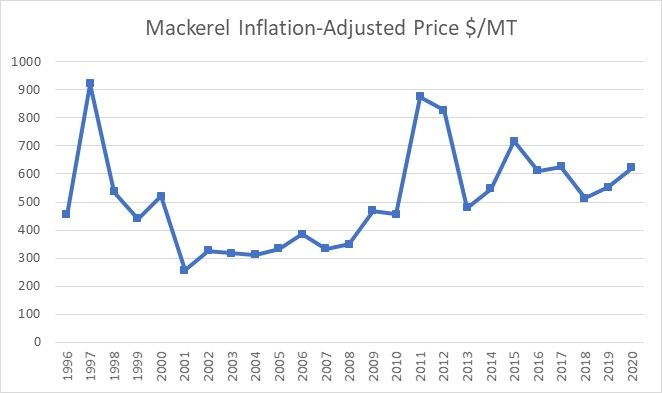
Figure 3. Ex-Vessel Mackerel Prices 1996-2020 Adjusted to 2020 Dollars Source: NMFS unpublished
dealer data.

THIS SPACE INTENTIONALLY LEFT BLANK

                                                5
Figure 4. U.S. Preliminary Mackerel landings; 2020 in blue, 2019 in yellow-orange. Source:
https://www.fisheries.noaa.gov/new-england-mid-atlantic/commercial-fishing/quota-monitoring-
greater-atlantic-region.
6Figure 5. U.S. Preliminary Mackerel landings; 2021 in blue, 2020 in yellow-orange. Source:
https://www.fisheries.noaa.gov/new-england-mid-atlantic/commercial-fishing/quota-monitoring-
greater-atlantic-region.
Table 1. Commercial Mackerel landings (live weight) by state in 2020. Source: NMFS unpublished dealer
data.
State Metric_Tons
MA 3,991
NJ 2,412
RI 1,171
ME 436
Other 29
Total 8,039
7Table 2. Commercial Mackerel landings (live weight) by gear in 2020. Source: NMFS unpublished dealer
data.
GEAR gmt
TRAWL,OTTER,BOTTOM, 3,151
FISH
TRAWL,OTTER,MIDWATE 2,440
R
TRAWL,OTTER,MIDWATE 1,369
R PAIRED
PURSE SEINE, OTHER 408
LONGLINE, BOTTOM 251
Other 420
Total 8,039
8Figure 6. Approximate Primary 2018 Mackerel Catch Locations (from dealer and VTR data)
9Figure 7. Approximate Primary 2019 Mackerel Catch Locations (from dealer and VTR data)
THIS IS THE END OF THE DOCUMENT
10You can also read