Atmospheric muons as an imaging tool - Lorenzo Bonechia,1, Raffaello D'Alessandrob,1,2, and Andrea Giammancoc,3
←
→
Page content transcription
If your browser does not render page correctly, please read the page content below
Atmospheric muons as an imaging tool
                                                               Lorenzo Bonechia,1 , Raffaello D’Alessandrob,1,2 , and Andrea Giammancoc,3
                                                                 1
                                                                     Istituto Nazionale di Fisica Nucleare, Sezione di Firenze, Via G. Sansone 1,
                                                                                                    I-50019 Sesto Fiorentino, Italy
                                                                  2
                                                                    Università di Firenze, Dipartimento di Fisica e Astronomia, Via G. Sansone 1,
                                                                                                    I-50019 Sesto Fiorentino, Italy
                                                   3
                                                     Université catholique de Louvain, Centre for Cosmology, Particle Physics and Phenomenology, Chemin du Cyclotron
                                                                                                2, B-1348 Louvain-la-Neuve, Belgium
arXiv:1906.03934v1 [physics.ins-det] 10 Jun 2019

                                                                                                       June 11, 2019

                                                                                                           Abstract
                                                             Imaging methods based on the absorption or scattering of atmospheric muons, collectively named un-
                                                         der the neologism “muography”, exploit the abundant natural flux of muons produced from cosmic-ray
                                                         interactions in the atmosphere. Recent years have seen a steep rise in the development of muography meth-
                                                         ods in a variety of innovative multidisciplinary approaches to study the interior of natural or man-made
                                                         structures, establishing synergies between usually disconnected academic disciplines such as particle physics,
                                                         geology, and archaeology. Muography also bears promise of immediate societal impact through geotechnical
                                                         investigations, nuclear waste surveys, homeland security, and natural hazard monitoring. Our aim is to
                                                         provide an introduction to this vibrant research area, starting from the physical principles at the basis of
                                                         the methods and reviewing several recent developments in the application of muography methods to specific
                                                         use cases, without any pretence of exhaustiveness. We then describe the main detector technologies and
                                                         imaging methods, including their combination with conventional techniques from other disciplines, where
                                                         appropriate. Finally, we discuss critically some outstanding issues that affect a broad variety of applications,
                                                         and the current state of the art in addressing them.

                                                     a
                                                         e-mail: lorenzo.bonechi@fi.infn.it
                                                     b
                                                         e-mail: candi@fi.infn.it
                                                     c
                                                         e-mail: andrea.giammanco@uclouvain.be (corresponding author)

                                                                                                                1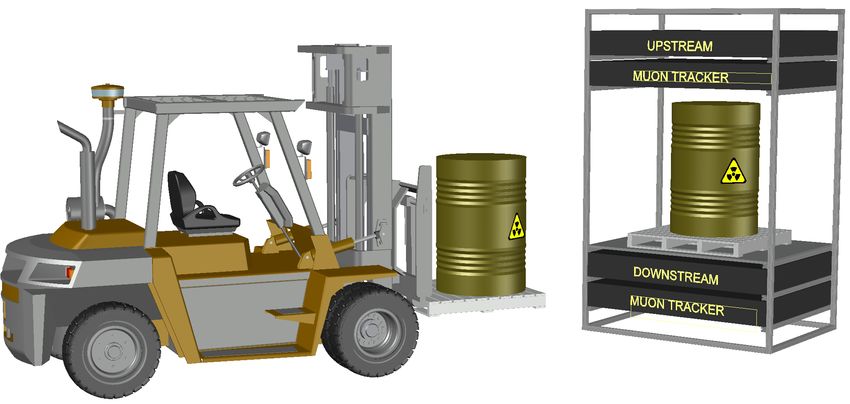
1      Introduction
The muon (µ) is an elementary particle with quantum numbers in common with the electron but roughly
200 times its mass, abundantly and freely produced in the interaction of primary cosmic rays with the upper
atmosphere.
     While opinions diverge on what should be considered the date of discovery of the muon [1], no doubt
remained after a crucial experiment about the existence of a new charged particle with mass intermediate
between the electron and the proton, published in 1937 [2]. That was the culmination of years of systematic
investigations [3] to understand features of sea-level cosmic radiation that could not fit in the simple theoretical
framework of that time, which assumed all elementary charged particles to be protons, electrons, or the recently
discovered positron. Because of a coincidental agreement in mass, the muon was initially identified with the
particle postulated by Yukawa to explain the finite range of the nuclear binding force. However, experiments
by Conversi, Pancini and Piccioni between 1943 and 1947 demonstrated that the muon has negligible or no
nuclear interactions with matter [4], in stark contrast with its interpretation as a strong nuclear force mediator.
Finally, in 1947, Lattes, Muirhead, Occhialini and Powell demonstrated that cosmic muons are produced from
the decay of hadrons [5], the most abundant of which (the charged pion, π ± ), with mass just slightly larger than
the muon, fits the role of the mediator predicted by Yukawa. This led to Rabi’s famous quip “Who ordered
that?”, referred to the muon. Today we know twelve fundamental matter particles [6], neatly classified in three
generations that only differ by mass, with the muon belonging to the intermediate one; but Rabi’s question is
still waiting for an answer (its generalized modern version is known as “the flavour puzzle” [7].)
     Several of the features that one century ago helped to clarify this particle’s nature are precisely why atmo-
spheric muons are such a good tool for imaging large scale structures (for which, through this document, we
employ the neologism “muography”): absence of strong nuclear interactions, negligible probability of producing
electro-magnetic cascades (up to very large momenta, ≈ 500 GeV 1 ), and relatively small energy losses by
ionization.
     To the best of our knowledge, the very first practical application of muography dates back to the 1950’s,
when George studied the feasibility of employing a Geiger counter telescope to infer the ice thickness above a
tunnel in an Australian mine [8]. No directional information was available at the detector level, but it could be
moved along the tunnel, and the observable of interest was the dependence of the muon flux on the position.
The first application in archaeology came in the 1960’s, by a team led by Alvarez [9]. Their muon telescope was
composed of planes of spark chambers and was able to reconstruct particle trajectories, a feature that is taken
for granted nowadays but that, as we saw, was missing in George’s setup one decade earlier.
     More applications followed. A simulation study in 1979 argued the feasibility of muography for mining
exploration [10], and compared the traditional telescope geometry (appropriate for easily accessible tunnels)
with a set-up that could fit in narrow boreholes. Several other geophysical applications have been explored,
including the imaging of mountains (with the first example in 1995 by Nagamine’s team [11]), which since the
beginning had been motivated by future applications to volcanoes. Probably also because of the immediate
societal relevance of volcano monitoring in Japan, Japanese teams have been at the forefront of muography
since the 1990’s. A major breakthrough was the first application of muography to predict the eruption sequence
of Mount Asama, Japan, during its 2009 unrest [12]. Nowadays, volcanology is probably muography’s most
developed area of investigation. The list of volcanoes already actively studied includes Asama, Iwodake and
Sakurajima in Japan, Vesuvius, Etna and Stromboli in Italy, as well as Puy de Dôme and La Soufrière de
Guadeloupe in France. While all the applications described thus far are based on the attenuation of the muon
flux in traversing the target, an important breakthrough was the first exploitation in 2003, by Borozdin et al. [13],
of the large-angle scattering of the muons due to the intense Coulomb field of nuclei, which allows to discriminate
materials based on their atomic number and opens applications in the nuclear sector and in homeland security.
Muography is nowadays a booming research area, with a steadily growing trend of publications since the
beginning of this century and more than 25 articles per year in the last few years2 .
     Several excellent reviews are already available on this subject. Procureur [15] pays some attention to detector
considerations, while Kaiser [14] includes an interesting discussion on commercial aspects. Carloganu and
Saracino [16] and Tanaka [17] elaborate on volcano studies and in particular, respectively, on the lessons learned
in Europe and Japan. Checchia [18] specifically focuses on scattering-based muography. The present article
aims at providing a fresh perspective on recent trends, elaborating in particular on the challenges to be overcome
in order to make the transition, in all its diverse areas of application, from “proof of principle” to an established
imaging tool.
     This article is structured as follows: Section 2 aims at a pedagogical summary of a few physical properties
of atmospheric muons that are at the basis of muography. Section 3 provides a snapshot of the current trends
    1 Tosimplify the notation, as customary in particle physics, we drop the /c factor in the momentum units.
    2 Asreported in Fig. 1 of Ref. [14], with data from the University of Glasgow Library. It can be argued that those numbers are
most likely on the conservative side, given the amount of workshops, seminars, and conferences that only publish the slides of the
various interventions.

                                                                2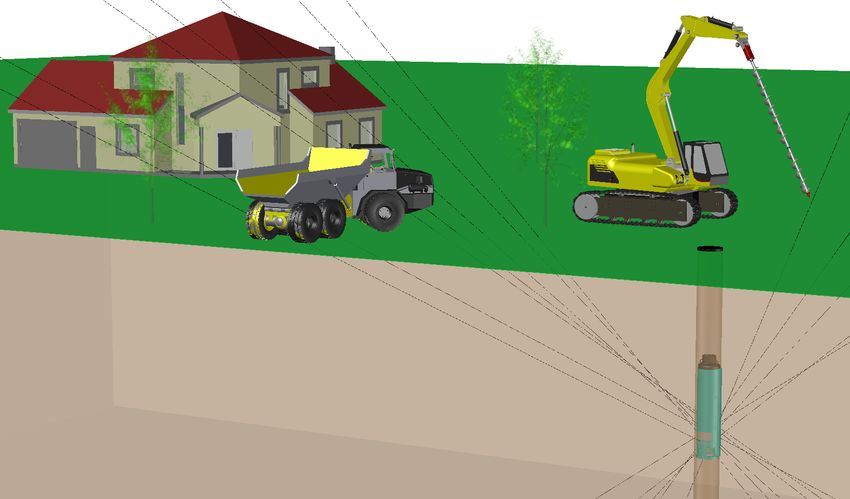
in muography via a non-exhaustive list of recent applications. Section 4 outlines the main detector design
choices and elaborates on their rationale. Section 5 presents methodological considerations related to image
reconstruction. Section 6 addresses some of the general issues affecting muography research, such as background
reduction and estimation, momentum bias, and accuracy/speed trade-off in simulations. Finally, we conclude
in Section 7 by summing up the lessons learned, and providing our personal outlook of this vibrant area of
research and development.

2     The Physics of Muography
The muons that we exploit for imaging are called “atmospheric” because they originate within the atmosphere
of our planet (typically 15 km above the sea level [6]), or “cosmic” because of their origin. The primary cosmic
rays entering the atmosphere (mostly protons, with small fractions of heavier nuclei, electrons, positrons and
antiprotons) collide with the atmospheric nuclei (mostly Nitrogen and Oxygen), producing hadrons that in turn
can further interact with the atmosphere, unless they decay. Pions (π + , π 0 , π − ) and kaons (K + , KS0 , KL0 , K − )
are abundantly produced in these collisions, and when they are charged their dominant decay modes produce
muons [6]: π ± → µ± νµ (ν̄µ ) (≈ 99.99% of the times) and K ± → µ± νµ (ν̄µ ) (≈ 64% of the times, with a further
3% where a π 0 is also produced); when not decaying directly into muons, charged kaons mostly decay into
two or three pions (π ± π 0 , π ± π ± π ∓ or π ± π 0 π 0 ), which in turn decay into muons if they are charged. Also the
long-lived neutral kaons produce muons ≈ 27% of the times via the decay channel KL0 → π ± µ∓ ν̄µ (νµ ).
    Muons are unstable, decaying into electrons and neutrinos (µ+ → e+ ν̄µ νe and µ− → e− νµ ν̄e ) with a lifetime
τ ≈ 2p  µs at rest, butpa well-known relativistic effect dilates their observed lifetime by the Lorentz factor
γ ≡ 1/ 1 − (v/c)2 = 1 + (p/mµ c)2 . Due to the relative hardness of the atmospheric muon spectrum, most
of them reach sea level: for example, a momentum of 4 GeV (about the peak value of the muon momentum
distribution) corresponds to γ ≈ 20, which naively yields3 a decay length l = γβcτ ≈ 24 km. Most of the
Earth’s atmosphere is contained within 16 km, and as said above most atmospheric muons are produced at
a height of around 15 km. At sea level, muons constitute the vast majority of the charged particles, arriving
at a rate of roughly 100 Hz/m2 . Most of the other charged particles produced in the cosmic shower, that are
able to reach the sea level are protons, electrons and positrons; although they do not decay, these background
particles disappear or lose energy much more quickly than muons because of their stronger interactions with
matter: nuclear interactions affect protons but are absent for muons; energy loss by bremsstrahlung depends
on 1/m2 and is therefore 40,000 times smaller for muons than for electrons and positrons; moreover, positrons
easily annihilate with the electrons of the atmospheric atoms. For these reasons, the combined background
flux is much smaller than the muon flux. Above 1 GeV, the muon flux at sea level is at least two orders of
magnitude larger than any other charged particle [6], while the contamination of e± grows significantly when
the momentum cut-off of the apparatus is lower [19, 20, 21, 22].
    The angular distribution of the atmospheric muon intensity is found to be approximately proportional to
cosn θ, where θ is the zenith angle and n ≈ 2 [23], with mild dependence of n on energy, latitude, altitude and
depth [24]. This has the practical implication that much longer exposure times are needed when it is necessary
to use muons at large zenith angles (which is typically the case when studying mountains and volcanoes from
a distance) with respect to cases where the large flux of vertical muons can be exploited4 .
    Ionization and atomic excitation are the dominant energy loss mechanisms for muons in matter up to
momenta around 500 GeV. The momentum spectrum of atmospheric muons peaks at around 4 GeV; at those
momenta, their mean energy loss rate (− dE      dx ) is close to the minimum of the Bethe function, that in the regime
of relevance (and neglecting some small corrections) we can write as:

                                                                      β2

                                  dE      Z         1
                               −        ∝ · ρ · 2 · ln K ·                   + corrections  ,                        (1)
                                   dx     A        β                1 − β2
where Z and A are the atomic and mass number, respectively, of the element characterising the traversed
material5 and ρ is its density, while β = v/c is the relativistic speed of the muon, and K = 2me c2 /I 2 where
I is the mean excitation potential, of order electronvolts, and me is the electron mass (me c2 = 511 keV). In
the approximate formula of Eq. 1, the dependence on the traversed material comes through ρ, Z, A and K. It
is important to remark that for intermediate-mass elements, and in particular for those that compose most of
the mass of the Earth’s crust, the Z/A ratio deviates little from a 1/2. The constant K depends on I which
   3 A more realistic calculation of l, out of the scope of this discussion, should consider the continuous slow-down of the muons

while they lose an energy of up to 2 GeV by ionization (see discussion below and Eq. 1), and the non-homogeneous density of
the atmosphere. For p = 2.4 GeV/c, simulations yield l ≈ 8.4 km [6] while our naive calculation yields 15 km. The larger the
momentum, the better this approximation works.
   4 For example, the difference in flux and therefore exposure time between vertical and horizontal orientation was found to be

around a factor of eight with the detector geometry of Ref. [25]. In general, this ratio depends on the angular acceptance of the
detector, over which the angular distribution of the incoming muons is integrated.
   5 In mixtures and compounds, the average energy loss rate can be approximated by a weighted average.

                                                                3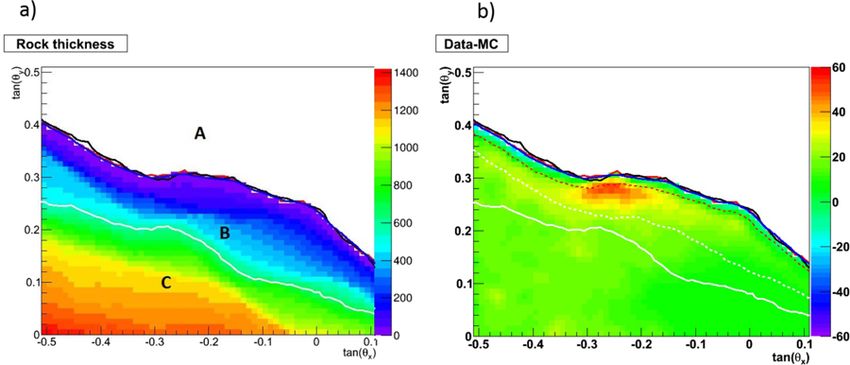
in turn has an approximately linear dependence on Z [6]; the fact that it only appears logarithmically in the
formula mitigates the practical importance of its variation. In conclusion, with the only exception of hydrogen,
the relationship between the energy loss rate and ρ can be considered quasi independent of other properties of
the traversed material.
    Thus, the range of a muon is obtained by inverting and integrating Eq. 1 from the energy at the entry
point (where β ≈ 1) up to where the muon is at rest (β = 0). In practice, what is directly measured by a
muon detector is the muon flux coming from the various directions within its acceptance; compared to the
“free-sky” flux, this yields the probability for a muon to be absorbed by a given target along a certain line
of sight (also known as “muon transmission”), which is the basis for absorption-based muography (AM), also
quoted as transmission muography. This can be directly interpreted    R in terms of “opacity” along that line of
sight, defined as the density integrated along a path length: O = ρ(x)dx. A convenient unit for opacity is
“meters water equivalent” (mwe), with a conversion factor 1 mwe = 100 g/cm2 ; the energy loss of an energetic
muon is about 0.2 GeV/mwe.
    In cases where the thickness along the lines of sight of the detector is known, e.g. when imaging a target
whose surface is precisely known, the opacity along a direction can be turned into a measurement of the average
density along that direction. Conversely, some applications actually have the opposite goal, that of measuring
the boundaries of a volume (e.g. the overburden of a tunnel), in this case a fair guess of the average density
must be used as input. Due to the presence of β in Eq. 1, the AM method also needs as input the momentum
spectrum of the atmospheric muons.
    As shown by Rutherford in 1911 [26] using very thin targets, charged particles traversing matter are deflected
by Coulomb scattering due to the intense electric fields near nuclei. The probability distribution of the angular
deflection ∆θ for a single scattering follows Rutherford’s Law, P (∆θ) ∝ 1/ sin4 (∆θ/2). Most deflections are
small, so after traversing a macroscopic amount of material the actual distribution features an approximately
Gaussian core, as expected from the central limit theorem, asymptotically reaching Rutherford’s Law in the
tails of P (∆θ) due to the rare large-scattering events. The Gaussian approximation gives a good description for
98% of the actual distribution [6], with a standard deviation that in a broad range of Z and for not-very-thin
targets is well approximated by [27]:
                                                      r
                                         13.6 MeV        x                   x
                               σ(∆θ) =              ·      · 1 + 0.038 · ln          ,                         (2)
                                           β·c·p        X0                  X0 · β

where p is the muon momentum, x is the path length from entry to exit, and X0 is the radiation length. Very
accurate estimations of 1/X0 exist [28], but for sake of illustration we present here a particularly compact
formula (accurate to better than 2.5% for all elements except helium [29]):

                                         1      Z(Z + 1)       287
                                             ∝           · ln √      .                                   (3)
                                        X0         A             Z
It is apparent from Eqs. 2 and 3 that the root mean square (RMS) of the deflection angle is directly related to Z;
this is the basis for scattering-based muography (SM), which has been exploited since 2003 [13] for applications
where contrast is sought between a high-Z material and a lower-Z background (e.g., fissile nuclear material
hidden within scrap metal, or heavy metal within concrete). In a 10 cm thick layer, the RMS scattering angle
for a 3 GeV muon is 2.3 milliradians in water, 11 milliradians in iron, and 20 milliradians in lead [13].
     The average muon deflection h∆θi due to Coulomb scattering is always zero, independently of the type
and amount of material traversed, which only affects the width of its distribution. Reference [30] proposes to
exploit this feature for the long-term monitoring of the stability of a building. The method requires two muon
telescopes, positioned respectively on a structural element of the building (the fixed reference system) and on
the point of the building to be monitored. Any deviation in the apparent h∆θi appearing with time would
indicate a deformation of the structure.
     Both types of muography, AM and SM, rely on the statistical distributions of large samples of muons (e.g.,
one cannot deduce the presence of a high-Z material from the trajectory of a single muon). Reference [15]
illustrates the relative merits of the absorption and scattering methods by listing the survival probability and
RMS scattering angle σ(∆θ) for multi-GeV muons when traversing a few hypothetical targets. One of the
examples concerns the muographic image obtained for the same 10 × 10 × 5 cm3 lead brick using the two
methods with different exposure times, and it shows that for this type of high-Z target, SM needs an order of
magnitude less time than AM to achieve a recognizable image, and that it yields an image with better definition.
As a general rule, AM is a powerful method for very large targets, while SM is more appropriate for small and
medium sized targets.

                                                        4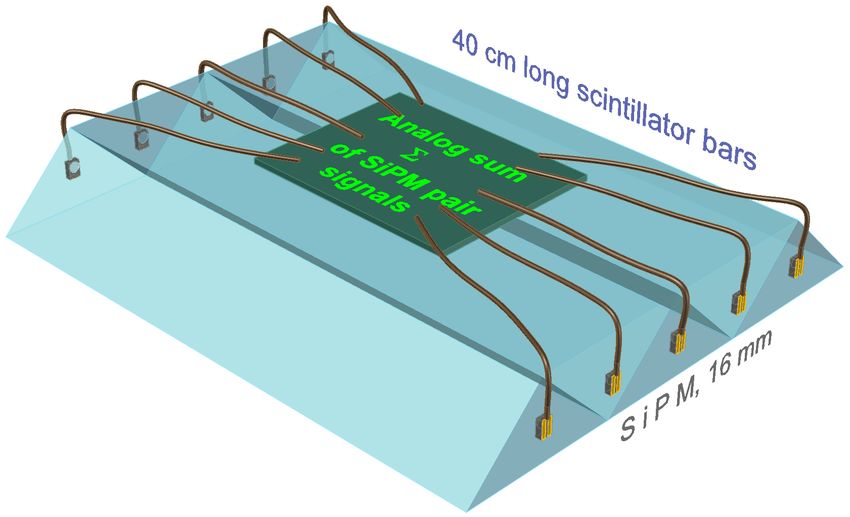
3     Applications
In this section, we review recent developments in the application of muography methods in geosciences, archae-
ology, civil engineering, nuclear safety, and security, without pretense of exhaustiveness but with the intention
of giving a comprehensive overview of the field, setting the stage for the main methodologies presented in
Sections 4 and 5.

3.1     Geosciences
The typical geophysical applications of muography feature very large targets, for which AM is the most appro-
priate technique. Muography complements traditional survey methods by offering directional sensitivity to the
in-depth structure of large objects. Unfortunately, some of the most pressing questions in geology require that
narrow structures in the deepest part of a O(km) target be resolved, even at low elevation angles where the
muon flux is less intense. In these conditions, not only the signal is faint, but it can also be overwhelmed by
backgrounds that can limit the measurements to an insurmountable “systematics wall” (i.e., uncertainties that
do not decrease with more data).
    Within this context, one of the most widespread applications of AM is the imaging of volcanoes and several
partnerships with volcanologists have been established by the physicists involved. Different volcanoes have
attracted the attention of the muography community for their intrinsic volcanological interest and/or for their
natural hazard potential. As this technique is still very young, the choice of the target is often driven at least
in part by reasons of opportunity, e.g. geographical proximity to both a strong particle physics laboratory and
a strong volcanology institute. This is often the case in countries where both communities are well developed,
explaining the number of activities in Japan [31], Italy [32], and France [16, 33].

Figure 1: (a) Muography of the crater region of Stromboli volcano as seen by an emulsion detector. The color
scale is the rock thickness in meters. (b) Difference between the observed muon flux and the one expected from
Monte Carlo simulation. Color scale represent muons counts. Reproduced from [34].

    Static pictures using muon data integrated over several months can be used to investigate the inner com-
position of a volcano providing information on the location of volumes of rocks with different densities, that
is essential to the understanding of the volcano’s history. A recent example is the first muographic imaging
of Mt. Stromboli [34], a strato-volcano of the Aeolian archipelago (Italy) with a height of about 920 m above
sea level, characterized by the emission of huge amounts of gas and a continuous ongoing eruptive activity
named “Strombolian” in its honour. The measurement was carried out with emulsion detectors, particularly
appropriate to the logistic challenges 6 for the reasons explained in Sec. 4.2, taking data for five months. This
study found a significant low-density zone (30 − 40% contrast with respect to bedrock, see Fig. 1) at the summit
of the volcano. This result is relevant for geophysics and hazard estimation, as the structural setting of this
part of the volcanic edifice controls the eruptive dynamics and the stability of the “Sciara del Fuoco” slope,
which is affected by recurrent tsunamigenic landslides.
    Hazard concerns are also a major motivation for the study of Mt. Vesuvius, a strato-volcano near Naples
(Italy), world-famous for its catastrophic eruption in 79 AD that obliterated the ancient Roman cities of Hercu-
laneum and Pompeii and was vividly described by Pliny the Younger (hence the name “Plinian” to indicate one
   6 The access to the optimal observation point is so impervious that the detector had to be pre-assembled at a lower altitude and

then lifted up to the observation point by helicopter.

                                                                5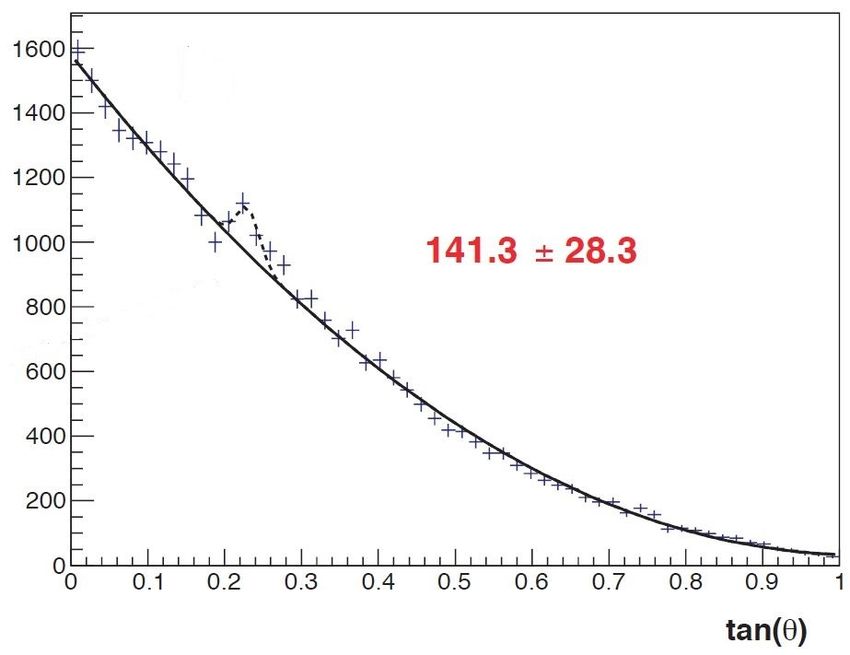
of the major eruptive classes). Nowadays more than half million people reside in the “red zone” surrounding
Vesuvius, defined as being at high risk of pyroclastic fallout in case of a new Sub-Plinian eruption [35]. Mt.
Vesuvius’ first 2D muographic images were produced by the MU-RAY project [36] using three x − y layers of
scintillator bars. To reduce backgrounds, the MURAVES project [32, 37], MU-RAY’s successor, added a fourth
layer and a 60 cm lead absorber between the third and fourth layer, complemented by time-of-flight (TOF)
measurement (see Sec. 6.1). MURAVES aims to reach sufficient precision to resolve internal discontinuities of
about 10 m in the upper part of Mt. Vesuvius.
    The Puy de Dôme, a dormant volcano near Clermont-Ferrand (France), is a lava dome 1465 m high that
is part of a long volcanic chain. It constitutes an excellent “standard candle” to test muography detectors
and methods thanks to the abundance of reference data from standard geophysical methods, and also for the
relatively accessible logistic support. This opportunity has been exploited for the development of the TOMUVOL
telescope [38, 39, 40], composed of planes of glass RPC detectors (see Section 4.3) originally developed in the
context of the particle physics CALICE collaboration (R&D for a detector to be operated at future high-
energy linear colliders). A joint measurement campaign of the Puy de Dôme in 2013 [41] by the TOMUVOL
and MU-RAY collaborations with their detector prototypes, based on two different detector technologies with
complementary merits, was crucial to quantify the challenges and prioritize their further developments. They
found that, with their detector setups at that time, the backgrounds overwhelmed the signal for opacities larger
than 500 mwe from 1 km away; the further characterization of these backgrounds has led to the design of
improved detectors with higher momentum threshold and TOF measurement [32], with the goal of a robust
muographic imaging of kilometer-scale volcanoes.
    Volcanoes are very dynamic systems, therefore nuclear emulsions, in spite of their superior resolution and
logistic advantages, are less popular than detector technologies that allow to time-stamp the observed muons.
An obvious use case is hazard prevention: a temporal evolution in the muon flux through the core of a volcano
may be potentially listed as an eruption precursor. The data from a muography campaign on Mt. Asama during
its 2009 unrest [12], showing a temporal variation of the observed muon flux through the crater region that
correlated with magma ascensions and descents, were reported to the Japan Meteorological Agency, which used
them as one of the inputs for eruption forecast purposes [42]. Moreover volcanoes can have rich hydrothermal
systems, affecting the density distributions close to their surfaces. This is another topic of relevance for hazard
prevention, as hydrothermal fields of moderately active volcanoes have an unpredictable behavior; hazardous
events that can develop rapidly, with no known precursory signal that is clearly identified as a potential warning
of imminent danger. Muographic time series have been used in the study of the hydrothermal system of
La Soufrière de Guadeloupe [43], an active volcano in the Lesser Antilles (France) that has been extensively
studied by the DIAPHANE collaboration [44] taking data with several identical muon telescopes based on
scintillators from different observation points. In a recent study [45], combining muography with seismic noise
monitoring, they were able to detect with an unprecedented space and time resolution the increase of activity
of a hydrothermal spot located 50 to 100 m below the summit, at timescales of few hours to few days.
    Mount Etna, near Catania (Italy), is one of the tallest and most active volcanoes in the world, with a
height of more than 3 km and a basal diameter of 40 km. Its eruptions occur through one of its four summit
craters or from vents or fissures on its flanks. In spite of being one of the most studied volcanoes in the
world, the geometry of the shallow conduit network feeding its four summit craters is still largely unknown [46].
Etna’s size makes it a very challenging target for muography, but a few teams have investigated the feasibility
of the method with various approaches and targeting different craters. The first imaging was performed in
2010 [46], targeting the South-East Crater, 240 m high with a base diameter of 500 m, using an early version
of the DIAPHANE telescope. Recently, the MEV (Muography of Etna Volcano) project reported preliminary
results [47] with their dedicated high-resolution telescope, also based on scintillators. In this first study, the
extinct Monti Rossi crater was imaged to be used as a reference in view of future studies of the active North-
East Crater. The authors remark that the background-reduction approach based on large quantities of lead is
unfeasible for telescopes near the summit zone of Mt. Etna, where harsh conditions limit the access to heavy
equipment. Another muography team [48, 49] has been active on Mt. Etna, with a very different detector
technology based on Cherenkov light detection (see Section 4.4). The main advantage of a Cherenkov detector
is the negligible background contamination (Section 6.1), that compensates the drawback of less statistics due
to the larger intrinsic momentum threshold (p > 5 GeV, to be compared with the maximum at around 4 GeV
of the atmospheric muon spectrum). This method is being developed with the existing ASTRI-Horn telescope,
a prototype built in the context of the CTA (Cherenkov Telescope Array) project for astrophysics [50]. ASTRI-
Horn is located at Serra La Nave, 5 km from the South-East Crater, but the authors advocate the construction
of dedicated movable telescopes [49], in order to reach different observation points.
    Besides volcanology, the interest of muography has already been explored in several other Geoscience appli-
cations. These include the monitoring of groundwater and saturation levels for bedrocks in landslide areas [51],
fault lines [52, 53], hydrogeological rock density perturbations [54], river banks damaged by animal activity [55],
ice-filled cleft systems in steep bedrock permafrost [56], and carbon capture storage sites [57, 58], as well as the

                                                         6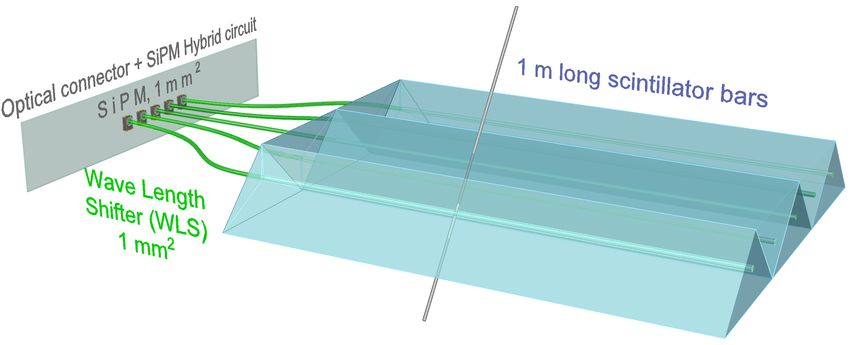
exploration of natural caves [59, 60] and searches for minerals [10, 61, 62]. Being impossible to make justice of
so many applications, we decided to elaborate only on a very recent development related to glaciology, probably
less known because of its novelty 7 : the study of the bedrock profiles underneath alpine glaciers [63, 64], using
nuclear emulsion detectors installed in three observation points underneath the targets in a railway tunnel, with
the methodology described in Ref. [65]. The AM measurement yields, for each detector, the average density
hρi along a line of sight; therefore, the position of the ice-rock transition surface is derived from the formula
hρi = ρrock · x + ρice · (1 − x) (following Ref. [66]), where x is defined as the fraction of rock between the
observation point and the surface of the glacier along the line of sight. In order to minimize the model assump-
tions, the average bedrock density ρrock is extracted in situ from angular regions not covered in ice, and its
measurement is validated by comparing it with a set of rock samples collected from near the detectors along the
railway tunnels and from the surface. Reference [63] provided the first application of the method by studying
the Aletsch glacier, in the Central Swiss Alps, measuring the shape of the ice-bedrock interface up to a depth of
50 m below the ice surface. They found a parallel orientation of the bedrock with respect to the glacier’s flow
direction, which implies that the ice has passively slid on the bedrock without sculpting it. The same team then
studied the Eiger glacier [64], 10 km away from the previous target, from different observation points within
the same railway tunnel, finding a breach (600 × 300 m) within the accumulation area where strong lateral
glacial erosion has cut nearly vertically into the underlying bedrock. This suggests that the Eiger glacier has
profoundly sculpted its bedrock in its accumulation area. Remarkably, the muography measurements for these
targets are more precise and less model-dependent than any of the data available from traditional methods.

3.2     Archaeology and Civil Engineering
Applications of muography in archaeology and in civil engineering share many commonalities. In both cases
the targets are man-made, and very often (but not always) the research questions that muography is called to
address are related to absence or presence of voids. The typical size of the targets is such that AM is usually
the method of choice [67, 44]; Fig. 2, from a recent study [68] with a portable muon telescope, illustrates how
the muon flux attenuation can be mapped to the internal geometry of a complex building. However, some
civil engineering applications in this area demand the ability to discriminate materials by Z, thus requiring the
SM method; examples include the survey of the content of a blast furnace [69, 70], the study of reinforcement
elements in the dome of Florence Cathedral Santa Maria del Fiore [71], and the measurement of the amount of
wear suffered by a steel-made pipe [72].

Figure 2: Example of muographic imaging of a building. (Left) Building picture; sketch of its inner structure
indicating the position of the detector (O) and the lines of sight of maximum (A) and minimum (B) integrated
density; and definition of the θ, φ coordinates. (Right) Muon attenuation map as measured from the detector
in O. Reproduced from [68].

    The very first muography application in archaeology has been Alvarez et al.’s imaging of Chephren’s pyramid
in Egypt [9]. Their study was inspired by the observation that the Second Pyramid of Chephren appears to have
a much simpler internal structure than the Great Pyramid built by Cheops (or Khufu), Chepren’s father; in
general, the complexity of the internal architecture of the pyramids had an increasing trend during the Fourth
   7 Precursors of this new research direction were the proposal for alpine permafrost studies suggested in Ref. [56], and in some

sense also the pioneering paper by George [8] already cited in the Introduction.

                                                                7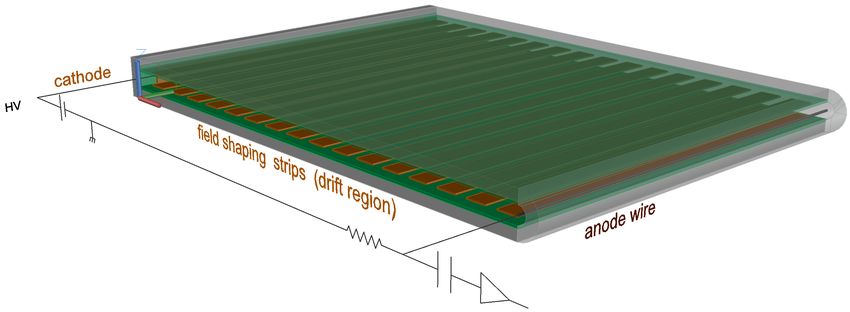
Dynasty until the sudden appearance of simpler designs starting with Chephren. The question that Alvarez
et al. sought to answer was: are there unknown upper chambers of significant size in Chephren’s pyramid
above the Belzoni Chamber? Their data, compared to a Monte Carlo simulation of the expected muon flux,
conclusively excluded that hypothesis.
    Decades later, the next pyramid to be surveyed with muography was the Pyramid of the Sun at Teotihuacan,
Mexico, built by the Aztecs about 1800 years ago [73, 74]. This pyramid is the third largest in the world, with
a height of 75 m and a square base of 225 × 225 m2 . One of the motivations for this study was the search
for inaccessible chambers that might hold the tomb of a Teotihuacan ruler. The detector was located in
a deep underground chamber underneath the pyramid, accessible only through a tunnel so narrow that the
muon telescope, 1.5 m3 in volume and composed of six layers of multi-wire chambers (Section 4.3), had to be
dismantled and then reassembled inside. Data taking started in the early 2000s, and the preliminary results
were released after more than a decade [73], reporting a very wide low-density volume in the Southern side,
which has been interpreted by some researchers as an indication that the structure of the pyramid might have
been weakened on that side and could be in danger of collapse [74]. First steps towards muographic surveys have
been made around 2010 also for the Mayan site of La Milpa in Belize [75, 76], where the target is a tree-covered
mound about 20 m high that is believed to hide a pyramid within; this is in fact, a typical case where standard
remote-sensing technologies such as ground-penetrating radar cannot be used [74], as they require flat terrains
free from rocks and roots to operate.
    Muography came back to Egypt in 2015, in the framework of the ScanPyramids project [77] which combines
several non-invasive techniques to survey Old Kingdom pyramids in search for unknown internal voids and
structures. Three muography teams, each using one of the three main detector technologies that will be
discussed in Sec. 4, have participated with simultaneous data taking. The highlight of the project has been the
recent discovery [78], through muography alone, of an unexpected large void inside the aforementioned Great
Pyramid of Giza, the oldest and largest in the Giza complex (139 m high and 230 m wide). Its three known
chambers (known as the subterranean chamber, the Queen’s chamber, and the King’s chamber) are connected
by several corridors, the largest being the Grand Gallery. The new void discovered by muography has a length
of at least 30 m and a cross section similar to the Grand Gallery. The data were accumulated for several months
with nuclear emulsions and scintillator-based telescopes installed in the Queen’s chamber and two gaseous-
detector (Micromegas, see Sec. 4.3) telescopes located outside of the pyramid. This complementarity was useful
for the 3D localisation of the void once the data from the three experiments were compared 8 ; the emulsion
detectors were positioned in two different locations, 10 m apart, allowing a stereoscopic image reconstruction
with this method alone. All three teams reported an excess in muon flux originating from the same position in
space, with statistical significance in excess of 5 standard deviations away from the null hypothesis (no void),
as shown in Fig. 3 for one of the telescopes located externally. The expected excess of muons in the angular
area corresponding to the Grand Gallery was used to validate the finding.

Figure 3: (Left) Illustration of the correspondence between the image observed in an external detector and the
face of the Great Pyramid; the yellow and red angular areas correspond to the unknown void and the Grand
Gallery, respectively. (Right) Event counts (black points with error bars) as a function of the horizontal angle
in the angular area indicated in yellow on the left. The solid curve is obtained from a model of homogeneous
material. The peak corresponds to an unexpected excess of muons in the data. Reproduced from [78].

    An unknown cavity of potential archaeological interest has also been discovered within Mt. Echia, in Naples
(Italy) [79, 80]. Mt. Echia is the site of the earliest settlement of the city of Naples in the 8th century BC.
    8 Anyway, for safety reasons, gaseous detectors would not have been allowed inside the tunnels by the Egyptian authorities. This

is one of the frequent logistic limitations of this technique, as discussed in Sec. 4.3. It may be remarked that this had not been an
obstacle, instead, for the similar detector assembled underneath the Pyramid of the Sun [73].

                                                                 8
It is a headland with a maximum altitude of about 60 m above sea level and mainly consists of yellow tuff,
a soft volcanic rock. In the course of history a very complex system of underground tunnels and cavities has
been excavated and used for a variety of purposes, including the so-called Bourbon Tunnel that was excavated
around the middle of the 19th century. First indications for the unknown cavity were reported in Ref. [79],
based on the data from a 26 days pilot run with the MU-RAY telescope [81]. The telescope, installed in the
Bourbon Tunnel with a rock overburden of about 40 metres, had been oriented vertically and with a shorter
distance between its planes with respect to its usage in volcanology. This result was confirmed, and the cavity
more precisely characterized in 3D, by a second data-taking campaign whose results are reported in Ref. [80].
In the second campaign, the MU-RAY detector took data from a different observation point, and the MIMA
portable telescope [82] from a third location. MIMA can be tilted with respect to the vertical direction, and
was oriented such to point towards the presumed location of the hidden cavity.
3.3 Nuclear safety and security
Applications in this area typically involve SM, as they usually require to distinguish heavy elements from a
background of lighter ones, and this was one of the prime motivations for the seminal paper [13] that launched
this method. In fact, the ability to distinguish between nuclear fuel (including spent fuel) and other metals is
crucial for various applications of this kind that are of extreme societal relevance.
Some applications require a very fast object detection (ideally less than a minute timescale), in order to have
a minimal impact on queuing schedules. Examples include cargo inspections for homeland security, in particular
the prevention of smuggling of nuclear material [13, 83, 62], as well as the search for radioactive material in
scrap metal for the metal recycling industry, which is confronted with hundreds of contamination incidents per
year, resulting in environmental issues as well as economic loss (a very expensive clean-up of the foundry itself is
needed after each incident) [70, 84]. Standard methods in these areas make use of so called “radiation portals”;
but these can fail if the radiation source is well shielded (in the first example, intentionally by the smuggler; in
the latter example, by the scrap metal itself, or by a heavy-metal casing); therefore, “muon portals” are being
proposed as a second line of defense, for further analysis of targets that are close to the alarm threshold [84]:
they have slower response than the radiation ones, due to the modest cosmic muon rate, but profit from the
unique penetration power of the muon. A few prototypes of such portals have been already built, typically
using drift tubes (Section 4.3) for muon tracking, although a recent proposal [85] makes use of silicon microstrip
detectors originally produced for the CMS experiment at the LHC. A muon portal is already in use since 2012
at the container port in Freeport (Bahamas) and is reported to have analyzed several thousand vehicles since
its installation, most of them shipping container trucks [86].
Muography is also being explored for safeguards applications related to the nuclear power industry. This
includes the inspection of dry storage casks for spent nuclear fuel [87, 70] to verify if the cask has been tampered
with, for example by determining if a bundle has been removed and either left empty or replaced with another
dense material. This is another case where muography has an edge over measurements of γ rays or neutrons
from the fuel itself, as the cask walls are obviously designed to provide a very effective barrier against those kinds
of radiation [88]. Another application with many similarities in the area of nuclear safety is the imaging of the
contents of nuclear waste containers and the quality assurance for nuclear waste treatment processes, as studied
for example in Refs. [89, 90, 91]. In this kind of applications, the rapidity of response is not as crucial as in
cargo inspections, so longer exposure times are acceptable. The size of the target is larger, meaning that larger
detectors are needed, and that AM can be considered alongside with SM, as investigated in Refs. [89, 70, 88].
Finally, nuclear reactors themselves can be imaged with cosmic muons. Several studies [92, 93, 94, 95]
have been motivated by the nuclear crisis at Fukushima Daiichi (Japan) caused by a 9.0-magnitude earthquake
followed by a tsunami in 2011. To this day, a radioactively contaminated area of 20 km radius around the
nuclear plant may only be entered under government supervision. A question of huge relevance for the clean-
up and decommissioning of the nuclear reactors is the location of the melted fuel, but direct access to the
reactor buildings is hindered by radiation levels of order mSv/h, which motivates muography as a safe way to
image the reactor cores from outside the buildings. At the same time, this also poses very specific challenges
to the detectors, as the large flux of γ rays from 134 Cs and 137 Cs induces a large number of individual hits
that produce a significant combinatorial background, motivating studies of the optimal shielding thickness [92]
and the development of novel time-coincidence logic circuits to minimize accidental coincidences of γ-induced
hits [94]. Uranium is at the same time one of the densest metals (ρ = 19.1 g/cm3 ) and the natural element with
largest atomic number (Z = 92); but fuel pellets contain uranium oxide mixed with other materials and sealed
into zirconium alloy tubes, thus the average density of a fuel rod is only about 2.6 g/cm3 , which attenuates the
muon flux only 2% more than water. This poses a tough challenge when trying to distinguish the reactor core
from the surrounding water through the building walls with AM. On the other hand, SM can achieve an image
contrast of about 30% with respect to water [92], but it is not trivial to deploy large detector set-ups, that
have a useful geometrical acceptance, in such a highly contaminated site. Results of muographic campaigns
performed between 2015 and 2017 have been reported for some of the damaged reactors [96, 97, 98], using AM,
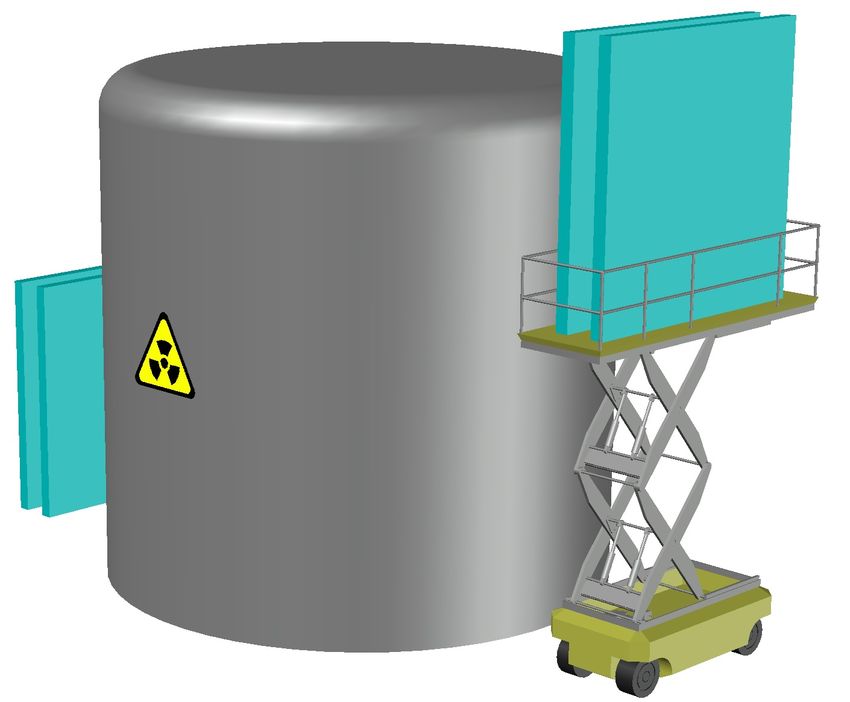
9Figure 4: Detector geometry depends on the application. A few examples are shown in the figure (clockwise
from top left): cargo inspection, nuclear storage inspection, borehole application for underground imaging, and
scan of a large open air-structure (e.g. a pyramid).
showing that the fuel had melted and dropped from its original position within the core.
4 Detectors for muography
Given the variety of applications, detectors for muography usually have to satisfy many requirements that are
not always essential or even of interest in mainstream particle physics. Typically, a muography particle detector
should be rugged and capable of being operated remotely with minimal intervention. Power consumption can
be a very important issue depending on the deployment site. As a bonus, the low event rate implies that the
data rate and speed of the data acquisition (DAQ) and front-end (FE) electronics do not constitute a critical
issue. In general, different muographic applications require different detector geometries and different detection
technologies. Thus, a large variety of muon detectors have been proposed and built during the last few decades,
with only few common features between them. One of these is the inability of measuring the muon momentum
on a per-particle basis, although this would be very desirable and possibly a major breakthrough for muography.
If the detector system is intended for SM, the muon trajectory must be reconstructed with high accuracy
(usually 1 mrad or better resolution) before and after the passage through the target being investigated. A
typical detector geometry is sketched in Fig. 4 (top left), with one of the two tracking systems above (upstream)
and the other underneath (downstream) the target. This arrangement exploits the more abundant muon flux
from the zenith, thus shortening the data acquisition time. This is the case for example of muon portals designed
for homeland security, see Sec. 3.3, where data must be acquired in the shortest time possible. However, the
optimal geometry for specific use cases can vary, as shown for example in Ref. [87] where the upstream and
downstream tracking systems are positioned on the sides of a large cylindrical cask of spent nuclear fuel (Fig. 4,
top right). Due to the limited geometrical factor of such an ensemble, the detectors tend to be relatively large
(2 − 10 m2 ) in order to maximise muon acceptance.
Where AM is the chosen technique, e.g. for imaging of large man-made structures (≈ 10 − 100 m), or very
large targets such as volcanoes, a relatively small (1 − 2 m2 ) detector can be placed laterally to the target, as
sketched in Fig. 4 (bottom left). The typical detector configuration is in the form of a “muon telescope” composed
of position-sensitive layers, installed at a certain distance from the target. Since the multiple scattering angle is
not measured, the angular resolution can be limited to 10 mrad or more. For a given X-Y spatial resolution of
a single detection plane, the angular resolution of a telescope mostly depends on the distance between the first
and last plane. A greater distance improves the angular resolution but decrease the acceptance of the telescope.
10Figure 5: Three possible scintillator profiles for a position sensitive layer. (Top) Square or rectangular bars of
the appropriate width are just placed side by side and readout digitally. (Middle) A variant of the previous
design (tested in MIMA [82]) that, with the same number of readout channels, increases the resolution by a
factor two at the cost of a thicker (and more expensive) detection layer and of a more complex coordinate
reconstruction. (Bottom) Triangular-section bars (as in MURAVES [37]) allow the use of a CoG algorithm
to improve spatial resolution (that depends on scintillator light yield and FE electronics noise) with the same
number of readout channels.
When a muography is required of an underground target, this telescope geometry can only be exploited in
the presence of tunnels of sufficient size below the target. When a suitable tunnel is not in place, given the high
cost of drilling or excavating underground, absorption muography detectors have been proposed and built, that
can be inserted in boreholes (Fig. 4, bottom right). The first proposal of a borehole detector for muography
appeared in Ref. [10], where simulations in a mine installation showed promising results that compared favorably
to the telescope option.
The next sub-sections will focus on different muography detectors, classified by detection mechanism.
4.1 Scintillation detectors
Plastic scintillators constitute an ideal choice in many cases where spatial, and consequently angular, resolution
is not crucial (as typical for AM). Robust muon trackers, suitable for applications in harsh environments, based
on fast-response plastic scintillator materials can be designed with a reasonable price/performance ratio (≈ 50
Ke/m2 ).
These detectors have become even more attractive since the advent of the Silicon Photo Multiplier (SiPM) [99],
replacing the traditional photo-multipliers (PM) at a much lower cost and power budget.
Plastic scintillators are easily shaped in various geometries, from square to rectangular to triangular bars
for instance, that can be used to obtain a position sensitive detection layer with a relatively low number of
readout channels. In general, they allow a remarkable customization of the detector’s geometry, as illustrated in
Fig. 5. A relatively simple detection layer configuration is achieved using arrays of long plastic scintillator bars
of rectangular or square section placed side by side to cover the required surface area, as in Fig. 5 (top). Each
scintillator bar is optically shielded from the others, so that a particle crossing produces a light signal in at most
two adjacent bars, allowing a coordinate reconstruction. Figure 5 (middle) illustrates how with a little ingenuity
a plane can achieve a better spatial resolution with the same number of readout channels: in this example,
introduced as a test configuration by the MIMA collaboration [82], the partial overlap effectively increases
the spatial resolution whilst keeping the same number of readout channels, but using a more complicated √
coordinate reconstruction algorithm. The variance of the residuals distribution can be estimated as L/ 12 for
the first design (where L is the pitch), while the overlapping layout, by exploiting the signals on adjacent bars,
has a residual distribution variance halved with respect to the previous one. With both layouts, the residual
distributions are flat and therefore the uncertainties are not Gaussian. For inclined tracks, the situation is
more complicated. Nonetheless, an accurate coordinate reconstruction can still be achieved by using the track
inclination information from other detector planes, through suitable algorithms.
11Figure 6: (Left) The WLS approach chosen by, for example, MU-RAY [81]. (Right) Large SiPM approach used
by MIMA [82].
As a third example, Fig.5 (bottom) shows a configuration of bars with a right-angled triangular section.
This solution, first adopted at the Fermi National Accelerator Laboratory (USA), has been used for the MU-
RAY [81], MURAVES [37] and MIMA [82] muography detectors. In this case, incident particles always cross
two adjacent bars and the reconstruction of the particle impact coordinate takes advantage of the different
amplitudes of signals produced in the two bars, roughly proportional to the track length in each scintillator.
A simple Centre of Gravity (CoG) algorithm readily achieves a significant increase in resolution, better than
that obtained with the second configuration layout (using the same number of readout channels), and with a
Gaussian residual distribution. Unfortunately, the layout also affects significantly the weight and therefore the
portability of the detector: for a given surface and number of readout channels, the second and third layouts
weigh respectively 1.5 and 2 times more than the first.
Two detection planes are required for a tracking module with X and Y information. Multiple modules,
placed parallel to each other, define a full three dimensional particle tracker. If at least N ≥ 2 tracking planes
can be used, the resulting configuration not only mitigates possible backgrounds from spurious coincidence (see
Sec. 6.1) but also has the capability of monitoring each plane detection efficiency.
Whatever the geometry, the scintillation photons emitted along the particle trajectory can be collected either
through a light guide or through a wavelength shifter fibre (WLS) often encapsulated in the scintillator bar
itself [81], or with SiPMs (or PMs) directly coupled to the scintillator bars. The WLS solution allows the use
of very small (1 mm2 ) SiPMs, thus lowering the costs of the FE electronics. On the other hand, large area
(9 − 16 mm2 ) SiPMs are now readily available at a price only a factor 5 − 10 times more than the smaller ones.
Using these large area photo-sensors coupled directly to the scintillator (e.g. Ref. [82] with triangular section
bars) increases the number of collected photons, with a corresponding increase in the signal to noise ratio and
in the achievable spatial resolution. In addition, there is no need to machine the scintillator bars for the WLS
inclusion. The design choices for two muography telescopes are illustrated in Fig. 6.
A drawback of SiPMs is a marked temperature dependence of the breakdown voltage (typically 20 −
30mV/◦ C), which consequently affects gain, dark count rate and reverse current. Temperature conditions must
be accurately and continuously monitored and the operating voltage changed accordingly. MURAVES [32] has
implemented a thermo-electric (Peltier) cooling/heating module with an active controller capable of maintaining
a constant temperature on the SiPMs, even in the presence of ±10◦ C external variations. The power budget
increase is of the order of 10 Watts for a 1 m2 detection layer equipped with 64 SiPMs and two cooling/heating
modules. A greater temperature compensation range (up to ±20◦ C) can be obtained, simply increasing the
power budget.
Plastic scintillators can also be shaped as thin fibres with square or circular section with typical transverse size
of 1 mm2 [100], greatly improving the spatial resolution at the cost of a much larger number of readout channels.
Scintillating fibre planes are used in SM [91], coupled to multi-anode photo-multipliers (MAPMT) capable of
reading out whole bundle of fibres with the necessary amplification. Such a system has been developed and
commercialised for nuclear waste management by Lynkeos Technology for use at the Sellafield storage site [91].
A particularly interesting development, that it is currently pursued by various groups, is the production of
a fully functional independent muographic borehole detector system (e.g. [101, 58]). New design configurations
have been developed to maximize the angular acceptance of the detection systems [102], a must given the
small radius of these detectors. In fact, borehole detectors have to meet stringent requirements in terms of
compactness, ruggedness, impermeability, and performance in different environmental conditions. Ancillary
equipment must also include some way of determining the detector orientation once inside the borehole. These
detectors, although still in the development phase, could open up new application opportunities in mining and
geotechnical surveys.
124.2 Nuclear emulsion detectors
Nuclear emulsions are a special type of thick photographic plates with very uniform and fine sized (order
µm) grain. Charged particles passing through a nuclear emulsion leave tracks with a spatial definition of the
order of one micron, that can be seen at the microscope after developing the plates. Emulsions were among
the earliest particle detectors and contributed to seminal results, like the discovery of the charged pion [5].
A recent large-scale application was the OPERA neutrino experiment, from where some recent spin-offs to
muography [78, 65, 34] originated.
Nuclear emulsions maintain some peculiarities that make them the perfect solution for some types of appli-
cations. Their spatial resolution is of the order of microns, and multiple films of emulsions can be assembled
to form thin tracking layers. These can achieve angular resolutions of the order of few mrad, have a limited
cost and do not need any power supply [103]. There are, however, important issues concerning their usage.
First, the emulsion film starts recording particle tracks from inception. Thus an emulsion sandwich must be
assembled right at the start of the observation campaign to “cancel” the information on the previously acquired
tracks. In addition, they suffer from cold temperatures (i.e. below 10 ◦ C) and humidity. Another and very
significant drawback is the equipment needed to analyse the plates. The OPERA experiment during its lifetime
had invested considerable resources in the development of automated motorized optical systems that scan the
plates and use pattern recognition to reconstruct track candidates in a reasonable amount of time (typically
hours per cm2 ). Only a few laboratories in the world are equipped with these microscopes thus limiting access
to the technology.
Nonetheless, emulsion films have been used successfully in a variety of muography experiments (see Sec. 3)
and have demonstrated an excellent performance in environments ranging from alpine tunnels [63, 64] to hot
sand deserts [78] and Mediterranean volcanoes [34], during measurement periods spanning several months.
4.3 Gaseous detectors
A gaseous detector is often the ideal choice for applications where angular resolution is one of the main design
parameters (which is always the case in SM). The muon crosses the gas volume leaving an ionised trail in its
wake. The electrons (and ions) are collected by applying an electric field. Typical configurations use a cylindrical
geometry, where the anode is a thin wire (of the order of 100 microns) that collects the electrons generated in
the ionisation process. If the field is high enough (50−100 kV/cm or more at atmospheric pressure), a Townsend
avalanche multiplication will occur in proximity of the wire. Gains of 104 or more are easily achievable while
maintaining full proportionality between collected charge and initial ionisation. Since the signal can be quite
large, the requirements on the FE electronics in terms of gain and noise are quite relaxed, greatly simplifying
the design and reducing the cost. In general a gaseous detector takes advantage of the low CR flux using fewer,
relatively simple, electronic channels (thanks to the gas amplification) and this in turn translates into high
resolution, large surface detectors, at a cost which can be lower than the scintillator detectors described before.
A position sensitive detection layer using gaseous detectors can be relatively inexpensive to build (e.g. an
assembly of aluminium tubes placed side √ by side). In the simple case of Fig.7 (top), the spatial resolution is
given by the tube diameter divided by 12. The spatial resolution can be easily improved following a multi-wire
chamber [104] approach with segmented cathode strips for readout, see Fig.7 (middle). Simple CoG algorithms,
using the charge induced on the strips, can easily achieve resolutions of a few 100 microns, at the price of a small
increase in number of FE channels and detector complexity. Another approach, favoured by the low CR rate,
is the use of drift techniques. A drift chamber, see Fig.7 (bottom), effectively measures the distance between
the muon track and the anode wire, by measuring the time the electrons travel through the gas. The FE is
more complex and Time to Digital Converters (TDC) are also required, but the number of channels can be
drastically reduced, while obtaining resolutions of up to a 100 microns. This technique can be applied either
with closed walled single tubes, or in a multi-wire chamber approach. Given the very high spatial resolution
and consequent angular resolution, this type of detector has been used by various groups involved in homeland
security projects [25, 84]) or nuclear casks imaging [88] using SM. Small-sized gaseous detectors can be also
used in boreholes, as demonstrated by the studies reported in Refs. [105, 62].
Other types of gaseous detectors have also been used by groups involved in AM applications. Examples
include Micromegas [106] in the ScanPyramids project [78] and in geological prospections [107], and resistive
glass gaseous pad detectors [38] for the imaging of the Puy De Dôme complex. In the Micromegas case, in order to
contains the costs of the FE electronics, an innovative “genetic multiplexing” readout scheme [108, 109] has been
developed, thus preserving the inherent excellent space resolution of the detector while drastically lowering the
number of FE channels. Micromegas are being also used in the design of a compact Time Projection Chambers
(TPC) for geological prospections [110]. As a final example of gaseous detectors, the Resistive Plate Chamber
(RPC) could in principle become a very economical large surface tracker. The detector works in avalanche
mode, resulting in very large induced signals on the segmented readout pads. It is an economical detector, that
requires a relatively simple FE electronics. A trial prototype [111] for use in SM has achieved spatial resolutions
13You can also read