August 2021 WWF briefing on comparing the environmental impact of farming across countries for trade policy
←
→
Page content transcription
If your browser does not render page correctly, please read the page content below
WWF-UK
Registered office
The Living Planet Centre
Rufford House, Brewery Road
Woking, Surrey GU21 4LL
Tel: +44 (0)1483 426444
info@wwf.org.uk
wwf.org.uk
August 2021
WWF briefing on comparing the environmental
impact of farming across countries for trade policy
This brief provides further insights on data used in the Board of Trade Green Trade report on the
environmental impact of agricultural production in countries with which the UK is negotiating trade
deals. WWF is a core member of Greener UK and this briefing is intended to supplement Greener UK
briefings on trade https://greeneruk.org/briefings/trade.
BACKGROUND
The Board of Trade works alongside but is separate to the Department of International Trade.
Its president is the Secretary of State, Rt Hon Liz Truss MP, its members comprise ministers
and a number of independent advisors. Although the Board of Trade’s views are distinct from
DIT policy, they are nonetheless important and influential so it is good to see their July 2021
Green Trade report looking at climate change and nature restoration together, as well as
opportunities and risks to the economy addressing them will present.
Moving to more sustainable food and farming system is fundamental to achieving our global
environmental goals on net zero and nature restoration so it is critical we understand the
impact of different types of farming – including the differences in greenhouse gas (GHG)
intensity of livestock production across countries – and set the right incentives for trade in
food accordingly. It is particularly important data on ghg intensity is used in context because,
by itself, it could give the misleading impression that, say, UK and Australian livestock farming
are broadly comparable. This briefing shows why that is not the case.
Board of Trade Green Trade (July 2021)
President: His Royal Highness, WWF-UK a charity registered in England and Wales number 1081247 and in
The Prince of Wales KG, KT, GCB, OM Scotland number SC039593, a company limited by guarantee registered in
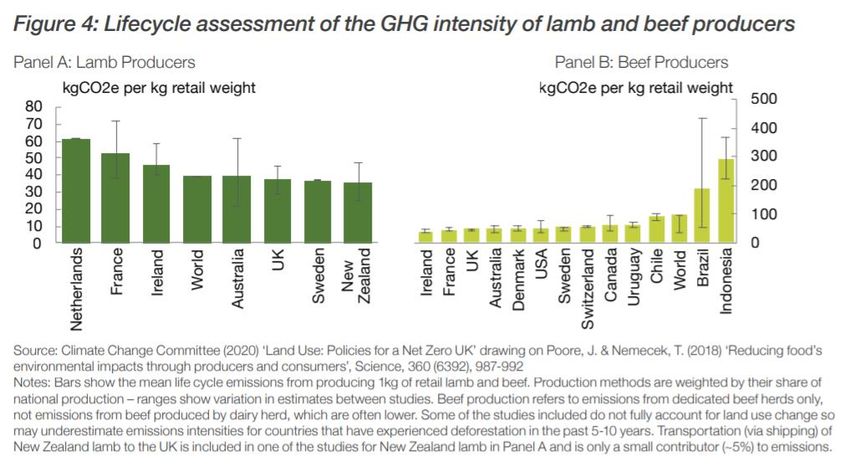
Chief Executive: Tanya Steele England number 4016725. VAT number 733 761821Green Trade includes charts on lifecycle GHG intensity of lamb and beef from Poore and
Nemecek. This is the most comprehensive, consolidated data set on GHG intensity and WWF
is supporting the development of the HESTIA platform based on Poore and Nemecek’s work
as part of the Food Sustainability Analytics programme at University of Oxford, Oxford
Martin School.
However, the data on GHG intensity needs to be properly understood. If we take the UK and
Australia – the subject of particular interest because of the current UK-Australia trade deal
negotiations – the charts give the impression that the production systems of the two countries
are broadly comparable in terms of GHG emissions, which could be interpreted to mean they
are broadly comparable on environmental impact. This is not the case and using GHG
intensity only to compare farming systems is an insufficient and incomplete representation of
environmental impact that need to be considered in policy.
The following brief sets out the three big problems with using country level GHG intensity data
to make comparisons of farm systems to inform to UK trade negotiations with Australia, New
Zealand, Canada and the US and other big agricultural exporters.
THREE PROBLEMS WITH A GHG INTENSITY ONLY APPROACH
1. Climate is not the only environmental factor to consider when comparing the
environmental impact of farming.
HESTIA and all robust analysis of environmental impacts of food production look at effects
on climate alongside effects on water, biodiversity, and resource use wherever possible.
An extract of the data from WWF’s Bending the Curve: The Restorative Power of
Planet-Based Diets shows that, Australia’s beef and lamb production has very much higher
impacts on biodiversity and scare water resources than UK production. And, although they
have similar eutrophication potential from lamb (i.e. algae bloom and dead zones caused by
excess nutrients from manure), the eutrophication potential of beef is likely to be much higher
in Australia than the UK.
It is important to note the low biodiversity impact figures in the UK in large part reflect the
extent of UK nature depletion, meaning there is little for the UK left to lose. The challenge in
the UK is to restore nature in already farmed landscapes by transitioning to sustainable
agriculture, whereas Australia has to transition to sustainable agriculture to also stop
deforestation and conversion driven by expansion of overall area being farmed.
Environmental impacts of UK and Australia beef and lamb production (extract of analysis from The
Restorative Power of Planet-Based Diets)
Carcass Weight (kg) Beef Lamb
UK Australia UK Australia
average average average average
Land Use (m2 per year) 55 730 195 2,125
Biodiversity Impact (species potentially lost 40 2,850 120 8,310
per year times 1 x 10¹⁴)
Greenhouse Gas Emissions (kg CO2eq) 27 35 28 30
Eutrophication Potential (g PO43-eq) 90 310* 85 75
Water Use (L) 740 680 540* 1150*
Scarcity Weighted Water Use (L eq) 3,390 50,410 2,480* 84,460*
* Higher uncertainty in these numbers.
Source: WWF (2020) Bending the Curve: The Restorative Power of Planet-Based Diet – underlying data kindly
provided by Joseph Poore.
2The EU’s Sustainability Impact Assessment from March 2020 supporting the ongoing
negotiations of an EU-Aus deal is also instructive on the wider environmental impact of
trade with Australia since the UK and EU currently have very similar farming and
environmental regulations. The EU SIA models the impacts of a full trade liberalisation
scenario and sets out the following on biodiversity and water impacts:
“Land clearing and grazing: The clearing of native vegetation, especially in the
states of Queensland (The Economist, 2018) and New South Wales (Hannam, 2019),
mostly for agricultural use (for cropping and livestock), negatively affects
biodiversity by removing native vegetation which is also habitat for native
fauna. Additionally, the agricultural practices that replace the vegetation create
additional environmental impacts that further affect biodiversity. For example,
hooved animals remove vegetation cover reducing soil integrity, which
increases soil loss from land and increases water pollution loads to
waterways (as the soil is more easily transported during rainfall events). Animal
wastes also contribute to pollution loads to water. Additional landscape changes for
grazing (such as on-farm dam construction) can disrupt natural water flows and
cause additional biodiversity impacts, such as supporting larger populations of
kangaroos or pest animals such as goats, which survive in larger numbers where
permanent water supplies exist. Where land clearing is for cropping,
pesticides and fertilisers can disrupt ecosystem function and contribute
to water quality issues in nearby waterways.”
2. Lowering GHG intensity at the expense of animal welfare and public health
is a dead end.
Rearing livestock and poultry fast in industrial farming systems can be considered ‘efficient’
in narrow commercial terms but some also claim it is ‘carbon efficient’ production method.
The UK has long been a leader in animal welfare, and RSPCA comparisons of UK and
Australia animal welfare regulations in farming show UK standards are far higher.
The UK animal welfare legislation have largely been value-based decisions, but they have
also allowed the UK to lead the way in reducing antibiotic use in farming, critical to address
global public health risk around antimicrobial resistance (AMR). Most industrial meat
production system rely on the routine use of antibiotics to compensate for their poor welfare
standards. Save our Antibiotics estimate Australian’s pig and poultry farming uses
three and 17 times the levels of antibiotics respectively, compared to the UK.
And importantly, from an environmental point of view, we are increasingly able to show low
animal welfare systems are also harmful to the environment, both on carbon and on many
other metrics. WWF’s Driven to Waste on the production waste in the global food
systems reports shows poor sanitation and animal husbandry is one of the drivers of farm-
stage waste in animal agriculture, which accounts for 40% of ghg emissions of food waste at
farm level, which itself is responsible for 16% of all agricultural emissions.
Driven to Waste’s case study of the US broiler chicken industry shows increasing levels of
waste are driven by poor animal welfare. Mortality and disease contribute to 637,000 tonnes
of chicken being wasted per year in the US, and this rises to even more catastrophic levels
with disease outbreaks, such as the 2015 avian flu, which are driven by the same poor welfare
standards.
The UK has lots of problems to address with its own intensive poultry industry, which makes
up 95% of its production, as set out in We need to talk about chicken. Chicken is also
often promoted as a “carbon-efficient” source of meat, but it is clear that lowering carbon
emissions by industrial production not only comes at too high a cost in terms of welfare and
3antibiotic use but, because it is profitable, has also led to an overall increase in production
and emissions.
3. GHG intensity data has to be interpreted with care.
There is huge variation in footprints of production systems between and within countries, this
is especially true for beef, lamb, dairy, and fish farming. Country averages can be misleading,
and it is inappropriate to use average environmental performance to inform trade policy that
was trying to incentivise sustainable farming.
Particular issues worth highlighting with the GHG intensity data used in Green Trade:
• As noted in the footnotes, the GHG emissions data included in Green Trade may not
include the impact of recent deforestation and that is likely to be significant issue for
some countries. The data included in the Australia figures, for example, is based on
twenty-year average deforestation from 1990-2010, which would not reflect recent rises
in deforestation rates. WWF’s Riskier Business classifies Australia as a high-risk
commodity provider as it has the highest rate of deforestation in the OECD. It’s rate of
tree loss cover has risen by 34% between 2016-2018, largely driven by the livestock
industry.
• Although GHG data for food and farming are good, some elements of the methodology are
not yet standardised. This leads to differences in calculations which have implications
when we compare farming systems.
o land sequestration or soil carbon methodologies still vary, and standard
approaches are being developed by the IPCC, Currently the UK’s three leading
footprint tools can give different results based on the same data, and this problem
particularly affects the footprint of livestock farming
o system boundary and modelling methods used for the lifecycle carbon analysis will
affect the extent and way the food supply chain is included, as previously discussed
including or excluding ghg impact of land conversion or deforestation can cause
huge variation in the calculations, as can the approach to modelling methane.
o And finally, there are a variety of methodologies for assigning GHG emissions at
product level i.e. per kg of beef or lamb, which can have a significant effect on
calculations of GHG intensity. The effect allocating carbon between multiple
products can have is shown by Netherlands beef from a solely beef herd
having almost twice the GHG intensity of beef from dairy herds which
produce both meat and milk over its life.
THE WAY FORWARD
Globally, food and farming are amongst the biggest drivers of carbon emissions and nature
loss. WWF is working with leading academics to improve the data on the environmental
impacts of food and making this available to ensure consistent decision making and policy
development. The incentives for a transition to sustainable agriculture need to reflect the
multiple ways food production links to climate, nature, public health and animal welfare.
Simple country level comparisons of GHG intensity could give the impression there is little
difference in the environmental and animal welfare standards of different agricultural
systems, but this briefing demonstrates why that this is not the case.
4WWF is proposing the UK develop minimum core standards, including environmental
standards, which would ensure all food imported into the UK meets comparable levels of
climate, habitat, biodiversity, and water protection to those required in the UK. This will
ensure the UK’s transition to sustainable farming is not undercut at home and also drive
transformation of the global food system, by supporting the best practice of farmers
overseas.
Tanya Steele, Chief Executive at WWF, said:
“No one wants the food they buy to come at the cost of the planet, but the UK
government’s efforts strike a trade deal with Australia - a laggard on climate and
nature - risk setting a precedent that undermines its commitments to tackle the climate
and nature crisis. Unless we adopt core standards for the food we import, trade deals
with big agricultural exporters with low environmental and animal welfare standards,
like Australia, will be a huge blow to greening the UKs farming and supply chains.
“Trade deals have the potential to support the UK in developing the industries of the
future, including sustainable farming, making us greener and more resilient - but this
will only happen if there are proper safeguards in place. That is why - for the sake of
people and planet - the UK government must now set out core standards for all food
brought into the UK. This should be at the heart of wider efforts to drive a global shift
towards modern, sustainable farming, a shift that is essential if we are to succeed in
tackling the twin threats of climate change and nature loss.”
WWF’s briefing on core standards and the proposed Australia trade deal provides
more information on WWF’s proposals on trade to support a transition to sustainable
agriculture.
Contact Angela Francis – Chief Advisor Economics and Economic Development
Email/Tel AFrancis@wwf.org.uk 01483 412403
Date 5th August 2021
5You can also read