Automated Data Reduction at a Small College Observatory - aavso
←
→
Page content transcription
If your browser does not render page correctly, please read the page content below
Smith and Akins, JAAVSO Volume 47, 2019                                                                                              1

Automated Data Reduction at a Small College Observatory
Donald A. Smith
Physics Department, Guilford College, 5800 W. Friendly Avenue, Greensboro, NC 27410; dsmith4@guilford.edu

Hollis B. Akins
Physics Department, Grinnell College, 1116 Eighth Avenue, Grinnell, IA 50112

Received July 15, 2019; revised August 14, 2019; accepted August 30, 2019

Abstract We report on our success in automating the data analysis processes for a small (half-meter class) reflecting telescope
at Guilford College, a small liberal arts college in an urban location. We give a detailed description of the hardware that makes up
the instrument. We use commercial software to run the telescope, and we have written Python scripts to automatically carry out
the daily tasks of image reduction, source extraction, and photometric calibration of the instrumental magnitudes to the AAVSO
APASS catalogue. We characterize the effect of light pollution in terms of sky brightness and typical limiting magnitudes (V ~ 15
for a 60-s image), and we report that our RMS scatter in light curves for constant sources approaches 0.5% for bright (V < 10)
sources. As a test of our system, we monitored two known variable stars, and we confirm the predicted ephemerides as given by
the AAVSO web site target tool. We hope that this paper will provide a context in which future observations reported from this
site can be interpreted.

1. Introduction                                                      our observatory can provide. We close with a short description
                                                                     of what we hope to offer in future work. It is our hope that
     The Guilford College Cline Observatory is a primarily           this paper will provide the reader the context to evaluate the
educational resource for students interested in learning about       strengths and challenges underlying future science reports.
observational astronomy. An array of small reflecting telescopes
can be set up on clear nights to allow beginners, photographers,     2. Telescope components and control
and the public to view the night sky. With solar filters and an
Hα scope, we enable the observations of sunspots and eclipses.            The centerpiece of the observatory is a 6-m diameter
Two 2.4-m radio telescopes extend our vision to the 21-cm            Observadome. The dome opens a 1.6-m wide slit using two
neutral hydrogen line. In recent years, however, we have             laterally sliding gate doors. Power is conveyed to the dome
endeavored to bring the primary optical telescope into a reliably    from below using seven circular rails with sliding conductive
automated state such that it can more robustly contribute to         contacts, enabling unrestricted rotation in either direction. The
scientific research.                                                 hemispherical dome rests on eight spring-loaded tires, and
     In this paper, we report on the technical specifications        rotation is driven by two friction-drive wheels. An optical sensor
of the 16-inch optical telescope and our automated data              counts wheel rotations and allows the calculation of angular
processing pipeline. We detail the structure and characterize the    displacement. A magnetic switch defines the home position.
performance of the pipeline; every morning it reduces the images     A wall-mounted enclosure contains the two circuitboards of
recorded by the telescope the previous night. This software also     a maxdome ii automation system (Diffraction Limited 2019a)
extracts a list of sources from every image and calibrates their     and four relays wired in parallel with the manual buttons.
instrumental magnitudes to the AAVSO APASS catalogue.                We have also installed wireless communication between the
     The result is an ever-updating database of brightness           maxdome boards and the slit window motors, as the unrestricted
measurements that can be used to construct light curves,             rotation of the dome disallows any attempt to run a wire across
perform brightness distribution studies, and monitor stars that      the boundary. This system enables computer control of dome
have been flagged as of interest by the AAVSO. We intend this        rotation and slit operation. The dome also has a wind shield that
paper to characterize the specifics of our instrument so that        can move up and down, but we have not automated this feature
future reports and updates from our site can be understood.          and generally leave the shield down.
In a separate paper, we plan to report on our efforts to set up           At the center of the dome is a 16-inch RCOS reflecting
an accompanying spectroscopic telescope that can be used in          telescope (f/8.3). The focal length of 3.4 m yields an image scale
conjunction, simultaneously, with the automated photometric          of 61 arcsec/mm at the focal plane. This closed truss optical
telescope. This will be useful, as both telescopes will share the    tube is mounted on a Paramount ME robotic telescope mount
same observing conditions.                                           (Software Bisque 2019a). The entire instrument rests on a sand-
     In section 2, we lay out the technical specifications of the    filled pier, 30 cm in diameter. This pier sits on a steel I-beam,
hardware and software that make up the telescope. We follow,         which extends 70 cm to the North (center to center) from a 80-cm
in section 3, with a short description of the observing conditions   diameter cylindrical concrete base. The base is acoustically
that our urban environment affords us. Section 4 describes           isolated from the metal floor, and rests on a skeletal structure
the design and operation of the data reduction and analysis          that is isolated from the rest of the building. The result is that
pipeline, and section 5 presents two examples of the results         the rotation axes of the telescope cross roughly three meters
2 Smith and Akins, JAAVSO Volume 47, 2019
moves the secondary mirror along the optical axis. This motor
is controlled by the RC Optical Systems Telescope Command
Center (TCC-I; Deep Sky Instr. 2019). The STF-8300 has the
capability to add a secondary camera for autoguiding, but we
have not yet implemented this feature.
We have two devices to monitor the weather. An Aurora
Cloud Sensor (Aurora Eurotech 2019) measures the difference
between the sky temperature and the ambient air temperature
to estimate cloud cover, and an exposed sensor reports the
presence of rain drops. A Davis Vantage Vue weather station
(Davis Instr. 2019) records humidity, pressure, wind speed and
direction, and temperature. These data are recorded and stored
on the central computer.
All the features of this telescope system are controlled via
computer. As of May 2019, the control computer is a Hewlett-
Packard HPE-470F Pavillion Elite, running 64-bit Windows
10. Software Bisque’s theskyx (2019b) anchors the system,
connecting to the mount, focuser, camera, and dome. Aurora
and Davis provide their own software to connect to the weather
stations. We have augmented theskyx with the TPoint and All
Sky ImageLink features. The mount, camera, and focuser are
plugged into a IP-enabled power strip so that sockets may be
turned on and off individually through a web browser interface,
and we have a wall-mounted IR-enabled Foscam security
camera. These features allow us to operate the facility remotely
using the TeamViewer program as a remote desktop. The use of
TeamViewer's App makes it possible to run the whole operation
from the screen of a mobile phone.
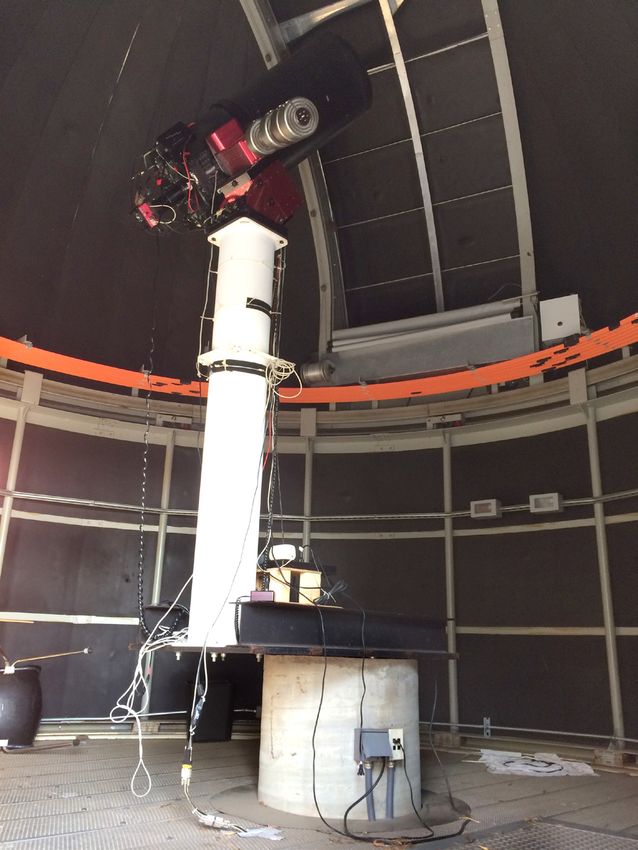
Figure 1. Image of the inside of the dome. The cantilevered pier is visible at theskyx can receive scripted commands over the Internet.
the bottom of the image—the concrete acoustically isolated base, the black We have written programs to schedule a night’s observations
I-beam, and the white sand-filled pier. The Paramount ME and the RCOS
without human intervention. The python programs are stored on
telescope are on top, with the CCD camera to the left. The dome slit is visible
in the background. The orange curves are the rails that carry AC power to the a Linux computer in another room in the building. Each script
dome from below. starts with targets as a list of strings with associated R.A.and
Dec. coordinates (J2000.0). Exposure time, filter choice, and
above the floor, to put the telescope at the geometric center of delays between observations are also specified. The script
the dome. Figure 1 shows the interior of the dome, from the updates the coordinates to the current day’s epoch and instructs
concrete base up to the RCOS OTA. theskyx to slew the telescope, wait a desired time to allow the
The cantilevered offset of the pier was the result of a dome and the telescope to both reach the target, and then take an
compromise between scientific functionality and the aesthetics image. Each image is automatically passed to theskyx’s All Sky
of how the dome would look from a distance. Although we Image Link process for source identification and the derivation
worried that the cantilever structure might introduce harmful of world coordinate system (WCS) astrometric parameters. This
vibrations into the observing process, an undergraduate thesis ensures that our images can be seamlessly passed to the analysis
project revealed that in the absence of humans, neither the dome’s pipeline (section 4).
rotation nor the mount’s slewing introduced any measurable The script includes definitions for procedures to turn all the
jitter into the images (Corbett 2011). The same research found pieces of the telescope system on at the start of the night as well
that vibrations created by striking the pier directly faded with as code to shut everything down at a pre-determined time. After
an e-folding time of less than 30-s. Automated operations have startup is complete, the script will loop through the indicated
never revealed significant degradation due to pier oscillations. observations until the shutdown time is reached. However, we
Images are captured with an SBIG STF-8300M CCD have not yet scripted a connection to the weather monitor, so
camera (Diffraction Limited 2019b). This instrument has the system is not yet capable of shutting itself down in the case
3326 × 2504 pixels at 5.4 microns, yielding an image scale of of unanticipated weather developments. We plan to implement
0.33 arcsec/pix at the chip. The shutter is designed to afford this feature in the future.
even illumination over the entire chip, and the full-frame
readout time is less than one second. The camera is outfitted 3. Urban sky brightness
with an FW8 filter wheel. We have chosen to use Baader Red,
Green, and Blue filters for astrophotography, and Bessel R, V, The Guilford College Cline Observatory (Lat. +36° 5' 42",
and B filters for photometry. The final two slots contain an Hα Lon. –79° 53' 24", altitude 280 m) is situated on the roof of a
filter and an open, “Lum” filter. Focus is driven by a motor that three-story building that houses the natural sciences offices,Smith and Akins, JAAVSO Volume 47, 2019 3
labs, and classrooms. Although the College has committed to
replacing outdoor light fixtures with downward facing baffles,
and the campus contains more than 100 acres of undeveloped
forest, we are still in an urban environment. As of 2019,
Greensboro proper houses more than 250,000 inhabitants, and
is one of three major cities in an urban area called “The Triad”
(also including High Point and Winston-Salem). The center
of Greensboro is ~ 9 km southeast of our location, and the
Piedmont Triad International airport is ~ 3 km to the west.
Although the northern skies are slightly darker than the
southern, this cannot be considered a dark sky site. A 2001
global light pollution map, based on satellite observations,
atmospheric modeling, and other statistics, predicts a range
in sky background brightness values from 17.80 to 18.95
magnitudes per square arcsecond of subtended area at Guilford
College’s location (Cinzano et al. 2001). A 2016 student senior
thesis project recorded roughly 100 images of two fields with Figure 2. Histogram of number of sources as a function of V-band magnitude
10 s and 30 s of exposure in each of the Baader Green and Blue for a 10-s exposure (81 stars in green/dotted), a 60-s exposure (203 stars in
orange/dashed), and a 120-s exposure (241 stars in blue/solid) of open cluster
filters and found that the actual sky brightness at our location
NGC 6811. The limiting magnitudes can be estimated by seeing where the
was consistent with approximately 17 mag per sq. arcsec histogram drops off: V ~ 13.5, 15.0, and 15.5, respectively.
(Seitz 2016).
A follow-up senior thesis project attempted to measure
the contribution to sky brightness due to the addition of lights
to our primary football field, roughly 500 m southeast of the
science building. Turning the field lights on and off had to
be coordinated with a company in Iowa, but Oulette (2016)
observed multiple fields at an elevation of approximately 30°
above the stadium and found that the presence or absence of
the field’s lights had no significant impact on the sky brightness
or limiting magnitude of the images.
Our own observations of open cluster NGC~6811 indicate
that for a 60-s exposure, we can expect to reach roughly 15th
magnitude. Figure 2 shows a histogram of the number of sources
extracted from the field with our automated pipeline. For a 60-s
image, there is a steep decline in the number of sources at V ~ 15, Figure 3. Standard deviation of source brightness as a function of mean
and no sources at all below V ~ 15.5. magnitude. This graph is derived from 35 observations of 101 sources in open
Another way to characterize the stability of the analysis is cluster M29 over the course of the night of 14 July 2019. Each image was
exposed for 60 s. Fluctuation levels approach 0.5% for sources brighter than
to measure magnitude fluctuations over time. Tracking M29 for V ~ 11, but degrade to 0.07 mag at a magnitude of V ~ 15.5. These RMS values
the night of 14 July 2019 yielded 35 measurements of 101 stars. can be interpreted as an estimate of the systematic uncertainty in our ensemble
The pipeline analysis reported median values of the FWHM for photometry method.
each image that ranged between 1 and 2 arcseconds. Figure 3
shows a plot of the RMS variability in the resulting light curves et al. 2003; Smith et al. 2003). The pipeline consists of python
as a function of the mean magnitude. For stars brighter than V scripts housed on a Linux computer. The data directories on the
~ 11, the variation is consistent with fluctuations at the ~ 0.005- telescope control computer are remote-mounted on the Linux
mag level. Below this brightness, the stability decays, rising computer for easy access. All images are recorded in the FITS
to a maximum of 0.07 mag. The statistical uncertainty of the format (Wells et al. 1981).
dimmest stars in these 60-s images is ± 0.03 mag. The primary script is launched via a cron utility every
These fluctuations can be considered an estimate of the morning. If the script ascertains that new images have been
systematic uncertainty in the magnitude, and for dim stars recorded in the last night, it copies them to the Linux computer.
they dominate over the statistical error associated with the It then applies dark, bias, and flat-field corrections to create a
photon counts. In the next section, we describe the pipeline that new archive of calibrated images, using the astropy package
produced these measurements. (Astropy Collaboration et al. 2013). The script also checks to
see if new calibration files have been recorded. If possible, new
4. Data analysis pipeline calibration masters are made from individual files to ensure
up-to-date correction images.
We have developed software to reduce and analyze all Any further pipeline processing requires the image to have
images captured with the 16-inch telescope, based on the WCS conversion equations recorded in the FITS headers. If
pipeline used in the ROTSE-III telescope system (Akerlof the images were not solved at the time they were recorded4 Smith and Akins, JAAVSO Volume 47, 2019
Table 1. Observing targets.
Star R.A. (J2000) Dec. (J2000) Date Type Ta Number Cadence (N)b
h m s ° ' " (days) of Images (seconds)
RR Lyr 19 25 27.9 +42 47 03.7 2018-08-15 RR 0.57 73 160 86
V457 Lac 22 36 23.0 +38 06 18.4 2018-08-16 E 6.16 29 800 101
a
From The AAVSO International Variable Star Index (VSX; Watson et al. 2006-2014). b Average number of sources in field.
with the ImageLink process within theskyx (as programmed
in our observing python scripts), a plate solution using nova.
astrometry.net, or equivalent, is also sufficient.
Following calibration, in the presence of astrometric data,
we use the SExtractor python wrapper (Barbary 2016) to
perform source extraction, annulus subtraction, and aperture
photometry. We use a fixed aperture radius of 12 pixels (scaled
down linearly at higher pixel binning) and a surrounding
annulus with inner and outer radii set to 1.5 to 2.0 times the
aperture radius, respectively. Sources with pixel values less
than four times the background RMS are discarded. We use an
outlier-removal algorithm to account for source contamination,
and all stars flagged as saturated or truncated by an image
boundary are ignored. This aperture photometry method Figure 4. Light curve for RR Lyr from 15 Aug 2018. The light curve for a
(constant intensity) comparison star at tenth magnitude is also included to
yields uncalibrated instrumental magnitudes for every source indicate the level of systematic fluctuations in the analysis. Error bars indicate
identified in the image. formal statistical uncertainty derived from random counting. The gaps and
Next, measured celestial locations of all unsaturated sources increased uncertainty towards the end of the observing run are the result of
are then matched to entries in the AAVSO APASS catalogue incoming clouds.
(Henden et al. 2015), with a tolerance of 3 arcseconds, to
retrieve catalogue magnitudes. The median offset between
instrumental and catalogue magnitudes is used to correct all
the instrumental magnitudes and thereby derive calibrated
magnitudes for all sources in the field. This approach is called
ensemble photometry (Honeycutt 1992; Everett and Howell
2001). The resulting calibrated magnitudes are saved to a
master database along with other identifying information for
each source. From this database we can extract light curves.
5. Example results
To test the reliability of the pipeline reduction and analysis
process, we chose two variable stars to monitor throughout Figure 5. Light curve for V457 Lac, an eclipsing binary, recorded over six
a night. We used the AAVSO Target Tool (AAVSO 2017) to hours on the night of 17 Aug 2018. The light curve for a (constant intensity)
identify two sources that were predicted to engage in interesting comparison star is also included to indicate the level of systematic fluctuations
in the analysis. Error bars indicate formal statistical uncertainty derived from
behavior on the nights we would be observing. RR Lyrae, the random counting. A horizontal dashed line indicates the magnitude for V457 Lac
eponym for the RR Lyrae class of variable stars, was predicted given in the UCAC catalogue (Zacharias et al. 2013). The timing of the eclipse
to reach a maximum at approximately 06:30 UT on the morning is consistent with the ephemeris reported via the AAVSO web site.
of 16 Aug 2018, so we expected to see the brightness begin to
rise approximately 90 minutes before then. The next night, we Figure 4 shows a light curve for RR Lyr. We observe
monitored V457 Lac, an eclipsing binary that was predicted to the star rise from V ~ 8.1 to ~ 7.3 before clouds obscured the
have an eclipse event at 03:00 UT. image around 06:30 UT. The comparison star (UCAC 664-
Table 1 presents details of our two observing programs. It 074503) shows no systematic trends (nor does any other
gives the target coordinates and the dates of the observations, star in the field—this star is included as representative). The
the type of the target star, and the period of its variation. The RMS scatter in the brightness of the comparison star (before
number of images taken each night and the typical time between the clouds arrived) is ~ 0.01 mag, consistent with the results
images are also reported. Both fields held close to 100 sources reported in Figure 3. Since the rise is clearly unique to RR Lyr,
(last column), more than enough for the ensemble photometry greatly exceeds the systematic variability, and coincides with
technique, and we obtained over 25 images of each field. We the predicted rise of this target, we are confident that we have
used a Bessel V-band filter for all images. robustly detected the variability of this star.Smith and Akins, JAAVSO Volume 47, 2019 5
Figure 4 shows a light curve for eclipsing binary V457 Lac. 7. Acknowledgements
This curve shows a significant dip in the brightness of the
system, from an average magnitude of V ~ 9.8 to a minimum of The authors would like to thank J. Donald Cline for his
~ 10.0. The comparison star shows no such systematic deviation continuing support of the observatory, as well as colleagues
from a constant brightness. Note that this magnitude range and students at Guilford College for help and discussions. In
for V457 Lac is in line with the AAVSO reported magnitude particular, Prof. T. Espinola, C. Potts, S. Kirwan, N. Cleckler,
range from 9.84 to 10.04. The time of onset for this eclipse is E. Ruprecht, and A. Jordan have been of great help along the
consistent with the 03:00 (UT) time predicted by the ephemeris way. K. Iverson, of Plane Wave Instruments, helped with the
in the AAVSO Target Tool. automation of the dome. K. Sturrock’s python library was
These observations give us confidence in the reliability and critical in enabling us to automate observing in theskyx, and J.
accuracy of our tools. Lynch donated the telescope control computer. Thanks also to
Prof. D. Reichart for support in the early phases of this work.
6. Future work We would also like to thank the anonymous referree, whose
suggestions were very helpful in improving both this paper
Now that the images from the 16-inch telescope are and the analysis on which it is based. This research was made
automatically and reliably reduced and analyzed, we hope to possible through the use of the AAVSO Photometric All-Sky
use the facility for scientific studies. Being a small observatory Survey (APASS), funded by the Robert Martin Ayers Sciences
in an urban setting, the most likely venue for us to make Fund and NSF AST-1412587.
meaningful contributions is in the study of bright variables
and/or transients. With a typical limiting magnitude of V ~ 15 References
for a 60-s image, many variable stars are within our reach (e.g.
Woźniak et al. 2004; Paczyński 2006). A few supernovae a year AAVSO. 2017, AAVSO Target Tool (https://www.aavso.org/
should be visible (e.g. Lae et al. 2015; Bellm et al. 2019), and aavso-target-tool).
occasionally even a Gamma-Ray Burst (e.g. Smith et al. 2016) Abbott, B. P., et al. 2017, Astrophys. J., Lett., 848, L12.
or gravitational wave merger/kilonova event (Abbott et al. Akerlof, C. W., et al. 2003, Publ. Astron. Soc. Pacific, 115,
2017). Asteroids are also potential targets. 132.
We hope to bring our companion spectroscopic telescope Astropy Collaboration, et al. 2013, Astron. Astrophys., 558A, 33.
on line soon, and with the two together we hope to monitor Aurora Eurotech. 2019, Aurora cloud sensor (http://www.
spectroscopic binaries for doppler shifts. The ~ 1% variations auroraeurotech.com/CloudSensor.php).
at the bright end of our observations means that detecting Barbary, K. 2016, J. Open Source Software, 1, 58.
exoplanet transits will be a challenge. We can improve the Bellm, E. C., et al. 2019, Publ. Astron. Soc. Pacific, 131,
statistics with longer exposure times, of course, at the cost of 078002.
temporal precision in determining the ingress and egress times Cinzano, P., Falchi, F., and Elvidge, C. D. 2001, Mem. Roy.
of the transits. Astron. Soc., 328, 689.
On the technical side, in addition to the autoguiding Corbett, M. 2011, Bachelor’s thesis, Guilford College.
capability mentioned previously, we plan to integrate the Davis Instruments. 2019, Vantage Vue weather station (https://
weather monitoring stations into the operating software so www.davisinstruments.com/solution/vantage-vue).
that if the stations detect poor observing conditions, they will Deep Sky Instruments. 2019, RC optical systems telescope
automatically trigger a shutdown. Although we have scripting command center (TCC-I; https://www.rcopticalsystems.
software that can execute a planned set of observations, the com/accessories/tcc.html).
observing queue is not dynamical nor does it take elevation Diffraction Limited. 2019a, maxdome ii observatory dome
into account. We hope to improve this in the future. control system (https://diffractionlimited.com).
Our preliminary analysis of the limiting magnitudes of our Diffraction Limited. 2019b, SBIG STF-8300M CCD camera
images suggests that perhaps our source extraction cutoff of (https://diffractionlimited.com/product/stf-8300).
four times the background RMS might be too conservative. For Everett, M. E., and Howell, S. B. 2001, Publ. Astron. Soc.
the dimmest stars in the images (around V ~ 16), the statistical Pacific, 113, 1428.
uncertainty is about 0.03 mag, and the RMS fluctuation over Henden, A. A., Welch, D. L., Terrell, D., and Levine, S. E.
35 images in one night is only 0.07 mag. This suggests we are 2009, Bull. Amer. Astron. Soc., 41, 669.
not even reaching as far down as a SNR of 10, and we could Honeycutt, R. K. 1992, Publ. Astron. Soc. Pacific, 104, 435.
be missing dimmer stars. For the purposes of the automated Law, N. M., et al. 2015, Publ. Astron. Soc. Pacific, 127, 234.
pipeline, we wanted to err on the conservative side, but we Ouellette, J. 2016, Bachelor’s thesis, Guilford College.
could in the future explore whether that cutoff could be reduced Paczyński, B. 2006, Publ. Astron. Soc. Pacific, 118, 1621.
without introducing too many false positives. Seitz, T. 2016, Bachelor’s thesis, Guilford College.
In any case, we hope that this report will give future readers Smith, A. B., Caton, D. B., and Hawkins, R. L. 2016, Publ.
confidence in understanding the conditions and limitations Astron. Soc. Pacific, 128, 055002.
under which our observations were taken. Smith, D., et al. 2003, in Gamma-Ray Burst and Afterglow
Astronomy 2001, AIP Conf. Proc. 662, American Institute
of Physics, Melville, NY, 514.6 Smith and Akins, JAAVSO Volume 47, 2019
Software Bisque. 2019a, Paramount ME robotic telescope Wells, D. C., Greisen, E. W., and Harten, R. H. 1981, Astron.
mount (http://www.bisque.com/sc/media/p/28169.aspx). Astrophys., Suppl. Ser., 44, 363.
Software Bisque. 2019b, theskyx professional edition (http:// Woźniak, P. R., et al. 2004, Astron. J., 127, 2436.
www.bisque.com). Zacharias, N., Finch, C. T., Girard, T. M., Henden, A., Bartlett,
Watson, C., Henden, A. A., and Price, C. A. 2006–2014, J. L., Monet, D. G., and Zacharias, M. I. 2013, Astron. J.,
AAVSO International Variable Star Index VSX (http:// 145, 44.
www.aavso.org/vsx).You can also read