Automatic pollen recognition with the Rapid-E particle counter: the first-level procedure, experience and next steps
←
→
Page content transcription
If your browser does not render page correctly, please read the page content below
Atmos. Meas. Tech., 12, 3435–3452, 2019
https://doi.org/10.5194/amt-12-3435-2019
© Author(s) 2019. This work is distributed under
the Creative Commons Attribution 4.0 License.

Automatic pollen recognition with the Rapid-E particle counter:
the first-level procedure, experience and next steps
Ingrida Šaulienė1 , Laura Šukienė1 , Gintautas Daunys1 , Gediminas Valiulis1 , Lukas Vaitkevičius1 , Predrag Matavulj2 ,
Sanja Brdar2 , Marko Panic2 , Branko Sikoparija2 , Bernard Clot3 , Benoît Crouzy3 , and Mikhail Sofiev1,4
1 Institute
          of Regional Development, Šiauliai University, Šiauliai, 76352 Lithuania
2 BioSense Institute – Research Institute for Information Technologies in Biosystems, University of Novi Sad,
Novi Sad, 21000, Serbia
3 Federal Office of Meteorology and Climatology MeteoSwiss, Payerne, 1530, Switzerland
4 Finnish Meteorological Institute, Helsinki, 00560, Finland

Correspondence: Ingrida Šaulienė (ingrida.sauliene@su.lt)

Received: 10 December 2018 – Discussion started: 21 January 2019
Revised: 15 April 2019 – Accepted: 30 May 2019 – Published: 28 June 2019

Abstract. Pollen-induced allergies are among the most            80 % accuracy for 5 out of 11 species. Fluorescence spec-
prevalent non-contagious diseases, with about a quarter of       tra showed similarities among different species, ending up
the European population being sensitive to various atmo-         with three well-resolved groups: (Alnus, Corylus, Betula and
spheric bioaerosols. In most European countries, pollen in-      Quercus), (Salix and Populus) and (Festuca, Artemisia and
formation is based on a weekly-cycle Hirst-type pollen trap      Juniperus). Within these groups, pollen is practically indis-
method. This method is labour-intensive and requires nar-        tinguishable for the first-level recognition procedure. Con-
row specialized abilities and substantial time, so that the      struction of multistep algorithms with sequential discrimi-
pollen data are always delayed and subject to sampling- and      nation of pollen inside each group seems to be one of the
counting-related uncertainties. Emerging new approaches to       possible ways forward. In order to connect the classification
automatic pollen monitoring can, in principle, allow for real-   experiment to existing technology, a short comparison with
time availability of the data with no human involvement.         the Hirst measurements is presented and the issue of false
   The goal of the current paper is to evaluate the capabil-     positive pollen detections by Rapid-E is discussed.
ities of the new Plair Rapid-E pollen monitor and to con-
struct a first-level pollen recognition algorithm. The eval-
uation was performed for three devices located in Lithua-
nia, Serbia and Switzerland, with independent calibration        1   Introduction
data and classification algorithms. The Rapid-E output data
include multi-angle scattering images and the fluorescence       Pollen of many wind-pollinated plants has specific proteins
spectra recorded at several times for each particle reach-       that cause human allergies (Valenta et al., 1992; Bousquet
ing the device. Both modalities of the Rapid-E output were       et al., 2006, 2015; Radauer and Breiteneder, 2006; Choual
treated with artificial neural networks (ANNs) and the re-       et al., 2018), particularly affecting children (Skoner, 2001;
sults were combined to obtain the pollen type. For the first     Høst et al., 2003; Douladiris et al., 2018). Stress due to con-
classification experiment, the monitor was challenged with       tact with the pollen-contained allergen can cause an allergic
a large variety of pollen types and the quality of many-         reaction or exacerbate some related diseases (Leynaert et al.,
to-many classification was evaluated. It was shown that in       2000; Devillier et al., 2017; Poethko-Müller et al., 2018). Al-
this case, both scattering- and fluorescence-based recogni-      lergies impair the quality of life of about 30 % of the world
tion algorithms fall short of acceptable quality. The com-       population (Akdis et al., 2015). In most European countries,
binations of these algorithms performed better, exceeding        national organizations of various kinds provide information
                                                                 about pollen concentration in the air, publish pollen prog-

Published by Copernicus Publications on behalf of the European Geosciences Union.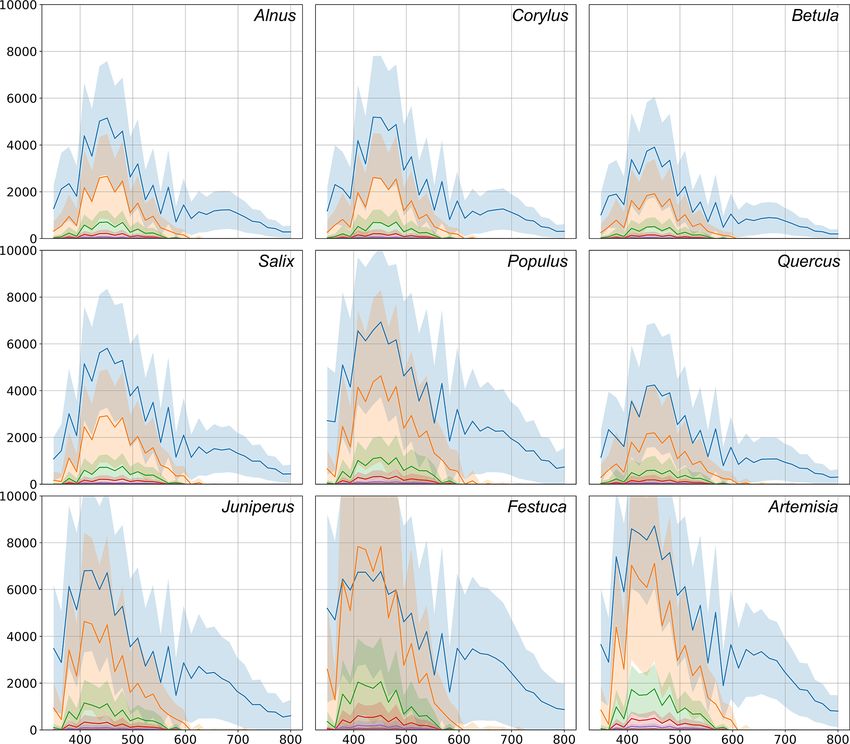
3436                                      I. Šaulienė et al.: Automatic pollen recognition with the Rapid-E particle counter

noses and issue warnings. The bulk of such efforts is based on      particle scattering and fluorescent data from Rapid-E. The
retrospective pollen observations and climatological pollen         key questions to answer were as follows:
calendars. Most observers use Hirst-type volumetric pollen
traps where airborne particles (> 5 µm) are collected on a ro-          – can we identify different pollen genera using the Rapid-
tating drum covered by Melinex tape. Samples are identified               E data?
by a microscopic analysis (Galán et al., 2014; Buters et al.,           – can we identify different species within the same pollen
2018). This method is labour-intensive and tedious, requires              genus?
narrow specialization abilities, and incorporates significant
uncertainties (e.g. Oteros et al., 2017). In addition, due to           – what is the recognition accuracy for the most common
the manual treatment of the collected samples and weekly                  pollen types in Europe?
cycle of the trap, the data are always delayed from a few
days up to a few weeks. However, timely data about pollen           The experiment was performed in Šiauliai (Šiauliai Uni-
concentration in the air are also needed for improving the          versity and Finnish Meteorological Institute), Novi Sad
accuracy of tools for personalized medicine (for example,           (BioSense Institute of the University of Novi Sad) and Pay-
PASYFO app, http://www.pasyfo.lt, last access: 14 Novem-            erne (Federal Office of Meteorology and Climatology Me-
ber 2018; POLLEN app, http://www.polleninfo.org, last ac-           teoSwiss) with three newly acquired experimental Rapid-E
cess: 14 November 2018; NORKKO forecast and app http://             devices. The devices were provided with local pollen sam-
www.norkko.fi, last access: 14 November 2018; etc.) (Bous-          ples and several pollen recognition algorithms have been
quet et al., 2017; Horgan and Pazzagli, 2017; Pereira et al.,       constructed independently in each centre. This organization
2018; Tabatabaian and Casale, 2018). It can also be used            of the study allowed us to account for variability of the ac-
for informing people about the current pollen concentration         tual technical characteristics of the individual devices and an
in the air. Finally, real-time data are needed for short-term       absence of “good practice” for such types of measurements.
pollen forecasts with statistical and atmospheric dispersion        The best classification results compared across the centres
models (Sofiev et al., 2013, 2015, 2017; Prank et al., 2016;        formed the basis of of this paper. Finally, outputs of the Me-
Ritenberga et al., 2016; Zink et al., 2017).                        teoSwiss classifier are compared with airborne pollen data
    As the approach to information and personal responsi-           collected with the Hirst-type pollen trap. The provided time
bility for health is changing, it has become a necessity            series were used to discuss the “false positive” identifications
to develop new methods enabling the information on air-             important for the operational context.
borne pollen to become available in real time. The first at-
tempts to obtain automated information were related to im-          2     Methods
age recognition technologies (Bennett, 1990). Their develop-
ment was accompanied by the formation of more potential             2.1    Description of the measurement instrument
possibilities (Ronneberger et al., 2002; Landsmeer, 2009).
Currently, two types of technologies seem to be the most            The new Rapid-E instrument designed and produced by Plair
suitable for taxon-level classification of pollen: based on im-     SA is the successor of the first-generation particle analyser
age recognition and laser fluorescence (or their combina-           PA-300 used by Crouzy et al. (2016). It is a particle counter;
tions). Image-based technologies are used in detectors, such        i.e. it analyses all particles coming to its inlet one by one. Op-
as BAA500 (Helmut Hund GmbH, https://www.hund.de);                  eration of the instrument is based on two physical principles:
the laser-fluorescence-based approach is implemented in a           scattering of near-UV laser beam and deep-UV laser-induced
wideband integrated bioaerosol sensor (WIBS) device (http:          fluorescence (Kiselev et al., 2011, 2013). Multi-angle scat-
//www.dropletmeasurement.com, last access: 19 Novem-                tering is used for determination of the particle’s morphology,
ber 2018), PA-300 and Rapid-E (Plair, http://www.Plair.ch,          such as size and shape. The fluorescent light is analysed for
last access: 19 November 2018), whereas the new Poleno              its spectrum and lifetime. The instrument constantly takes in
device (Swisens, https://swisens.ch/, last access: 19 Novem-        the ambient air through the air inlet on the top of its panel.
ber 2018) aims at integration of both features. The Hund- and       Sample air flow is up to 2.8 L min−1 with the counting rate of
Plair-manufactured devices were used in limited-scale scien-        up to 4500 particle detections per minute; i.e. the theoretical
tific studies, Oteros et al. (2015) for BAA500 and Crouzy           saturation level is 1.6×10⁶ particles m−3 . Since according to
et al. (2016) for PA-300, and showed promising results.             the device provider the smallest observable particle is 0.5 µm
However, the large-scale evaluation and calibration suitable        in diameter, this saturation level will not be reached in real-
for European-scale applications have yet to be concluded            istic ambient conditions.
(Oteros et al., 2015; Crouzy et al., 2016).                            The sampled air enters the nozzle, which creates a lami-
    The goal of the current paper is to evaluate the capabilities   nar flow in the measurement zone. Particles interact with the
of the new Plair Rapid-E pollen monitor and to construct and        400 nm laser light source and the scattered light is captured
evaluate the first-level pollen recognition algorithms using        by 24 time-resolving detectors distributed at different angles.
                                                                    The information on chemical properties of the particles is

Atmos. Meas. Tech., 12, 3435–3452, 2019                                                www.atmos-meas-tech.net/12/3435/2019/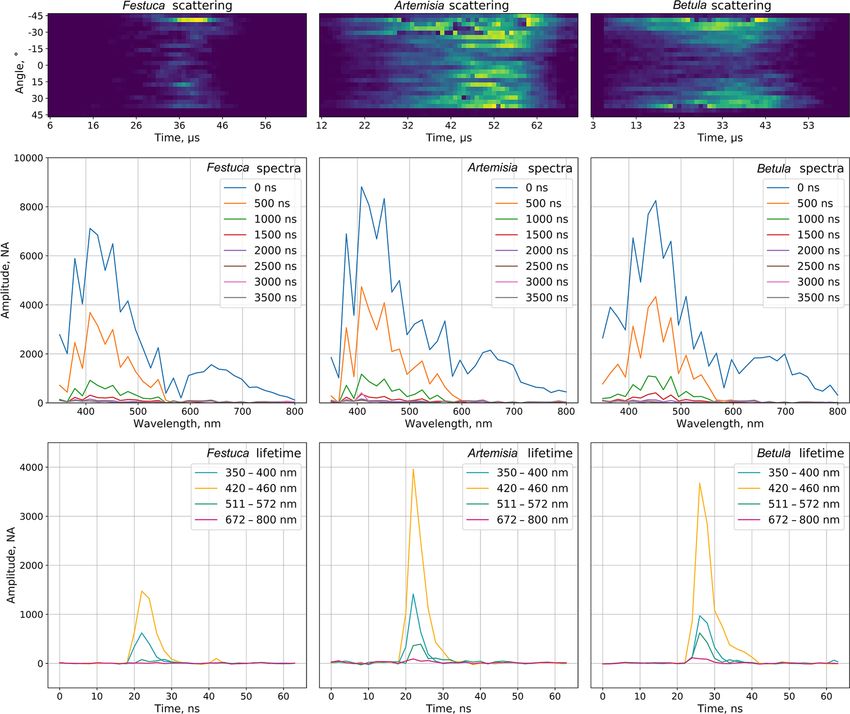
I. Šaulienė et al.: Automatic pollen recognition with the Rapid-E particle counter                                            3437

obtained by a powerful deep-UV laser (320 nm) source that             Every convolutional block consists of the 2-D convolu-
induces fluorescence. Its spectrum (32 measuring channels          tional layer, the batch normalization layer, the rectified linear
within a spectral range of 350–800 nm, eight sequential ac-        unit (ReLU) activation layer and the max-pooling layer. One
quisitions with 500 ns retention) and lifetime (four particular    mask of the convolutional layer has a size of 5 × 5. The con-
bands) are recorded and used for the particle identification       volutional layer of the first block has 16 filters, and the one of
(Fig. 1).                                                          the second block has 32 filters. The max-pooling layer selects
   The threshold of the particle fluorescence intensity (> 1500    the maximal response from the area of 2×2. At the output of
units) was empirically determined as a cut-off level for suf-      the second convolutional block, the size of the feature vec-
ficiently recorded pollen grains. The spectra were subse-          tor is 1760. The first fully connected layer has 256 neurons.
quently normalized to eliminate the difference in the signal       The second fully connected layer classifies these vectors to
strength between the instruments. Rapid-E has an embedded          the number of pollen classes chosen for the calibration. The
mechanism for collecting the particles, which passed through       ANN was trained using the cross-entropy loss criterion. The
the registration chamber onto sticky slides for the follow-up      fluorescence spectrum was processed by a multilayer percep-
microscopic analysis.                                              tron ANN (Fig. 2) with dropout and batch normalization lay-
   The device has several modes of operation. Since the deep-      ers used for regularization. This ANN was also trained using
UV laser has a limited resource, the 400 nm scattering image       the cross-entropy loss criterion. Results of two ANNs were
is used for prior estimation of the particle morphology and        fused by summing scores of every pollen type. The training
deciding if it can be pollen. In the pollen mode, the device       process was monitored to avoid overfitting the networks – see
ignites the deep-UV laser only for the 5–100 µm particle size      the Discussion section.
range (used in this study). Another mode allows detection
of particles in the range of 0.5–100 µm for spores, particu-       2.2.2   Novi Sad
late matter and bacteria identification. However, the expected
lifetime of the deep-UV laser is much shorter in this mode,        All Rapid-E signals (i.e. scattering, fluorescence and life-
especially in polluted atmosphere.                                 time) were transformed into images and jointly processed by
                                                                   a single ANN (Fig. 3). Its architecture considers the same in-
2.2     Data processing and recognition methods                    put dimensions of every image, and since the scatter signal
                                                                   could vary in the number of acquisitions, each image’s width
                                                                   was equalized by finding its centre of mass and either cut-
2.2.1    Šiauliai                                                  ting or zero-padding to fit to 24 × 70 pixels. The dynamic
                                                                   range of each image was reduced by replacing each pixel
Both modalities of the Rapid-E output (scattering image            value with its logarithm, which resulted in enhancement of
and the fluorescence spectra) were processed independently         the low-intensity pixels. Images from temporally resolved
with artificial neural networks (ANNs) and the scores were         spectrum data and all bands of the lifetime data were used
merged to obtain the final classification result.                  unprocessed.
   Both scattering and fluorescence signals (Fig. 1) signifi-          Similarly to Šiauliai, particles with a fluorescence inten-
cantly depend on the particle position with regard to the laser    sity less than 1500 units at the Rapid-E scale at all wave-
beam while passing through it. In particular, the apparent         lengths were filtered out. In addition, particles with calcu-
particle size (scattering) and the fluorescence intensity var-     lated optical size out of the range of 5–100 µm were filtered
ied between the recordings. Apart from that, 15 %–50 % of          out using the manufacturer’s size approximation, depending
particles are missed by the deep-UV laser. Therefore, pre-         on the sum of the scattering image. Size is 0.5 µm if the sum
processing included (i) identification of a characteristic tem-    is less than 5 500 000. If the sum is between 5 500 000 and
plate of 44 × 20 pixels from the scattering image to localize      500 000 000, the size is given by 9.95 × 10⁻¹ · np.log(3.81 ×
the features characteristic for each pollen type; (ii) filtering   10−5 · x) − 4.84 × 10. Finally, if the sum is greater than
of particles with insufficient fluorescence intensity (Table 1);   500 000 000, the size is given by 0.0004 × x 0.5 − 3.9.
(iii) normalization of fluorescence spectrum, (iv) at the first        Each input signal is analysed with its own chain consist-
time moment, inclusion of only 16 of 32 wavelengths in the         ing of 2-D convolutional layers, replication padding layers,
feature vector to exclude the saturated short-wavelength flu-      ReLU activation functions, batch normalization layers, max
orescence bands.                                                   pooling and dropout layers, together forming the convolu-
   Several artificial neural networks (ANNs) were created.         tional block (Fig. 3).
One of the best-performing networks included only scatter-             The convolutional layer of the first scattering block had 10
ing and fluorescence signals, taking them separately and dis-      filters with the kernel size of 5 × 5 while the second one had
regarding the noisy lifetime component.                            20 filters with the kernel size of 3×3. For the spectral images,
   ANN for scattering images consists of two convolutional         the convolutional layer of the first block had 50 filters with
blocks for the feature extraction and two fully connected lay-     the kernel size of 5 × 5, and that of the second block had 100
ers for classification (Fig. 2).                                   filters with the kernel size of 3 × 3. For the lifetime images,

www.atmos-meas-tech.net/12/3435/2019/                                                 Atmos. Meas. Tech., 12, 3435–3452, 2019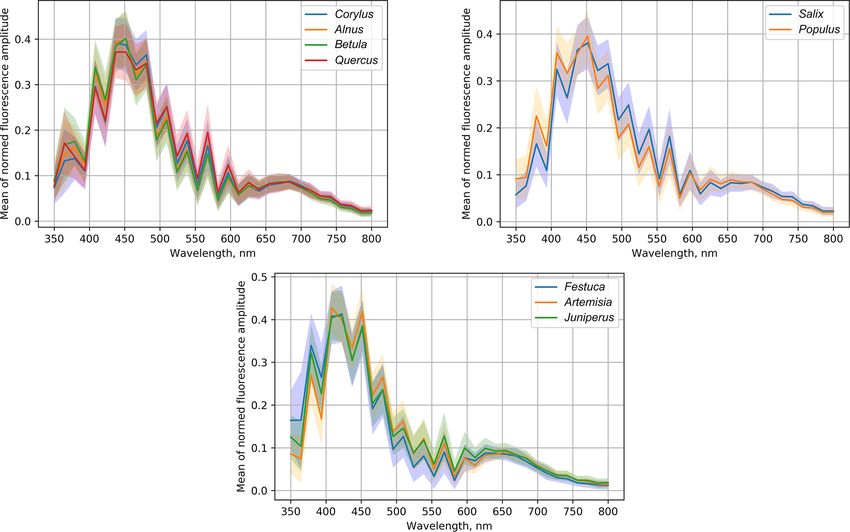
3438                                               I. Šaulienė et al.: Automatic pollen recognition with the Rapid-E particle counter

Figure 1. Examples of scattering images, fluorescence spectra and lifetimes of selected pollen types.

Table 1. Pollen used for testing the identification capabilities of the instrument in Šiauliai.

                          Plant group                     Total particles counted                              Fluorescent
                                                                 by 400 nm laser                                particles∗
                                                                                            Number          Percentage of particles with
                                                                                                            sufficient fluorescence level
                          Festuca                                              21 808         12 205                        56
                          Artemisia                                            15 521         13 370                        86
                          Corylus                                              14 858         10 865                        73
                          Alnus                                                13 692         10 486                        77
                          Betula                                               20 676         12 089                        58
                          Salix alba                                           15 383         13 431                        87
                          Salix fragilis                                       12 942         10 401                        80
                          Populus                                              15 340         10 963                        71
                          Acer negundo                                         11 832          8647                         73
                          Acer pseudoplatanus                                  11 030          7372                         67
                          Juniperus                                            17 926         10 404                        58
                          Quercus                                              17 677          8934                         51
                          Pinus sylvestris                                     14 224          8537                         60
                          Pinus mugo                                           13 399          8287                         62
                        ∗ The particle fluorescence intensity level > 1500 at the Rapid-E scale for at least one emitted wavelength. The initial
                        number of pollen noticed by the scattering laser is not used in the analysis. The algorithms were based on data of
                        fluorescent particles. Calibration datasets were normalized.

Atmos. Meas. Tech., 12, 3435–3452, 2019                                                                           www.atmos-meas-tech.net/12/3435/2019/
I. Šaulienė et al.: Automatic pollen recognition with the Rapid-E particle counter                                                   3439

Figure 2. Neural network for pollen classification in Šiauliai based
on separately treated scattering and fluorescence signals.

                                                                       Figure 4. Neural network used for classification at Payerne.

                                                                          The ANN was trained using negative log-likelihood (NLL)
                                                                       loss and the stochastic gradient descent with a learning rate
                                                                       of 0.001 and a momentum of 0.9.

                                                                       2.2.3   Payerne

                                                                       At the preprocessing stage, all three signals were normal-
                                                                       ized with their maxima. For scattering, the image was ad-
                                                                       ditionally centred and cut to a 24 × 100 shape. Extra filtering
                                                                       was imposed, retaining only calibrations with an optical size
                                                                       above 10 µm and a fluorescence signal in a range and spec-
                                                                       trum compatible with single pollen grains (see Crouzy et al.,
Figure 3. Neural network for pollen classification in Novi Sad using
                                                                       2016, for examples of spectra). The optical size correspond-
all three signals.                                                     ing to 10 µm was estimated by comparing the integral of the
                                                                       scattering signal of 5 µm polystyrene latex particles (PSLs)
                                                                       with the integral of the scattering signal for Urtica and Pari-
the first convolutional layer had 70 filters with a kernel size of     etaria pollen grains.
7×1, the second one had 140 filters with a kernel size of 5×1             For scattering ANN, 5 × 5 convolutions were applied with
and that of the final block had 200 filters with the kernel size       32 filters, ReLU activation and the pooling layers with a
of 3 × 3. At the output of the final convolutional block, the          2×2 window. For lifetime, 1-D convolution was applied with
sizes of the feature vectors for scattering image, fluorescence        ReLU activation, with a window size of 10 × 1 and 10 fil-
spectrum and lifetime are 1800, 1600 and 1400, respectively.           ters. For the spectrometer, asymmetric 2 × 4 convolution was
Each feature vector is passed through one fully connected              applied with eight filters with ReLU activation. The ANN
layer with 50 neurons. Those features were concatenated, re-           was trained using the Adam optimizer and categorical cross-
sulting in the feature vector of dimension of 150. The size of         entropy as loss function (Fig. 4).
the second (last) fully connected layer was the same as the               In order to retain flexibility, additional features were in-
number of classes, after which the samples were classified             serted before the final fully connected layers after Crouzy et
with the log-softmax activation function.                              al. (2016): the maximum and the integral of the scattering
                                                                       together with the maxima of each of the four lifetime bands
                                                                       and the maxima of the first three spectrum acquisitions.

www.atmos-meas-tech.net/12/3435/2019/                                                     Atmos. Meas. Tech., 12, 3435–3452, 2019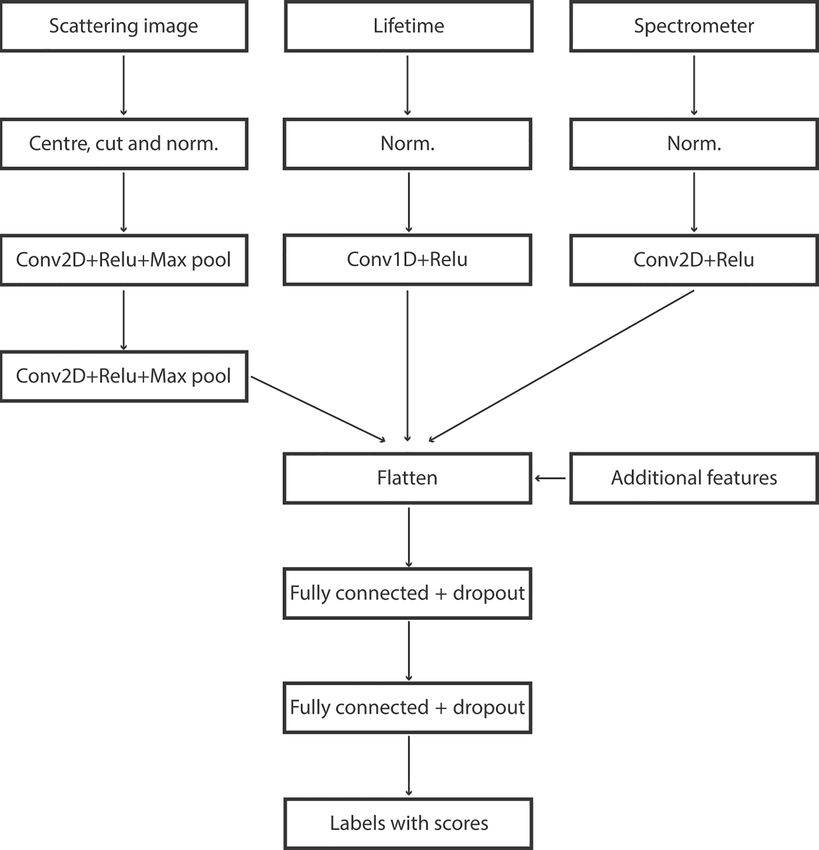
3440                                      I. Šaulienė et al.: Automatic pollen recognition with the Rapid-E particle counter

2.2.4    Additional filtering of false positives in
         operational context

Even if high expectations on the performance of the classifier
are met, problems are bound to occur in the operational ap-
plications due to false positive detections. For example, birch
pollen concentrations regularly exceed 1000 pollen m−3 in
Switzerland in spring. If just 2 % of these are misinterpreted
as ambrosia pollen, for example, the false concentration of
20 grains per cubic metre would already be significant for
allergy analysis. In order to cope with this, extra steps were
introduced in Payerne. Additional filtering was applied dis-
regarding the events with classification quality below a cer-
tain threshold as in Crouzy et al. (2016), where a reduction
of sampling of 20 % led to an increase in precision of about
10 %.
   For the operational monitoring, at least a few events with
an extremely good classification score were required dur-
ing the same or two preceding days to accept the middle-
confidence recognition of the specific pollen type. This con-      Figure 5. The scheme of the experiment for identification of pollen.
dition is applied uniformly over the pollen season to verify
what pollen taxa are present in the air.

2.3     The scheme of the experiment
                                                                   column “fluorescent particles” shows the number of grains
                                                                   with usable fluorescent and lifetime signals.
In this section, we present in detail how the calibration exper-      The experiments were carried out in laboratory conditions
iment was implemented in Šiauliai, followed by the descrip-        with a self-designed manual exposure method (Fig. 5). In or-
tion of specifics of the setups in Novi Sad and Payerne. Most
                                                                   der to isolate the environment of the experiment from the am-
importantly, only pollen characteristic for each location was
                                                                   bient particles, a plastic (PET) bottle was fitted tightly to the
used. Comparison of the results was based on pollen types          Rapid-E inlet. One of the bottle walls was cut open and two
belonging to the same plant families found in all three loca-      holes of ∼ 15 cm2 were covered with a household air filter.
tions.                                                             The filter fabric was tested to hold ∼ 99 % of particles larger
                                                                   than 1 µm in diameter without any noticeable disturbance of
2.3.1    Šiauliai                                                  the air inflow into the device.
                                                                      The pollen was injected into the upper part of the bottle by
The experiment in Šiauliai was carried out with 14 pollen          inserting the pipette tip with the pollen sample into the nar-
morphotypes, the tested amounts of which are given in Ta-          row cut in the bottle and then gently blowing the air through
ble 1. Three genera (Salix, Acer, Pinus) were represented by       the pipette. With the sampling rate up to 2.8 L min−1 , Rapid-
two plant types. All 14 plants are naturally widespread in         E was collecting the pollen grains from the bottle within a
Lithuania and their airborne pollen is abundantly recorded         few tens of seconds. This simple scheme enabled reduction
annually (Šaulienė et al., 2016).                                 of the environmental sample contamination by up to 5 times
   Pollen was taken from the plant inflorescences collected        compared to the unfiltered air in the lab. Each new exper-
during the vegetation period in April–August of 2018 during        iment used a new bottle and the nozzle of the instrument
the days with intense pollen release. The collected material       was cleaned, thus ensuring the removal of previously sam-
was put in air-permeable paper bags and dried at a tempera-        pled pollen.
ture of 40 ◦ C until the maximum release of pollen from the           Quality and level of contamination of the samples was
inflorescences. A vibratory sieve shaker Analysette 3 PRO          manually controlled by using sticky slides. The presence of
was used for gentle shaking of the pollen grains out of the in-    non-pollen particles (debris from the remnants of inflores-
florescences. The extracted pollen was stored in petri dishes      cences) was verified to be substantially less than 1 % by the
at +4 ◦ C.                                                         visual inspection of a subset of the calibration events. Abun-
   Each experiment was performed twice and consisted of up         dance of pollen aggregates (several pollen grains stuck to-
to eight sample tests, using approximately 5 mg of pollen per      gether) was also low but their reliable identification by mi-
sample test. The number of grains registered in the scattering     croscopic analysis was more difficult because of the thick
signal is indicated in Table 1 as “total particles”, whereas the   layer of pollen on the slides. The calibration was performed

Atmos. Meas. Tech., 12, 3435–3452, 2019                                               www.atmos-meas-tech.net/12/3435/2019/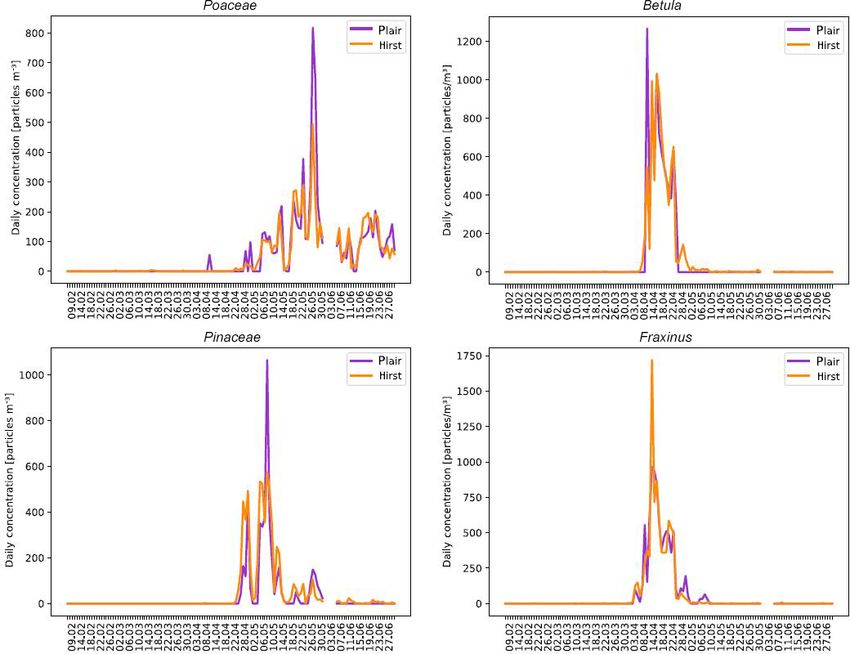
I. Šaulienė et al.: Automatic pollen recognition with the Rapid-E particle counter                                                 3441

Figure 6. Fluorescence spectra (first acquisition) of Salix, Pinus and Acer species.

in pollen mode, which excluded particles smaller than 5 µm                ibrations were performed for 21 different taxa. Focus was
of optical size.                                                          set on repeating calibrations, if possible under varying con-
                                                                          ditions. Only fresh pollen was used and time between col-
2.3.2   Novi Sad                                                          lection and calibration was reduced to a minimum (range:
                                                                          15–120 min). The presence of agglomerates and debris was
The scheme of the pollen exposure experiment was similar to               investigated by collecting histograms of the optical size and
that in Šiauliai. The exposure was conducted on the roof by               of the fluorescence intensity of the recorded events. Cut-offs
fitting the PET bottle to the sampling pipe after removing the            were introduced accordingly, in order to retain only single
Sigma-2 inlet. Manual microscopic analysis of sticky slides               pollen grains. The device was also in pollen mode; i.e. it fil-
was used to confirm the quality of samples and absence of                 tered out particles smaller than 5 µm of optical size.
non-pollen debris and pollen agglomerates. The device was
also in pollen mode; i.e. it filtered out particles smaller than
5 µm of optical size.                                                     3     Results obtained in Šiauliai
    Classification was tested for an adjusted set of pollen mor-
photypes accounting for the availability of the fresh material            The analysis was started from a semi-qualitative considera-
during the study season. In particular, Juniperus was replaced            tion of the fluorescence spectra, primarily aiming at demon-
by Taxus and Festuca was replaced by Cynodon and Dactylis,                stration of the capabilities and the limitations of the approach
aiming to assess the degree of discrimination between dif-                and preliminarily assessing the principal possibility of con-
ferent grass genera. Similarly, Picea and Cedrus pollen was               structing a reliable particle recognition algorithm.
used for assessing differences between the same pollen mor-
photype. Only Acer negundo was analysed as it is the only                 3.1     Qualitative comparison of the fluorescence spectra
Acer pollen that is recorded regularly in Serbia. Fraxinus (in-                   of different pollen species
cluding both F. excelsior and F. ornus) was added to the test
as it is commonly recorded throughout spring.                             3.1.1    Comparison of fluorescence spectra of different
                                                                                   species of the same genus
2.3.3   Payerne
                                                                          The experiment included three genera, for which we col-
Low ambient concentration of coarse particles allowed a less              lected pollen from different species (Table 1): Salix, Pinus
laborious approach: pollen calibrations in Payerne were per-              and Acer. Their fluorescence spectra are shown in Fig. 6,
formed by directly blowing the material into the Sigma 2 in-              where the solid lines represent the normalized mean spec-
let, without protection from contamination. The details of the            trum and shadows show the standard deviation range. The
procedure are described in Crouzy et al. (2016). In order to              uncertainties of the mean spectra were a fraction of a percent-
obtain a reasonable panel of the relevant pollen types, 60 cal-           age, leading to the statistically significant difference (p <

www.atmos-meas-tech.net/12/3435/2019/                                                       Atmos. Meas. Tech., 12, 3435–3452, 2019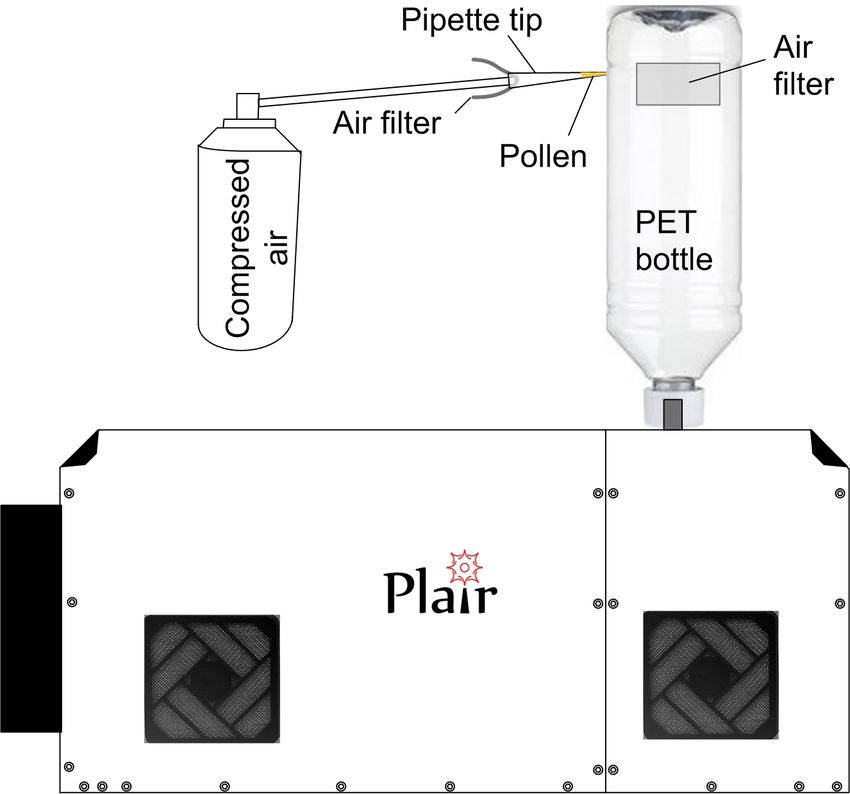
3442                                        I. Šaulienė et al.: Automatic pollen recognition with the Rapid-E particle counter

Figure 7. Comparison of fluorescence indicators of the tested pollen. The blue line represents the first acquisition. All other lines are
acquisitions delayed by a step of 500 ns from the last. Shadows show the standard deviation ranges for each acquisition. In the figures, the
x axis represents the wavelength, nm. The y axis shows the amplitude; units not available.

0.001) at all wavelengths for both Pinus and Acer mean spec-            considered in the current paper. Practical work was therefore
tra and even for some wavelengths of the Salix spectra.                 left for the follow-up studies.
   Despite statistically significant differences between the
mean spectra, the sample standard deviation (shadowed                   3.1.2    Comparison of fluorescence spectra of species of
ranges in Fig. 6) was quite large. Therefore, it was not pos-                    different genera
sible to distinguish between Salix alba and Salix fragilis.
The normalized spectra of Pinus sylvestris and Pinus mugo
                                                                        The study included 11 different pollen genera (Table 1),
coincided at the maximum value of the amplitudes at the
                                                                        whose spectra are shown in Fig. 7 for recordings at every
wavelength of 460 nm but the mean amplitude of the Pi-
                                                                        500 ns starting from the first pulse reaching the detector. For
nus sylvestris spectrum was higher in the short-wave range
                                                                        all species, the most intense fluorescence was observed for
(< 450 nm). At the longer wavelengths (480–550 nm) the am-
                                                                        the wavelengths from 390 to 570 nm, with different locations
plitude was higher for the Pinus mugo pollen. However, these
                                                                        of the maximum and with different amplitude. For example,
differences were well inside the sample standard deviation.
                                                                        the highest mean intensity of fluorescence was recorded for
The difference between the species of the Acer genus was
                                                                        the Artemisia pollen: it exceeded > 7000. Meanwhile, the am-
the most pronounced and, even taking the sample variability
                                                                        plitudes of Betula and Quercus reached more than 4000. In
into account, these were the ones that could be distinguished.
                                                                        all cases, the first pulse had a wider wavelength range than
The Acer pseudoplatanus spectrum showed a higher ampli-
                                                                        the subsequent ones. The amplitudes of already the second
tude than Acer negundo in the short-wave range and lower
                                                                        recording (500 ns from the first pulse) were close to zero for
amplitude in the central part of the spectrum (400–520 nm).
                                                                        wavelengths longer than 600 nm.
   Therefore, two out of three tested genera allowed, in prin-
                                                                           In addition, Fig. 7 shows that not only the intensity of the
ciple, an inter-genus species classification using the pollen
                                                                        first signal between separate genera differs, but the shape of
fluorescence spectrum. However, the differences between
                                                                        the second recording is also specific, which is significant for
them were evidently too small for the multispecies algorithm
                                                                        the identification of the pollen morphotype. For example, the
                                                                        difference in fluorescence intensity of Salix pollen between

Atmos. Meas. Tech., 12, 3435–3452, 2019                                                     www.atmos-meas-tech.net/12/3435/2019/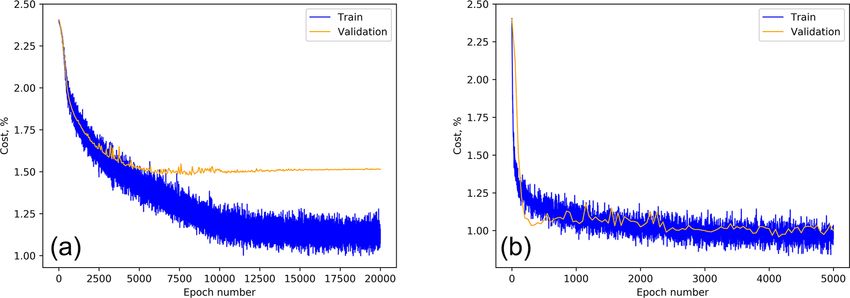
I. Šaulienė et al.: Automatic pollen recognition with the Rapid-E particle counter                                          3443

the first and second signals was larger than for other tested      well but the recognition of the individual species of this fam-
taxa. Tests with Festuca pollen actually showed that, unlike       ily was poor.
all other species, the signal amplitude grows during the first        The overall accuracy was very similar for Šiauliai and
500 ns, resulting in the absolute maximum intensity of the         Novi Sad and somewhat better for Payerne, partially owing
spectrum registered at the second recording, 500 ns after the      to the stricter filtering of the raw data. Although it is dif-
fluorescence is induced.                                           ficult to make an exact comparison of the confusion tables
   The qualitative analysis of the data was continued by           between the studies, it still sheds some light on the overall
grouping the data according to similarity of the fluorescence      performance and also highlights the similarities and differ-
spectrum of the first recording (Fig. 8).                          ences between the regions. Comparing the Tables 2 and 3,
   Alnus, Corylus and Betula plants are in one taxonomic           one can see that the difference in the recognition quality is
family, and our results indicate that their pollen has a similar   about 10 % for most species, and practically identical for Be-
fluorescence spectrum. Interestingly, according to the simi-       tula (∼ 50 % in both studies) and Quercus (∼ 60 %).
larities of the fluorescence spectra, Quercus pollen appeared         Somewhat higher skill in Novi Sad was obtained for Cory-
in the same group with Betulaceae, although the maximum            lus, Alnus and Populus while in Šiauliai higher skill was
value of its mean of the normalized spectrum was the lowest        reached for Acer and Artemisia. It is interesting to note that
in the group.                                                      the confusion between the two chosen grass pollen morpho-
   Another group in which the pollen fluorescence curves           types in Novi Sad was not notable and for these genera the
have similar shapes also consists of pollen of woody plants:       Rapid-E data have certain discrimination potential. One can
Populus and Salix. They also bloom at a similar time; there-       therefore conclude that the multispecies discrimination algo-
fore their precise identification is an important but, as seen     rithms applied in these studies showed similar recognition
from Fig. 8, challenging task. The tested grass pollens form       skills. It should be stressed however that the training of the
a separate group, which however also included pollen of            ANNs was completely independent and used local pollen
the woody plant Juniperus. This group is characterized by          grains. Therefore, the similar recognition quality does not
the high mean amplitude in the short-wavelength (< 400 nm)         imply similar pollen in these regions.
range.                                                                As mentioned earlier (Sect. 2.2.3), the calibration proce-
                                                                   dure used at MeteoSwiss was slightly different than in Novi
3.2     Recognition skills                                         Sad and in Šiauliai. In addition, the focus at MeteoSwiss was
                                                                   more towards operational applications. As a consequence,
                                                                   only a subset of the 60 calibrations was used to train the clas-
The key practical question for Rapid-E application in daily
                                                                   sifier. Only taxa with high relevance for monitoring or for
pollen monitoring is the accuracy of the pollen type clas-
                                                                   which very good calibrations were available were selected. It
sification presented below via the confusion matrices. In
                                                                   was noticed that increasing the number of taxa could worsen
these matrices, rows represent the actual type of pollen and
                                                                   the problem of false positive detections (see below). An opti-
columns are the assigned type. All values are a percentage,
                                                                   mum for monitoring purposes was found when using 10 taxa.
and the sum of values over each row is 100 %: every pollen
                                                                   The performance of the corresponding classifier is shown in
has to be assigned to some type.
                                                                   Table 4.
                                                                      It is interesting to note that, as expected, most errors oc-
3.2.1    Comparison of the confusion tables obtained in            cur within the Betulaceae family, with an extremely low re-
         Novi Sad, Payerne and Šiauliai                            call for Alnus. It was hypothesized that, although calibrations
                                                                   were repeated, the classifier may to some extent recognize
The recognition procedure in Šiauliai was built indepen-           the conditions under which the calibration was performed
dently for scattering and fluorescence signals with subse-         and quality of the sample. Obtaining a classifier working only
quent fusion of the results. The tables for the individual com-    on the generic features of the taxa is a very difficult task. A
ponents are presented in the Supplement. Tables S1 and S2 in       holistic validation procedure, going from the analysis of de-
the Supplement present the outcome of the combined identi-         vice raw output (Sect. 3.1) analysis to the comparison with
fication using both the scattering image and the fluorescence      reference measurements (Sect. 4.5), is therefore essential.
spectra. With the exception of Alnus, the combination of the
identification methods showed better recognition skills than
each of the methods separately. Overall, the improvement
over individual methods was ∼ 23 % compared to scattering          4     Discussion
images and ∼ 7 % compared to fluorescence.
   Overall, 6 out of 11 tested pollen genera were identified       4.1    Overtraining – a problem?
with accuracy better than 75 %. The best results (> 91 % of
correct classification) were achieved for Pinus pollen. The        The problem of potential overtraining was addressed from
pollen of the Betulaceae genus was identified comparatively        two directions: via the standard training vs. test dataset eval-

www.atmos-meas-tech.net/12/3435/2019/                                                 Atmos. Meas. Tech., 12, 3435–3452, 2019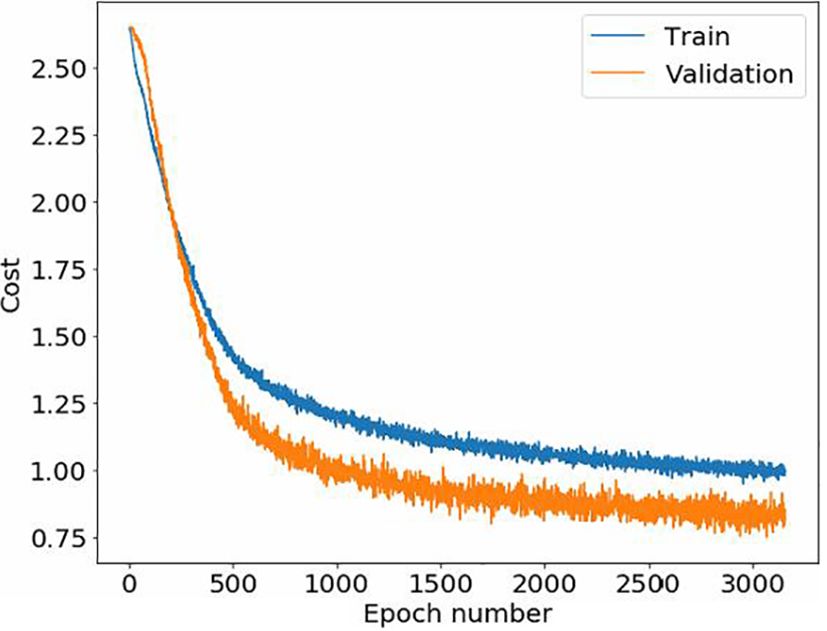
3444 I. Šaulienė et al.: Automatic pollen recognition with the Rapid-E particle counter
Figure 8. Groups with similar fluorescence spectra.
Table 2. Confusion table obtained in Šiauliai. Accuracy is 73 %.
Plant genus Festuca Artemisia Corylus Alnus Betula Salix Populus Acer Juniperus Quercus Pinus
Festuca 88 1 0 0 0 0 2 5 2 0 2
Artemisia 2 86 0 0 0 2 1 4 5 0 0
Corylus 2 0 63 17 8 1 0 0 0 9 0
Alnus 1 0 15 53 18 2 1 0 0 9 1
True label
Betula 3 1 9 30 47 1 1 0 1 6 1
Salix 1 1 2 1 2 78 10 0 1 4 0
Populus 3 6 1 1 1 18 58 3 3 5 1
Acer 5 2 1 1 1 0 2 86 1 1 0
Juniperus 4 4 0 0 0 0 3 1 87 0 1
Quercus 2 0 9 10 5 4 1 0 0 69 0
Pinus 7 0 0 0 0 0 0 0 1 0 91
Predicted label
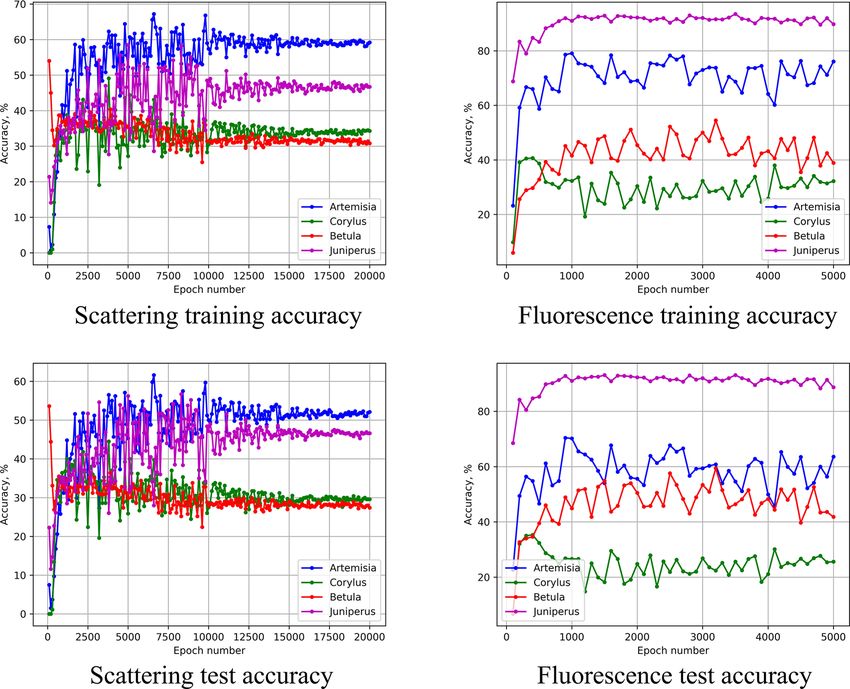
uation and via an explicit verification of homogeneity of the based training, a similar consideration suggested the epoch
datasets. 3500 as the optimum.
For Novi Sad (Fig. 10), the training was stopped before
the overfitting picked up and thus the parameters of the last
4.1.1 Performance in the training and test datasets
trained epoch 3000 were used.
Prior to starting the ANN training, all datasets were split into 4.1.2 Test of homogeneity of the calibration datasets
the training and test subsets. The test subset in Šiauliai con-
sisted of 1000 particles picked at the end of every calibration One of the concerns regarding the fluorescence-based tech-
event while all other particles were used for training. The Ši- nology is the stability of the spectra for different conditions
auliai ANN training continued until saturation of the recog- of pollen grains, which are affected by ambient humidity,
nition quality for the training dataset (see example in Fig. 9), temperature, time they spend in the air, chemical interaction
thus including the overfitting range. The maximum perfor- and degradation, etc. Full-scale evaluation of this problem
mance of the fluorescence-based recognition was obtained lies beyond the scope of this paper. Here, we only present a
at the epoch of ∼ 900, after which the overfitting gradually brief check demonstrating that it was not the major issue.
picked up. Therefore, the ANN parameters after this epoch As stated in the methodological section, the calibration set
were taken as the study outcome. For the scattering-image- for each pollen type in Šiauliai consisted of up to eight inde-
Atmos. Meas. Tech., 12, 3435–3452, 2019 www.atmos-meas-tech.net/12/3435/2019/I. Šaulienė et al.: Automatic pollen recognition with the Rapid-E particle counter 3445
Table 3. Confusion table obtained in Novi Sad. Accuracy is 74 % (obs. different number of species).
Plant genus Dactylus Cynodon Corylus Alnus Betula Salix Fraxinus Populus Acer Artemisia Taxus Quercus Picea Cedrus
Dactylus 78 3 0 3 0 2 0 4 5 0 1 0 0 0
Cynodon 4 70 0 0 0 6 1 0 0 12 5 0 2 0
Corylus 0 0 64 6 12 1 10 0 0 0 4 2 0 0
Alnus 1 2 6 72 3 2 3 2 1 2 6 3 0 0
Betula 1 0 25 5 51 3 3 0 0 1 1 10 1 0
Salix 3 1 0 2 1 80 3 2 2 2 1 3 1 0
True label
Fraxinus 0 0 7 1 3 2 79 1 0 0 4 3 0 0
Populus 5 3 1 4 0 4 3 71 1 1 3 4 1 0
Acer 8 1 0 2 1 4 0 0 73 0 1 9 1 0
Artemisia 1 5 0 2 1 4 0 1 0 84 0 1 1 0
Taxus 0 3 0 2 0 0 0 0 0 0 93 1 1 0
Quercus 1 0 4 5 8 9 2 1 1 1 1 63 4 0
Picea 3 3 0 2 4 3 0 1 1 7 1 13 61 0
Cedrus 0 0 0 0 0 1 0 1 0 1 0 0 1 95
Predicted label
Table 4. Confusion table obtained at MeteoSwiss, Payerne. Accuracy is 80 %.
Plant genus Alnus Betula Carpinus Cupressus Fagus Fraxinus Corylus Pinus Poaceae Taxus
Alnus 27 27 1 0 0 1 43 0 0 1
Betula 1 83 2 0 0 4 7 0 0 1
Carpinus 0 13 74 0 0 2 3 0 6 1
Cupressus 0 3 1 84 0 0 1 2 1 8
True label
Fagus 0 2 3 1 88 0 1 1 2 3
Fraxinus 0 12 2 0 0 78 2 1 2 3
Corylus 4 8 0 0 0 0 87 0 0 0
Pinus 0 0 0 0 0 0 0 98 0 2
Poaceae 0 3 8 1 0 1 0 1 82 4
Taxus 0 0 0 1 0 0 0 1 0 97
Predicted label
pendent calibration sessions for four species; these sessions have been undertaken. However, even the most success-
were performed on different days and thus with pollen of ful tests carried out with WIBS-4 (O’Connor et al., 2014),
different ages. A simple check of homogeneity of the flu- Hund BAA500 (Oteros et a., 2015), Yamatronics KH-3000-
orescence spectra is then to use the data of one of these 01 (Kawashima et al., 2017) and Plair PA-300 (Crouzy et
days as the training set and those from another day as the al., 2016) devices, strongly advancing the pollen monitoring
test subset. A substantial difference in the recognition qual- field, left open the questions of scalability and replicability
ity would point at the inhomogeneous data. Distinguishing of the results. They also did not touch the topics related to
the four species is simpler than 11 but the difference between application of the tested systems in the operational context.
the training and test recognition quality is important. Application of yet another new device – Plair Rapid-E – in
Comparing the upper and lower rows of Fig. 11, one can our study pursued, apart from the scientific objectives, opera-
see that for the above epochs (3500 for scattering- and 900 tional implementation as a mid- to long-term goal. However,
for fluorescence-based ANNs), the quality of recognition for having tested 14 different pollen morphotypes, we found that
the training subset (one day) and test subset (another day) significant work is still needed.
differs by < 5 % for all four species. Therefore, we conclude One of the challenges to the automatic monitors is the rich
that the conditions during the different days of calibration did mixture of pollen types in Europe that all pose significant
not affect the homogeneity of the dataset. allergenic threat. This makes it particularly difficult for the
monitors to satisfy the needs of allergic people and allergists
4.2 Comparison with other studies on pollen – unlike in many other regions. For instance, Cryptomeria
recognition japonica identified more than 10 years ago by Kawashima
et al. (2007) is still the main pollen type recognized by that
system (Kawashima et al., 2007; Wang et al., 2013, 2014;
During recent years, a number of attempts to obtain infor-
mation about pollen concentration in the air in real time
www.atmos-meas-tech.net/12/3435/2019/ Atmos. Meas. Tech., 12, 3435–3452, 20193446 I. Šaulienė et al.: Automatic pollen recognition with the Rapid-E particle counter
Figure 9. Šiauliai ANN multispecies cost function for scatter-based (a) and fluorescence-based (b) recognition as a function of the training
epoch.
in the studies conducted by O’Connor et al. (2011). They as-
sessed the fluorescence spectrum of pollen of the Betulaceae
family and stated that “birch and alder spectra closely resem-
ble each other although there is a possibility that the birch
pollen is less fluorescent than alder”. Our results show that
in the case of Alnus, the fluorescence amplitudes are higher
than of Betula but the spectra are indeed similar.
Similar spectra of Salix and Populus pollen (Fig. 7) also
resulted in poor differentiation between them. At the same
time, the degree of confusion was higher for Populus than
for Salix (Tables 2–4). This is in agreement with the results
obtained with Hund BAA500 by Oteros et al. (2015), who
identified Salix pollen as the worst of pollen types analysed
(Oteros et al., 2015). The BAA500 algorithm is based on
Figure 10. Novi Sad ANN overall cost as a function of the training recognition of the particle shape, which can be weakly re-
epoch. The evaluation error is lower than the training error due to lated to the scattering images in our study – the very part that
dropout (0.5) in each convolutional and fully connected layer, not showed substantial confusion of almost all studied pollens
used in the validation round. with Salix and Populus.
Crouzy et al. (2016) suggested that a non-zero fluores-
cence amplitude around the 600 nm wavelength is incompati-
Takahashi et al., 2018). However, it seems to be more or less ble with pollen from the Betulaceae family (Alnus, Carpinus,
sufficient for that region. Corylus and Betula) but could possibly be observed for grass
Varying levels of allergenicity of species within a single pollen (Dactylis and Phleum) (Crouzy et al., 2016). Our re-
genus or a family raise the question of whether intra-genus sults support this suggestion and in addition the test in Novi
classification is possible. Hirst-based manual techniques do Sad shows that ANN could show some discriminatory power
not allow it: pollen grains are too similar in the microscopic between Dactylis and Cynodon. Noteworthy, recognition of
analysis. Our results show that such a level of identification the herbaceous plants (Festuca, Artemisia) was also consid-
is not immediately possible using Rapid-E information ei- erably better than that of pollen of the Betulaceae family in
ther. In particular, our data demonstrated that the fluores- Šiauliai (Table 2).
cence spectra of the Salix alba and Salix fragilis species were One can note that the recognition accuracy of this study
almost identical. More promising were the experiments with (just above 70 %) is in an apparent contradiction to the
Pinus and Acer (Fig. 6) and some grasses (Table 3) where the results of Crouzy et al. (2016), where the skill was sig-
work should be continued with different identification algo- nificantly higher: 91 % was obtained with PA-300. How-
rithms built for these very species after their separation from ever, there are several important differences between the ap-
other pollen types. Other genera should also be tested. proaches. Firstly, the pre-filtering of the particles is substan-
Fluorescence spectra can be similar not only between tially stricter and about 20 % of classifications were filtered
species of a particular genus but also between different fami- out as uncertain (failed the threshold of the classification
lies. Several groups of otherwise unconnected species mani- quality). Secondly, the accuracy of the recognition depends
fested very similar spectra, to a degree that did not allow their significantly on the number of pollen morphotypes used for
reliable differentiation (Fig. 8). Similar results were obtained the test (eight by Crouzy et al., 2016). In an extreme case,
Atmos. Meas. Tech., 12, 3435–3452, 2019 www.atmos-meas-tech.net/12/3435/2019/I. Šaulienė et al.: Automatic pollen recognition with the Rapid-E particle counter 3447
Figure 11. Performance of the Šiauliai ANN for the test subset taken from different days than the calibration subset. Values are percentages.
automated discrimination of just one species (Cryptomeria abled us to distinguish unique ranges of light-scattering in-
japonica) from non-pollen particles using KH-3000 was al- tensities for each taxon. However, the reliability of the algo-
ready high 10 years ago (Kawashima et al., 2007, 2017). rithm is known only for five pollen morphotypes. Develop-
Similarly, the high fraction of BAA500 true positive counts ment of this and similar approaches for the Rapid-E scatter-
(93.3 %) against manual analysis of individual species by ing images may eventually improve this line of analysis and,
Oteros et al. (2015) went down to 65 % when the recogni- subsequently, push up the overall scores.
tion of 13 pollen morphotypes was requested. It took an ad- Since the output of the ANN can be transformed to give
ditional training of the algorithm to raise it up to the same a vector of probabilities, where each element i of the vec-
72 % as in our study. Finally, it should also be noted that PA- tor represents the probability that the sample belongs to class
300 delivers fewer parameters than Rapid-E, possibly mak- ci , we expect improvement of the classification accuracy if
ing it difficult to identify the important combinations in the we demand that the classification occurs only if the high-
raw signal in a single-level many-to-many identification task. est probability in that vector is greater than some probability
Application of additional levels of the discrimination filters threshold, but with the price of discarding the samples below
can improve the results. the defined threshold. This direction was initially explored
by Crouzy et al. (2016) and showed high potential: discard-
4.3 Possible ways to improve the recognition skills ing 20 % of samples led to an increase in precision of about
10 % (see also Sect. 2.2.4).
The dependence of the recognition quality on the number of As a more radical approach, one can challenge the usage
categories is one of the directions of future research. It may of ANNs without a priori relations derived from physical or
be possible to consider independent groups of pollens that chemical features of each pollen type. Even generic consid-
never (or very rarely) appear in the air at the same time – but erations of scattering and fluorescence theories might hint at
it can make the algorithm place-specific. It is vital however to quantities, which show enhanced contrast in comparison with
obtain improvement of the algorithm for reliable separation the raw data. This idea was tested in the Payerne algorithm
of pollens that can be in the air together (e.g. Betulaceae, and showed its potential.
Quercus and the like).
Considering improvements of the recognition algorithms,
Matsuda and Kawashima (2018) suggested the “extract win-
dow” method of analysis of the scattering images, which en-
www.atmos-meas-tech.net/12/3435/2019/ Atmos. Meas. Tech., 12, 3435–3452, 20193448 I. Šaulienė et al.: Automatic pollen recognition with the Rapid-E particle counter
Figure 12. Comparison between automatic (Plair Rapid-E) and manual (Hirst-type) pollen counts for Betula, Fraxinus, Pinaceae and
Poaceae.
4.4 Lessons from the comparison of the Hirst and Poaceae. False positives are a significant issue with Fraxinus:
Rapid-E measurements the sampling is dramatically reduced (75 %) for higher fluo-
rescence thresholds. As a consequence of those limitations,
Comparison of Rapid-E of MeteoSwiss with the operational the results presented here should not be taken as a complete
Hirst measurements in Payerne from February to June 2018 demonstration of operational capabilities.
extended the results of Crouzy et al. (2016) to more impor- The suppression of the false positive detections as de-
tant taxa (Fig. 12), but also showed that robust determination scribed in Sect. 2.2.4 worked quite efficiently but still an
of the sampling still needs to be achieved. evident false positive event resulting from the Betula mis-
In order to obtain pollen concentrations, large particles interpretation as Poaceae is visible in the beginning of April.
presenting bimodal fluorescence spectra with position and Further work is required to completely remove such events,
intensity of maxima compatible with the observations made and, as a last resort, expert supervision could be used in an
from calibrations (see Sect. 3.1) were first selected. Then, operational setup.
the classifier presented in Sect. 2.2.3 was applied. The effec-
tive sampling of Rapid-E is the result of a series of physi- 4.5 Opinion of the Rapid-E producer
cal and algorithmic processes: the sampling efficiency of the
Sigma-2 head, the imperfect targeting by lasers and the drop- During the work, we have been in periodic contact with the
offs due to the below-threshold classification. In Fig. 12, the Plair company regarding features and issues of the Rapid-
Rapid-E data are scaled with species-dependent factors (con- E devices used by our groups. With the paper finalized, we
stant over the season), bringing the seasonal mean to that of asked for their feedback.
the Hirst time series. The issue deserves attention since, as Denis Kiselev, Plair, said
shown by the Novi Sad results, tightening the thresholds im-
proves the recognition skills but increases the drop-offs at Our impression concerning the presented material
the recognition stage. Sampling with Poaceae is the high- is mixed. While I see some positive and encourag-
est, Pinaceae presents a 2 % decrease in sampling and Be- ing results, my main critiques would be addressed
tula presents a 33 % decrease in sampling with respect to to your calibration sets, whose cleaning and fil-
Atmos. Meas. Tech., 12, 3435–3452, 2019 www.atmos-meas-tech.net/12/3435/2019/I. Šaulienė et al.: Automatic pollen recognition with the Rapid-E particle counter 3449
tering falls short of the actual needs. Our results The in-depth discussion and improvement of the method-
are 5 %–10 % better without overfitting the data or ology and the extension to more taxa goes beyond the scope
other special processing. The time series Plair gets of this paper. We decided to communicate the current results
for “problematic pollens” like Betula, Corylus and early, as well as the methods developed independently by the
Alnus are actually very good. Our goal is to obtain three teams currently working with the Rapid-E counters, in
high-quality time series calculated in real time by order to stimulate parallel developments by the user commu-
the instruments and the good calibration is essen- nity of the Rapid-E devices. The emergence of such a com-
tial for that. munity is a good opportunity to address generalization and
replicability of the device-specific results. We also believe
We agree with importance of the calibration datasets; that moving from expert supervision or calendar methods to
the procedures ensuring their quality are described in the the approach presented here and based only on device out-
Methodology section and further explained in the discussion puts for elimination of false positive detections could be of
above. Note that our groups were working largely indepen- help for other automatic monitoring systems.
dently using local pollen and original methods of the data
collection and processing. Therefore, the similarities in the – Among the main challenges to be resolved in future
observed features provide additional support for our conclu- work, the most important ones are
sions. Unfortunately, details of the Plair analysis were not
– to obtain reliable recognition skills at least for the pollen
available when the paper was prepared. Therefore, indepen-
types that can be in the air at the same time
dent evaluation of that algorithm against the common criteria
described in this paper was not possible. – to reach full replicability of the algorithms and results
across the different copies of the same monitors (we are
thankful to the Plair team for suggesting the scripts ad-
5 Conclusions dressing this problem, which are now under evaluation)
We conducted the first analysis of the pollen monitoring ca- – to resolve specific questions related to the algorithm
pabilities of the new automatic pollen detector Plair Rapid-E. construction and training – including the minimal sam-
Using the very limited data pre-processing and basic ANN ple volume, problems of over- and underfitting, prepro-
classification it was shown that, if comparatively large num- cessing and pre-filtering of the data, false positive iden-
bers of pollen types are considered, stand-alone scattering- tifications, etc.
and fluorescence-based recognition algorithms fail to pro- Successful resolution of these questions will open the way
duce reliable results for the majority of species. The combi- for wide applications of the automatic particle counters for
nation of these algorithms performed better, exceeding 80 % pollen observations.
accuracy for 5 out of 11 species. Therefore, this combina-
tion can be considered the first-stage classification of pollen
types. It should be followed by more in-depth discrimination Code and data availability. All data and algorithms presented in
efforts, also including lifetime of florescence in the classifi- the paper are experimental and subject to further development. They
cation model. are available for research purposes on request to the authors of the
The fluorescence spectra showed similarities among sev- paper. Work is in progress to harmonize the algorithms and make
eral tested species ending up with three groups: (Alnus, Cory- them public together with the data via open software and data repos-
lus, Betula and Quercus), (Salix and Populus) and (Festuca, itories. The possibility of a GPL-type license is being evaluated.
Artemisia and Juniperus) – as identified from the Šiauliai
data. The classification between the groups was compara-
tively easy. Attempts to distinguish between the species of Supplement. The supplement related to this article is available
the same genus showed certain potential for some genera but online at: https://doi.org/10.5194/amt-12-3435-2019-supplement.
more work is needed.
The results obtained in Šiauliai and Novi Sad with a very
Author contributions. All the authors made significant contribu-
similar experimental setup but independent analysis, showed
tions to this study. The conceptualization was performed by MS
comparable results confirming the overall conclusions. They Experiments in Šiauliai were conducted by IŠ, LŠ, GD, GV and
also pointed out certain limitations of replicability of the raw LV; in Novi Sad by PM, SB, MP and BS; and in Payerne by BC and
data features between the devices, which will require an addi- BCr. All authors contributed to the methodology, the interpretation
tional conversion step to make them compatible. In this line, of the results and the editing of the paper.
the comparison performed at MeteoSwiss shows a reason-
able potential for automatic monitoring of important taxa;
however it is not clear to which extent algorithms can be Competing interests. The authors declare that they have no conflict
transposed from one device to another. of interest.
www.atmos-meas-tech.net/12/3435/2019/ Atmos. Meas. Tech., 12, 3435–3452, 2019You can also read