Discharge of groundwater flow to Potter Cove on King George Island, Antarctic Peninsula - HESS
←
→
Page content transcription
If your browser does not render page correctly, please read the page content below
Hydrol. Earth Syst. Sci., 25, 3227–3244, 2021
https://doi.org/10.5194/hess-25-3227-2021
© Author(s) 2021. This work is distributed under
the Creative Commons Attribution 4.0 License.

Discharge of groundwater flow to Potter Cove
on King George Island, Antarctic Peninsula
Ulrike Falk1,2 and Adrián Silva-Busso3,4
1 Climate  Lab, Institute for Geography, Bremen University, Bremen, Germany
2 Center  for Remote Sensing of Land Surfaces (ZFL), Bonn University, Bonn, Germany
3 Faculty of Exact and Natural Sciences, University of Buenos Aires, Buenos Aires, Argentina
4 Instituto Nacional de Agua, Ezeiza, Buenos Aires, Argentina

Correspondence: Ulrike Falk (ulrike.falk@gmail.com)

Received: 17 August 2020 – Discussion started: 15 September 2020
Revised: 14 May 2021 – Accepted: 20 May 2021 – Published: 14 June 2021

Abstract. There are only a small number of recent publica-         warming of the polar regions can be expected as polar ampli-
tions discussing glacial runoff in Antarctica, and even fewer      fication of our changing climate. Although the basin in con-
of them deal with the groundwater flow discharge. This pa-         sideration is small and results are valid only during austral
per focuses on the groundwater flow aspects and is based on        summers with surface air temperatures above the freezing
a detailed study performed on a small hydrological catch-          point, it serves as model study that can be regarded as repre-
ment, informally called Potter basin, located on King George       sentative for the western coastline of the Antarctic Peninsula
Island (KGI; Isla 25 de Mayo), South Shetland Islands, at          further south under expected future warming, with surface
the northern tip of the Antarctic Peninsula. The basin is rep-     air temperatures periodically surpassing freezing point. This
resentative for the rugged coastline of the northern Antarc-       data can be used to adjust glacial mass balance assessments
tic Peninsula and is discussed as a case study for the pos-        in the region and to improve the understanding of coastal sea
sible future evolution of similar basins further to the south.     water processes, and their effects on the marine biota, as a
A conceptual hydrogeological model has been defined using          consequence of the global climate change.
vertical electrical soundings (VESs), geological and hydro-
geological surveying methods, geomorphological interpre-
tation based on satellite imagery, permeability tests, piezo-
metric level measurements, meteorological, geocryological          1   Introduction
and glaciological data sets. The transmissivities of the fluvial
talik aquifer and suprapermafrost aquifer range from 162.0 to      A review of climatological data records over ap-
2719.9 × 10−5 m2 s−1 and in basaltic fissured aquifers from        prox. 4 decades for the northern Antarctic Peninsula (AP)
3.47 to 5.79 × 10⁻⁵ m2 s−1 . The transmissivities found in         by King et al. (2017) yields mean annual surface air tem-
the active layer of hummocky moraines amount to 75.23 ×            peratures of between −2 and −5 ◦ C. Though winter mean
10−5 m2 s−1 and to 163.0 × 10⁻⁵ m2 s−1 in the sea deposits,        values are within −6 to −10 ◦ C, summer mean values are
and in the fluvioglacial deposits, they were observed between      clearly above melting point, with 0 to +2 ◦ C. The AP is
902.8 and 2662.0 × 10−5 m2 d−1 . Finally, the groundwater          an area of high sensitivity to global warming due to its
flow discharge was assessed to 0.47 m3 s−1 (during the aus-        maritime surroundings and its exposure to the low pressure
tral summer months of January and February), and the to-           systems encircling greater Antarctica (King et al., 2003).
tal groundwater storage was estimated to 560 × 103 m3 . The        Rising temperatures affect the biosphere and the evolution
Antarctic Peninsula region has experienced drastic climato-        of abiotic systems, particularly the dynamics of glaciers
logical changes within the past five decades. Under the Inter-     (Cook et al., 2005), and the groundwater and surface phases
governmental Panel on Climate Change scenarios, a further          of the water cycle. Climate change has been characterized
                                                                   by rising temperatures of approximately 2.5 ◦ C on the

Published by Copernicus Publications on behalf of the European Geosciences Union.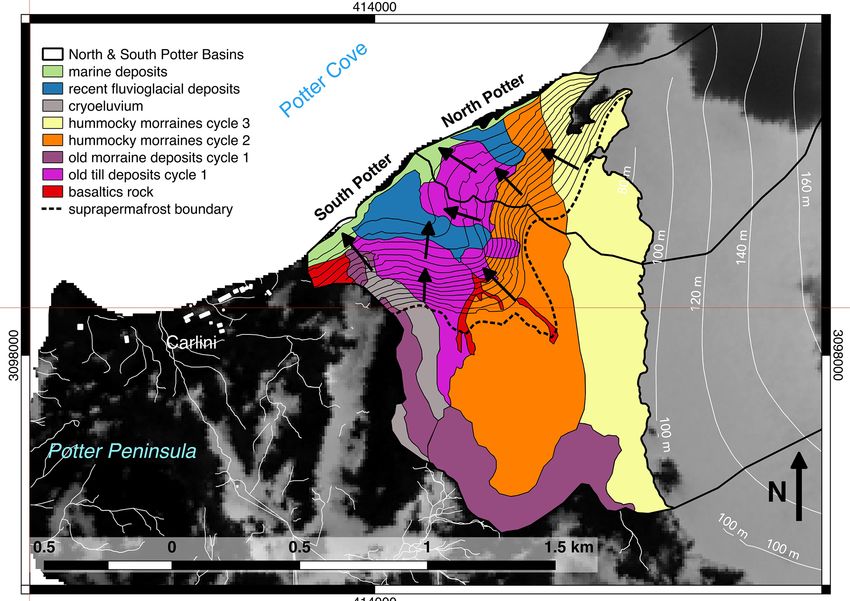
3228                               U. Falk and A. Silva-Busso: Geohydrology of King George Island in a changing climate

western AP (Ferron et al., 2004; Turner, 2004; Steig et al.,       the coastal areas of Potter Peninsula area in the middle of
2009). In particular, at the end of last century, the average      the Holocene, and that might coincide with a cooling pe-
temperature rise was the greatest in the eastern region of the     riod around Antarctica within the period between 8000 to
AP and especially in the James Ross archipelago (Skvarca           4000 years BP, and a climate optimum for the AP in the time
et al., 1998). Barrand et al. (2013) reported an increase in       period of 4000 to 3000 years BP, as suggested by ice core
mean annual air temperature of 2.3 ◦ C over 4 decades for          analysis (Del Valle et al., 2002).
the Russian Bellingshausen Station on Fildes Peninsula,               The Potter stream basin is divided in two main channels
about 10 km away from Carlini Station (formerly called             that have been informally named and will be referred to in
Jubany station). This trend has currently come to a halt, but      this paper as the North Potter (NP) and South Potter (SP)
interannual variability is reported as being high (Falk and        streams. Meltwater discharge from the Fourcade Glacier sup-
Sala, 2015a; Falk et al., 2018a). The western coast of the         plies this hydrogeological system. It is a polythermal glacier
AP is impacted directly by humid and relatively warm air           forming a part of the Warszawa Icefield (Falk et al., 2018b).
masses from the Pacific, carried by persistent strong westerly     The two Potter streams have been considered as being one
winds (Fernandoy et al., 2018).                                    basin (Potter basin) because of the similar geology of the two
   Glaciological changes have been observed along the whole        streams and to facilitate the hydrogeological analysis. Falk
length of the AP’s western and eastern coasts. Studies along       et al. (2018b) assert the importance of the present glacial re-
the AP show extensive glacial acceleration and thinning            treat and the role of the active permafrost as being the main
(De Angelis and Skvarca, 2003) and the retreat of the glacial      drivers of surface and subsurface hydrological processes in
grounding line and calving front (e.g. Rignot et al., 2011;        the Potter basin. Our aim is to increase the knowledge and
Rau et al., 2004). Over the past 5 decades, a general re-          understanding of the consequences of climatic change in the
treat and disintegration of the AP’s cryosphere has been re-       study region in, especially, the response of the permafrost to
ported by various studies (Falk et al., 2018a; Rott et al.,        a changing hydrologic regime.
1996; Skvarca et al., 1998; Scambos et al., 2000; Shepherd            During the austral summer, mean air temperatures are fre-
et al., 2003; Skvarca et al., 2004; Scambos et al., 2008;          quently above zero and snowmelt occurs. In some cases, the
Braun et al., 2009). The ongoing change in the atmosphere          water intake of the basins comes not only from glaciers but
and cryosphere are directly related to extensive changes in        also, to a great extent, from snowmelt of the ice-free land ar-
the adjacent ocean (Meredith and King, 2005). Polar marine         eas. On some occasions, the snow cover in the non-glacier
species are highly sensitive to environmental conditions and       areas completely disappears, and the flow from the active
variability in the AP region (Smith et al., 1999; Peck et al.,     layer and the thawing of the top of the ice-rich permafrost
2004; Ducklow et al., 2007; Clarke et al., 2007; Montes-           are the main sources of water that feed streams through the
Hugo et al., 2009; Schloss et al., 2012; Quartino et al., 2013;    saturated zone. One of the characteristics of aquifers in sub-
Abele et al., 2017). Glacial meltwater input to the coastal sys-   polar zones is the specific temporal and spatial pattern of
tems significantly affects coastal biotic systems. Changes in      water occurrence. During austral summer, the increase in
physical and chemical properties, such as salinity, turbidity      the depth of the active layer allows more liquid water to be
or light transmission and trace metals are directly linked to      stored in the sediment. The increase in soil temperature re-
glacial meltwater input to coastal systems (Braeckman et al.,      sults in an increase in meltwater runoff from snow, glacier
2021; Henkel et al., 2013; Sherrell et al., 2015).                 ice and permafrost towards the streams. If the soil temper-
   At present, the intertidal marine zone in the outlet of the     ature reaches higher average values than in previous years
Potter basin (lower than 3 m a.s.l. – above sea level) is com-     during the respective period, the depth to the active layer in-
posed of fine sand, silt and a gravel beach ridge with moder-      creases until it becomes hydrologically disconnected from
ate permeability. The sedimentary deposits originated mainly       the streams, and these are left with almost no water flow.
from volcanic clasts, whereas residues of sedimentary Pale-        There may also be anomalies related to lithological variations
ozoic and plutonic clasts were observed only in marine de-         giving rise to sectors with varying degrees of vertical and hor-
posits. This is an important fact in order to understand the       izontal connection (Yershov, 2004; French, 2017). Hydroge-
local importance of glacial processes in the hydrology of the      ological studies of permafrost effluent systems in Antarctic
Potter basin. The palaeotological and palaeogeographical ev-       environments Silva-Busso (2009) have demonstrated the ex-
idences indicate that penguin rookeries were already present       istence of ephemeral water systems active only during the
on the cliffs of the Potter Peninsula at the time of marine        summer period, derived from spring snowmelt and the flow
beach sedimentation (Del Valle et al., 2002). On the basis         from unconfined aquifers. A total of three main types of
of radiocarbon dating of organic material found in situ, it        aquifers can be distinguished in subpolar regions, depend-
was found that the sedimentation of beach deposits occurred        ing on their relative position with regards to the permafrost
about 4540 to 4450 years BP (before present). Taking into ac-      layer, as follows: suprapermafrost layers are those above the
count reservoir effects, this was corrected to 1400 years BP.      permafrost, which is their impermeable base, intrapermafrost
This evidence suggests periods of open seawater in which           layers develop within the frozen soil layer and the infraper-
mammals and marine birds were able to reach and inhabit            mafrost layer develops below the frozen layer, generally at

Hydrol. Earth Syst. Sci., 25, 3227–3244, 2021                                       https://doi.org/10.5194/hess-25-3227-2021
U. Falk and A. Silva-Busso: Geohydrology of King George Island in a changing climate                                                   3229

Figure 1. Map of the research area on the Potter Peninsula, King George Island (northern Antarctic Peninsula). Shown are the locations of the
installations of vertical electrical soundings, piezometers, observations of permeability, gauging stations and soil temperature measurements
and the automated weather station (AWS; Falk and Sala, 2015a). The hydrological basin boundaries of the North Potter and South Potter
streams with their drainage channels are also displayed. Background source: SPOT 4, 18 November 2010. © ESA TPM, 2010.

greater depth, where geothermal gradients maintain water in              the island surface is covered with ice. While the island has
liquid state. Hydrological basins in the study region normally           a steep terrain with a maximum height of 720 m a.s.l. (Rück-
have mixed characteristics. They contain glacial discharge               amp et al., 2011), on the Potter Peninsula area the maximum
flow, a significant variable flow from rain or snowfall and,             elevation (210 m a.s.l.) corresponds to Three Brothers Hill.
in some cases, flow due to ablation of permafrost. Generally,               The Potter basin is characterized by different geologic
one of these processes dominates the others. For example,                units referred to here as cycles, which can be separated
at the start of the austral summer, snowmelt is predominant,             into two different groups, namely volcanic rocks and qua-
whereas at the end of the summer, it is the flow contribution            ternary sedimentary rocks. The volcanic outcrops are the
from buried ice and the talik zone that becomes prevalent. In            oldest units and they constitute the glacial bedrock. These
between the start and the end of summer, all other situations            rocks are theolitic basalt, andesitic volcanic and intrusive
are possible. Fourcade (1960) gives a sketch of a geological             rocks. Pankhurst and Smellie (1983) have described five rock
map of Potter Peninsula.                                                 samples from the Potter Peninsula with an age between 42–
   This study analyses the direct relation of groundwater dis-           48 Ma. The maximum age is provided by the analysis of a
charge and hydrogeological processes to glacier ablation.                cross-cutting andesite plug at Three Brothers Hill, dated by
The aim of this paper is to establish a conceptual hydroge-              Watts (1982) to about 47 ± 1 Ma (obtained approximately
ological model for these processes based mainly on the field-            2 km away from the Potter basin). It constitutes a fissured
work conducted in the austral summer of 2011 in the area of              aquifer, and it is representative for the area. The second group
Potter Peninsula.                                                        consists of sedimentary rocks like till deposits (moraines or
                                                                         hummocky moraines), fluvioglacial deposits, lake and ma-
                                                                         rine deposits.
2   Study area                                                              Several authors have analysed the quaternary deposits in
                                                                         Potter Peninsula (e.g. John and Sugden, 1971; Birkenmajer,
Our study area is part of the Potter Peninsula (62◦ 140 1000 S,
                                                                         1998; Del Valle et al., 2002; Wiencke et al., 2008). Tatur and
58◦ 390 0100 W), a non-glaciated area of approximately
                                                                         del Valle (1986), who worked in the paleolimnological and
6.6 km2 at the south-southwesterly tip of King George Is-
                                                                         geomorphological aspects, and Birkenmajer (1998) proposed
land (KGI), the largest of the South Shetland Islands. KGI is
                                                                         that the glacial deposits in Potter Peninsula could be of dif-
located near the northwestern tip of the Antarctic Peninsula
                                                                         ferent glacial episodes along the Quaternary. Heredia Barión
(Fig. 1). It has an elongated shape, lying in an approximate
                                                                         et al. (2019) give a detailed study on the sedimentary archi-
northeasterly to southwesterly direction, and about 90 % of

https://doi.org/10.5194/hess-25-3227-2021                                              Hydrol. Earth Syst. Sci., 25, 3227–3244, 2021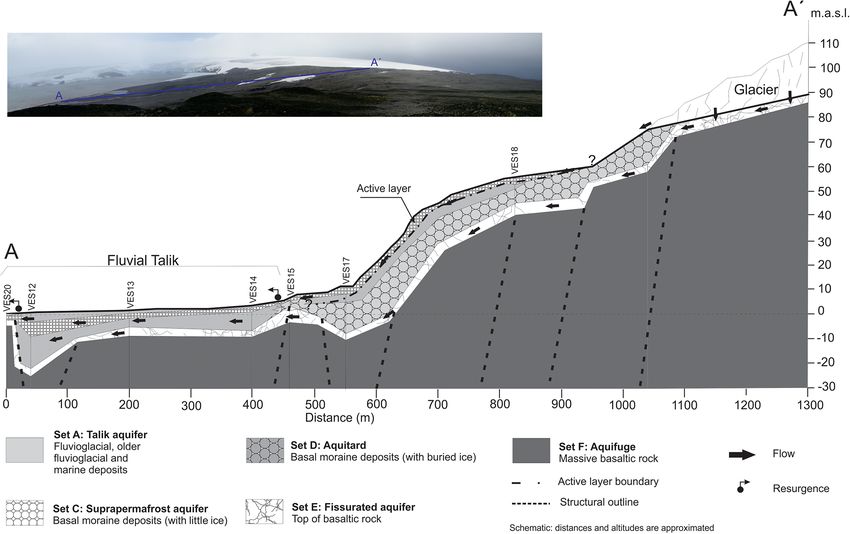
3230                               U. Falk and A. Silva-Busso: Geohydrology of King George Island in a changing climate

tecture and morphogenetic evolution of a polar bay mouth              While it is difficult to establish a precise limit, and also
gravel spit system for Potter Cove.                                taking into account that the active layer can be developed
   The till deposits have a distribution that includes gravel      without a free aquifer (French, 2017; Silva-Busso, 2009),
with abundant silt and clay in the matrix. During the sum-         these processes have rarely been observed above 45 m a.s.l.
mer, the active layer is mainly developed in these units with      The more recent hummocky moraines (cycle 2; see Fig. 2)
their moderate permeability. The fluvioglacial deposits con-       cover a large area from north to south in the middle Potter
sist of gravel and sands without silts or clays. These units are   basin at elevations between 45–60 m a.s.l. These have con-
the fluvial talik layers with good permeability through which      tinuous permafrost with little development of the active layer
meltwater flows into the Potter basin. The layers of lake de-      (to the north and at lower levels), with a higher content of ice
posits are very thin in the Potter basin and consist of silt and   up to 20 % and buried ice (Silva Busso and Yermolin, 2014).
clay; thus, they have very low permeability. With regards             Due to these considerations, it can be assumed that there
to the marine deposits, Del Valle et al. (2002) described a        is a thin active layer and no development of a supraper-
2.7 m thick mid-Holocene sedimentary succession composed           mafrost aquifer. Finally, recent deposits called here hum-
of alluvial fan and marine beach deposits on the southeast-        mocky moraines (cycle 3; Fig. 2) can be found from north
ern coast of the Potter Peninsula. Ermolin and Silva Busso         to south in the upper Potter basin, bordering the Fourcade
(2008) observe a mean annual soil temperature of −2.0 ◦ C          Glacier at about 60–80 m a.s.l. This permafrost is continuous,
which is slightly warmer than elsewhere on the AP. Lisker          with virtually no development of an active layer. The buried
(2004) proposes an average homogeneous geothermal gra-             ice abounds no interfingering of sediments and ice. The flu-
dient for the AP of 0.03 ◦ C, which is considered represen-        vioglacial plains are located between 3–15 m a.s.l. However,
tative for continental Antarctic areas. Based on this informa-     their development is almost simultaneous to the genesis of
tion, the maximum thickness of permafrost in the hummocky          hummocky moraines (cycle 1 deposits; see Fig. 2). The de-
moraines and side blackberries is estimated to between 70–         posits are the fluvioglacial product of the reworking and out-
80 m.                                                              washing of fine material contained in the moraines. This is
   The Potter basin contains areas of volcanic rocks,              the geologic unit where the open fluvial talik (French, 2017;
moraines of different events and marine and fluvioglacial de-      Silva-Busso, 2009) is developed with little or absent ice and
posits (see Fig. 2). As noted by Fourcade (1960), its features     a non-zero sediment porosity. This layer is identified as the
are mainly hummocky moraine with different ice content,            true suprapermafrost aquifer in the study area.
and the latter is determined as being of different stages of          A total of two sediment units were associated with fluvial
genesis (Silva Busso and Yermolin, 2014). Although there           rework in the North and South Potter streams. The marine
are still missing elements to propose suitable chronologi-         deposits between 0–3 m a.s.l. in the Potter basin are very re-
cal order, the oldest units are undoubtedly older basaltic–        cent, and no records of marine palaeo deposits were found by
andesitic or volcanic rock, as dated by Pankhurst and Smellie      Del Valle et al. (2002). These identified with the processes of
(1983). These are present and intensely fissured in many           tidal and wave rework (the latter of lower intensity) and orig-
places, covered by the cryoeluvium product of cryoclas-            inate from clastic supply from moraines.
tic weathering. They have also been identified in the beds            The permafrost found here is comparatively warm (mean
of the river channels in the middle of the southern Potter         annual ground temperatures are greater than −2.0 ◦ C) and
basin (Figs. 1 and 2), which underlines the regional conti-        thin (less than 80 m). Biskaborn et al. (2019) give an
nuity. Fourcade (1960) generally interprets the till deposits      overview of global permafrost temperatures and observed
as hummocky moraine and does not differentiate each im-            trends. They report permafrost temperatures for sites above
posed lithology. The moraine in the south to southwestern          the Arctic circle and the Antarctic mainland of around
part of the map (see Fig. 2) can be assumed to be the lateral      −10 ◦ C but only about −2 ◦ C for the northern Antarctic
boundary of the complete Potter basin. It is the oldest deposit    Peninsula and a trend of approx. 1 ◦ C, per decade. As-
identified here as cycle 1 and is probably the former glacier      suming a homogeneous medium, a geothermal gradient
front or side moraine. The remaining moraines noted on the         of 0.03 ◦ C m−1 is considered representative for continental
map are interpreted as hummocky moraines. These moraines           Antarctic areas (Lisker, 2004). This yields a maximum per-
have variable ice contents (including buried ice) that origi-      mafrost thickness of about 70–80 m in the bottom moraines
nate at least from three different periods of glacial advances     and terminal Holocene moraines in the study area and about
and retreats. The hummocky moraines (defined as cycle 1 in;        40–60 m in the present moraine near the border of Fourcade
Fig. 2) are called “old till”, but they include deposits gen-      glacier. In the fluvioglacial plain, gravity slopes (that are not
erated by other, more recent processes. They are part of the       solifluction slopes) and wetland the permafrost thickness is
lower basin above approx. 15 m a.s.l. and have a discontinu-       estimated to less than 40 m. Ermolin and Silva Busso (2008)
ous permafrost with an interstitial ice content of about 12 %–     found the beach zones on KGI to act as limits to the extension
14 % (Silva Busso and Yermolin, 2014). This area is where          of permafrost.
the active layer and the suprapermafrost aquifer is formed.           The depth at which temporal thawing takes place is de-
                                                                   termined by the climatic boundary conditions and different

Hydrol. Earth Syst. Sci., 25, 3227–3244, 2021                                       https://doi.org/10.5194/hess-25-3227-2021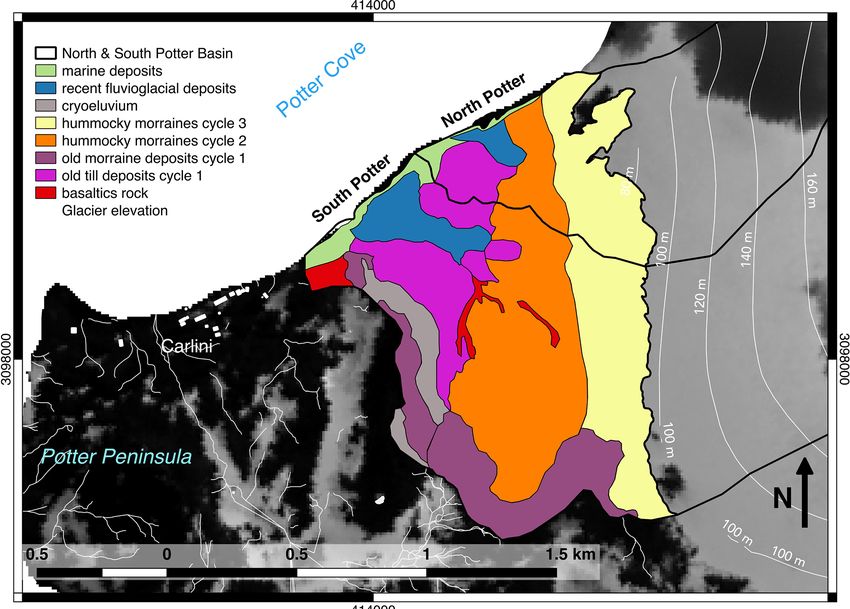
U. Falk and A. Silva-Busso: Geohydrology of King George Island in a changing climate                                                      3231

Figure 2. Map of distribution of geological deposits from different cycles (where 1 is the oldest and 3 is the most recent) in the Potter basin,
King George Island. Background source: SPOT 4, 18 November 2010. © ESA TPM, 2010.

lithology types. It is directly linked with the formation of              dynamic processes of freezing and thawing, in addition to
surface and suprapermafrost water. Ermolin and Silva Busso                the observed high wind speeds in the study area, lead to
(2008) suggest that the development of permafrost and                     formation of colluvial slopes and vertical cliffs. Ermolin
groundwater flow is determined by the periglacial geoforms                and Silva Busso (2008) identify the thawing of ice-rich per-
and cryogenic processes. The collected data show that the                 mafrost and buried ice as the agents of the prevailing pro-
thickness of the active layer ranges from 0.5 to 0.8 m in                 cesses of thermo-erosion in fluvioglacial plains and lake for-
the hummocky moraines. It reaches 1.0 to 1.5 m in the flu-                mations. In general, the fluvioglacial deposit areas present
vioglacial plain and gravity slopes. On the periphery of the              slightly lower gradients from which it is possible to infer a
fluvial talik and the coastal wetland located at ca. 2 m a.s.l.,          higher permeability. These units have gravel sediments with
the influence of surface and groundwater causes an increase               little fine sediment content. The volcanic rock outcrop ar-
in the active layer thickness to 2.5 m.                                   eas are fissured aquifers and show significantly lower gra-
   A prominent feature of the study area are the ice-free ar-             dients from which it is possible to infer a lower permeability.
eas and above-melting-point summer air temperatures, which                These areas are distributed throughout the subsurface region,
leads to exposed ground surfaces during summer months                     including Potter basin.
that are prone to austere cryogenic and exogenic processes,                   Silva-Busso (2009) found that the groundwater discharge
e.g. frost jacking and sorted stripe, typical for the different           from the flow from suprapermafrost and interpermafrost
sediment types of the study area. Frost jacking is a charac-              aquifers to be the main drivers of the hydrodynamic balance
teristic for slope deposits and wetlands, and it prevails in the          in the Potter catchment. They also found that streams and la-
study area’s bottom contemporary moraines and Holocene                    goons in a close-by, small hydrological basin (Matías basin)
moraines that contain the suprapermafrost aquifer. The char-              are supplied by the suprapermafrost aquifers.
acteristic feature in the fluvioglacial plains, wetlands and
fine-textured bottom moraines is the sorted stripe that is visi-
ble as nets with a pattern size of about 0.5 to 1.0 m. Short-             3    Data and methods
term diurnal turnover in soil temperature around freezing
point temperature in the wetlands and fine clastic soils found            Several analytic methodologies have been applied, including
mostly in lake depressions result in a smaller-sized pattern.             in situ observations and satellite remote sensing data, in order
Slope deposits and lateral moraines that contain ice-rich per-            to establish a comprehensive overview on groundwater dis-
mafrost and buried ice stem primarily from local bedrock                  charge, hydrological processes and their relation to glacier
subjected to landslides. The intense weathering and highly                ablation. A QuickBird image was used to correct the geo-
                                                                          logic and geomorphologic interpretation of the Potter basin

https://doi.org/10.5194/hess-25-3227-2021                                                Hydrol. Earth Syst. Sci., 25, 3227–3244, 2021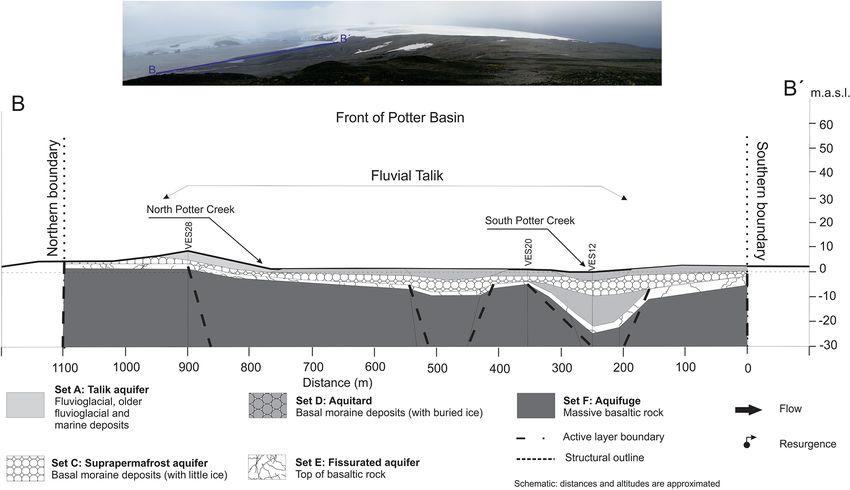
3232                               U. Falk and A. Silva-Busso: Geohydrology of King George Island in a changing climate

from field data. Figure 1 shows the basin boundaries and di-
vides, as well as watercourses, derived from a topographic
map of the area (Lusky et al., 2001) and complemented by
aerial images and our own in situ GPS data. The instrumenta-
tion used for this study included a resistivity metre, Fluke 80
(Fluke Corporation, the Netherlands), to measure the electri-
cal current and potential difference to calculate electrical re-
sistivity, which allows for a quantification of the water and/or
ice content distribution in the respective layer. Conductiv-
ity and pH values were obtained with a conductivity metre
WTW 315 and a pH metre WTW 320 (Xylem Inc., New
York, USA). The water depth was measured with a piezomet-
ric sonde. Optical levelling was conducted with a FOIF 57          Figure 3. Shown is the Darcy permeability test, on the basis of
                                                                   Eq. (1), for measurements in the fluvioglacial deposits on Potter
(Suzhou FOIF Co., Ltd., Suzhou, China), and distances were
                                                                   Peninsula, King George Island.
measured with a telemeter Nikon Forestry Pro 550 AS laser
(Nikon Imaging Japan Inc., Tokyo, Japan). All observational
and measurement sites are mapped in Fig. 1.                        groups, namely coastal wells that are drilled on terrain lower
   The geologic units were mapped and the hydrogeol-               than 3 m a.s.l. and wells on higher inland terrain. Soil sam-
ogy aspects were analysed using vertical electrical sound-         ples were taken and analysed from 10 wells. The first group
ings (VESs) as local geologic and hydrogeologic survey             shows thick dark grey sands lithologically composed of frag-
methods. The VESs were conducted using a digital resis-            ments of volcanic rock in the layer above 1.25 m and fine
tivity metre with a manual telluric compensation. The sen-         gravel, dark grey sands and basaltic lithic composition be-
sitivity of the device is 0.01 mV and 0.1 mA, using a con-         low 1.25 m. The second group shows fine gravel, dark grey
tinuous power supply of 160 V and 1000 mA. A Schlum-               sands and basaltic lithic composition between 0 and 1.75 m.
berger geoelectric line device with an electrode spacing of        The lithology of both groups is very uniform and is almost
AB/2 = 44 m was used, with AB being the maximum elec-              entirely basaltic volcanic in its composition. Observations of
trode spacing (in all VESs), to investigate the local quater-      specific permeability by slug tests were conducted at the lo-
nary deposits. The electric resistivity is an indirect measure     cations shown in Fig. 1 (see permeability test points), identi-
of changes in water, ice and rock. The results were corre-         fying layers with low and high permeability (i.e. fluvioglacial
lated with the ground cuts in the stream crankcases and wells      deposits) according to the following:
that were drilled for the recognition of the suprapermafrost
aquifer. The subsurface geology can be assessed by geoelec-        K = V · φ · ∇i ,                                             (1)
trical studies. The geoelectric techniques used are indirect
methods to identify changes in ice content, water salinity         where K is the permeability, V the Darcy velocity, φ the spe-
or lithological change and have been previously applied and        cific yield and ∇i the hydraulic gradient.
validated for subsurface studies in Antarctica (Muñoz Martín          The fluvial talik is the layer showing the highest per-
et al., 2000; Silva Busso et al., 2013). A total of 18 VESs        meability. Since the water in the active layer is fresh wa-
were performed in the Potter basin (called VES12–VES29;            ter (ca. 400 µS cm−1 ), another test to quantify the perme-
see Fig. 1) and interpreted. From these profiles, five resistive   ability was conducted with tracer NaCl (Custodio and Lla-
horizons and eight resistive layers were identified. Tables 1      mas, 1983; Hall, 1996). The point permeability test yielded a
and 2 summarize the characteristics of the found resistive         porosity value of 14 %–20 %. Results are shown in Fig. 3. To-
layers, i.e. layer thickness and resistivity, and the geological   tal and specific porosity were obtained following the method
interpretation. This method provides the layers’ thicknesses       proposed by Schoeller (1962) and Custodio and Llamas
and depth and the distribution of underground ice or water         (1983). The field samples of the classic deposits were anal-
content. It is the basis for the estimation of the hydrogeolog-    ysed in the laboratory using a granulometric technique. Re-
ical cross sections of the outlet and the mid-basin. The loca-     sults are listed in Table 3. The samples of the cryoeluvium
tion of the VES surveys, permeability tests and static level       gave dispersed results above 0.4. The value of specific yield
groundwater measurements points in Potter basin are shown          or porosity for fissured basalt was estimated from the differ-
in Fig. 1. From the interpretation of these data (see Table 1),    ence in weight between the dry and water-saturated sample.
a hydrogeological model was derived (see Sect. 2).                    In less permeable layers (like moraine deposits and
   A total of 13 wells were drilled with a hand drilling sys-      basaltic rocks), the slug test was performed, following the
tem for the deep groundwater level measurements and the            Lefranc method, with variable levels as follows (Hall, 1996):
slug test, which measures the permeability by the salinity
method (Custodio and Llamas, 1983). The wells were be-                  d 2 ln(2L/d) h1
tween 1.25 and 2 m deep and can be divided into two major          K=               ln ,                                        (2)
                                                                              8Lt     h2

Hydrol. Earth Syst. Sci., 25, 3227–3244, 2021                                         https://doi.org/10.5194/hess-25-3227-2021
U. Falk and A. Silva-Busso: Geohydrology of King George Island in a changing climate 3233
Table 1. An analysis of the geoelectrical observations, the relation between resistive layers and the geological interpretation of VES mea-
surements (January to March 2011) in the Potter basin, King George Island, Antarctic Peninsula.
Layer Thickness/ Resistivity/ Proposed correlation
m (W m)
I 1.18 76.8 Coastal deposits and gravel beach ridge
II 1.27 901.0 Cryoeluvium
III 1.74 943.8 Actual fluvioglacial deposits
IV 2.0 1308.9 Hummocky moraines deposits (little or discontinuous ice)
V 5.21 1316.7 Old till deposits (hummocky moraines; fluvioglacial)
VI 4.28 5180.8 Hummocky moraine deposits (with buried ice)
VII 2.89 8005.4 Basaltic rock (fissured and weather alteration)
VIII – 26761.6 Basaltic rock (few fissures)
Table 2. Hydrostratigraphic interpretation of observations in the Potter basin, King George Island, Antarctic Peninsula.
Group Layer Hydrostratigraphy Permeability
A II + V Talik and cryopeg (fluvioglacial deposits) 5.231
A I Talik and cryopeg (marine deposits) 1.389
B III Unsaturated active layer (only snow infiltration) No data
C IV Suprapermafrost aquifer (glacial water supply) 0.371
D VI Aquitard (moraine rich with buried ice) No data
E VII Fissured aquifer (top basalt) 0.0131
F VIII Aquifuge (massive basalt) No data
Table 3. Specific yield or porosity analysis for geologic units in the posits, but a salt permeability test was used instead (Custo-
Potter basin, King George Island, Antarctic Peninsula. dio and Llamas, 1983). The groundwater hydraulic gradient
was calculated on the basis of the piezometric map of the
Geologic units Specific yield suprapermafrost aquifers, which contains different hydroge-
dimensionless
ological units. The simplest way to calculate the hydraulic
Coastal deposits and gravel beach 0.31 difference between two elevation isolines is to calculate the
Cryoeluvium > 0.4 linear perpendicular distance separating them. The meteoro-
Actual fluvioglacial deposits 0.12
logical, permafrost and glaciological data sets were used for
Hummocky moraines deposits 0.06
Old till deposits (hummocky moraines; fluvioglacial) 0.12 a complementary analysis of the hydrogeological model pre-
Basaltic rock (fissured and weather alteration) 0.01 sented in here.
The calculation of the groundwater discharge requires the
use of the Darcy’s law, assuming that summer groundwater
discharge has completely saturated the sediments and that the
with h1 and h2 as the water levels at the start and the end of runoff from the (adjacent) Fourcade Glacier is high. These
the test, respectively. t is the time passed for the water level assumptions were valid during 1 to 1.5 months in the austral
going from h1 to h2 . L is the longitude, and d is the diameter summer (here January and February), while daytime air tem-
of the drill. peratures are above melting point for the majority of the days
It should be noted that the application of these units and per month.
the non-uniformity and poor accessibility of terrain makes it For a proper assessment of underground discharge flow
very challenging to construct the wells or conduct a test by and local hydrodynamics, it is essential to define the hy-
traditional pumping. drogeological units, which depend on the geological de-
The data enabled us to derive a suprapermafrost piezo- posits present in the basin. To achieve this goal, a geologi-
metric map of the talik and hydrological active layer area. cal interpretation was performed on a QuickBird satellite im-
From the slug test data, the permeability was estimated in age (2006), in combination with geological field data taken
the different geologic unit outcrops. This method has been over multiple campaigns (in austral summers of 2003–2004,
demonstrated to be effective in volcanic rocks and moraine 2007–2008 and 2010–2011). However, it is important to de-
deposits, and it is recommended for use on low-permeability fine the boundaries of volcanic and clastic geological units in
aquifers. Due to the high permeability found at this research the Potter basin. To accomplish this, photo-feature limits of
site, this method was not applicable for the fluvioglacial de-
https://doi.org/10.5194/hess-25-3227-2021 Hydrol. Earth Syst. Sci., 25, 3227–3244, 20213234 U. Falk and A. Silva-Busso: Geohydrology of King George Island in a changing climate
the different units were identified corresponding to the satel- taining the summer suprapermafrost aquifer outside the talik
lite image (Satellite Image Projection; Universal Transverse and the coastal zone. The observed resistivity is significantly
Mercator – zone 21 south; pixel resolution – 0.6 m; date – higher than for group A (up to 3689 Wm in VES 28) indi-
16 February 2006). cating areas with low ice content and distinguishing it from
other areas. Group D is represented by layer VI, attributed
to deposits with hummocky moraines with buried ice, where
4 Results an active layer develops discontinuously or not at all; thus, it
is assumed to be a layer of low permeability. Group E con-
The Potter basin consists of two main channels, namely the tains layer VII, which consists of weathered basalt, where
North Potter and South Potter streams. It is a hydrological an aquifer with low ice content forms. This originates in the
system that is mainly driven by the discharge from polyther- polythermal bedrock glacier (Fourcade Glacier) which re-
mal glaciers that form a part of the Warszawa Icefield. In both ceives the subglacial water from the whole catchment area.
sub-basins, the appropriate places for discharge measure- The increased resistivity of igneous rock is evident in this
ments were chosen (see Fig. 1). The contemporary glacial re- layer. Finally, unaltered basalt is found in layer VIII, with
treat and active permafrost processes are found to be the main the highest resistivity signal defining the regional aquifuge
drivers of runoff and groundwater processes in the study area, (group F).
as discussed in the following sections. Another important parameter to be measured is the perme-
ability of each group with aquifer characteristics (talik and
4.1 Hydrogeologic units fissured suprapermafrost aquifer). In situ observations of spe-
cific permeability by slug tests and NaCl tracers were used
The shoreline is formed by a gravel coastal cordon that con- to identify layers with low and high permeability. The flu-
trols an inland lagoon with deposits of fine sand and silt vial talik is the layer showing the highest permeability. This
(Heredia Barión et al., 2019). This is a transition zone be- is considered to be representative for all layers in group A.
tween the talik and the cryopeg (Silva-Busso, 2009), al- Group A contains layers of psammitic marine deposits whose
though the latter is likely to be replaced by a wedge of permeability is less than that of the fluvioglacial deposits
fresh water coming from the streams due to the magnitude (gravels).
of groundwater flow discharge. Figure 3 presents the results of the permeability tests. Ta-
Resistive variations are found to be mainly due to litho- ble 2 summarizes the interpretation of these results as the
logical changes or changes in ice content. These two fac- local hydrostratigraphic groups and their corresponding per-
tors determine the probability of the development of an ac- meabilities. In the groups without aquifer development, no
tive layer or a suprapermafrost aquifer. Moreover, cross sec- action was performed. Based on the observed geological pro-
tions of subsoil can be derived from these data and ground- files in the ravine channel and in geological surface surveys,
water discharge sections quantified. This method allows us geoelectrical data and permeability tests, according to the hy-
to detect a layer of non-outcropping sediments in the area of drostratigraphy scheme of the area in the Potter basin, are
the lower Potter basin (layer V). These sediments are thicker proposed. The ice concentration in soil samples and the in
than the other geologic units, e.g. VES 12 profiles show a situ identification of permafrost observed in the cross sec-
layer thickness of non-outcropping sediments of 13 m at a tions and wells allow us to infer the characteristics of the
base depth of 22 m. These resistive layers can be interpreted permafrost. Based on the information at the surface and sub-
as old till deposits of more ancient hummocky moraines or surface, geological cross sections for the two Potter basins
previous fluvioglacial events. were performed.
Permeable deposits are interpreted here as fluvial talik that Figure 4 shows the longitudinal cross section through the
correspond to layers I, III and V and are summarized here whole basin, with its axis from the coast to the glacier front
as group A (see Table 2). Layers III and V showed sim- (cross section AA0 , as defined in Fig. 4). Figure 5 displays
ilar resistivity and can be assumed to be lithologically the the cross section downstream through the permeable deposits
same. Layer I has a lower resistivity because it contains ma- on the coast (section BB 0 , as defined in Fig. 4). These cross
rine deposits or salt water due to its close vicinity to Potter sections give an idea of the relationship between the hydros-
cove; however, it is a thawed and permeable zone. Layer II tratigraphic sets, but Fig. 5 is particularly important since it
(cryoeluvium) contains deposits and is located on the south- defines the aquifer section of each layer in the discharge area
western slope of the old moraine. Although water can move at the coast. Considering the average thickness and perme-
by snow infiltration, it is not in contact with the Fourcade ability, the transmissivity (T ) of each layer can be calculated
Glacier, which is outside of this group despite their similar (Silva-Busso, 2009). For the talik area, only the areas of flu-
resistivity. Group B is defined only as the cryoeluvium. An- vioglacial and marine deposits are considered, assuming that
other group (group C) is defined by the hummocky moraines suprapermafrost sections in the moraines and fissured basalts
or discontinuous deposits with low ice content for layer IV. occur along the entire waterfront. The results are presented
From the layers of this group, the active layer evolves, con- in Table 4, and the obtained values are within the typical
Hydrol. Earth Syst. Sci., 25, 3227–3244, 2021 https://doi.org/10.5194/hess-25-3227-2021U. Falk and A. Silva-Busso: Geohydrology of King George Island in a changing climate 3235
ranges for such types of lithologies (e.g. Custodio and Lla- of the talik to 5.2 m. It is important to validate these values by
mas, 1983). other methods, since these are crucial values that determine
the saturated thickness of groundwater flowing to the cove.
4.2 Suprapermafrost aquifer One possibility is to use the standard depth of seasonal thaw-
ing (Hd ), using the following empirical functions proposed
In the lower and medium Potter basin, 11 manual drillings by Khrustalev (2005):
of boreholes (see Fig. 1) were made with the purpose of ver- q
ifying the continuity of the suprapermafrost aquifer. Water Hd = (2λd τ1 t1 /q)2 − ksoil /2q (3)
depth was measured to produce a piezometric map that al- p
lows for the calculation of hydraulic gradients. In the up- ksoil = (0.25 − τ1 /3600) · (t1 − tc ) · λc Cc τ1 (4)
per Potter basin, manual drilling proved to be impossible q = ρ · (wt − wn ) · γd + (τ1 /7500 − 0.1) · (cd t1 − cc t0 ) (5)
due to the existence of continuous permafrost with a strong t1 = 1.4tp + 2.4 (6)
ice layer and poor development of the active layer. These τ1 = 1.15τp + 360, (7)
findings suggest that there is no development of a suprap-
ermafrost aquifer. Considering the geological field observa- where Hd is the normative depth of seasonal thawing in me-
tions and analysis of satellite imagery, there are strong indi- tres, ksoil is a parameter depending on the climate and soil
cations that, above 45 m a.s.l., the possibility of a develop- thermal properties in kilocalories per hour and per square
ment of suprapermafrost aquifer is negligible. Therefore, the metre, λc is the thermal conductivity coefficient of per-
only detailed piezometric map covers the area of elevation mafrost in kilocalories per metre and per degree Celsius
between 0–45 m a.s.l. (shown in Fig. 6). The groundwater and λd is the thermal conductivity of soil thawed coeffi-
flow network shown here is well integrated in the northwest- cient in kilocalories per metre and per degree Celsius. t0 is
erly direction, following the topographic gradient and dis- the mean temperature of permafrost in degrees Celsius, tp
charging into Potter Cove. This piezometric surface is well is the positive mean air temperature in degrees Celsius, tc
integrated in groups A and C (fluvioglacial, marine and hum- is the frozen temperature in degrees Celsius, τp is the dura-
mocky moraine deposits summarized in cycle I; Fig. 2 and tion of the period with positive air temperatures in hours, wt
Table 1). Group E contains the layers of fissured aquifer is the weight of wet soil in tonnes, and wn is the weight of
basaltic rock where no observation wells were drilled (only dry soil in tonnes. ρ is the latent heat of the fusion of ice
two for the slug test), making it impossible to identify its in kilocalories per tonne, cc is the heat capacity per volume
extent or its piezometry. There is, however, sufficient hydro- of frozen soil in kilocalories per cubic metre and per degree
geological field evidence of its occurrence, extent and capac- Celsius. cd is the heat capacity per volume of soil thawed
ity to store and supply water. Fissured basalt extends into in kilocalories per cubic metre and per degree Celsius, τ1
the subsurface throughout the catchment area and directly is a coefficient normative temperature, and t1 is the norma-
receives subglacial water discharge. According to Rückamp tive temperature in degrees Celsius. This value is defined as
et al. (2011), ice thickness is approximately 80 m in the area the greatest depth observed where the active layer of sea-
of the Warszawa Icefield. The topography gradient of the sonal thawing stage coincides with the top of the permafrost
bedrock between ice-free areas and rock outcrops was deter- over the past 10 years. The empirical functions by Khrustalev
mined by geoelectrical observation to range within 5×10⁻² – (2005) were calculated in its original units (Table 5), but all
8 × 10⁻² m m−1 . The obtained value was used as a first ap- other results were translated to SI units.
proximation to the subglacial topographic gradient of the The normative thawing depth Hd was calculated from
glacial bedrock topography. There is a high similarity be- the 42-year-long meteorological time series at the Russian
tween measured values of piezometric and topographic gra- Bellingshausen base (Martianov and Rakusa-Suszczewski,
dients in the Potter basin and in the adjacent Matías basin 1989; AARI, 2016). From this data time series, tp and τp
on Potter Peninsula (Silva-Busso, 2009). Here, topographi- were obtained. In the period between March and Novem-
cal gradients instead of the hydraulic gradients are used as ber, which is the austral winter time, the amount of positive
input. degree days (PDDs) per month does not always reach 2 %.
The application of the method, after Khrustalev (2005), re-
4.3 Relation between groundwater and permafrost quires a percentage of PDDs per month that are higher than
that value. Falk and Sala (2015a) give an analysis of PDDs
In the Potter basin, the permafrost is continuous in the upper and melt days in their Fig. 4, showing that occurrence of
basin and discontinuous in the middle basin and in the flu- melt periods during winter months is not unusual. The PDD
vioglacial deposit areas, while the cryopeg is found in coastal condition is met during summertime but not always in the
areas. Basal moraine deposits and fluvioglacial deposits are winter months. The values for the physical properties of per-
superimposed on volcanic rocks and marine deposits along mafrost and soils (λc , λd , t0 , tc , ρ, Cc , Cd , γc and γd ) for the
the coast. On the basis of the VES observations, the thick- study sites were taken from field observations and Khrustalev
ness of the active layer is calculated to 1.74 m and the depth (2005). The weights of wet and dry soil (wt and wn ) were de-
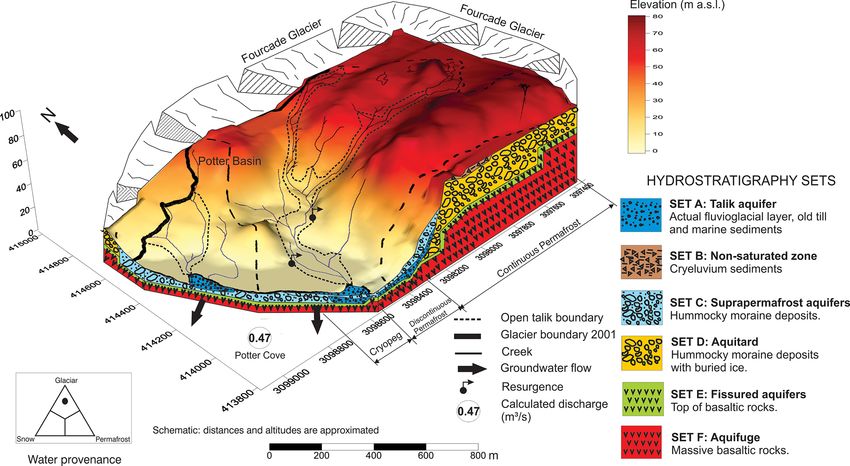
https://doi.org/10.5194/hess-25-3227-2021 Hydrol. Earth Syst. Sci., 25, 3227–3244, 20213236 U. Falk and A. Silva-Busso: Geohydrology of King George Island in a changing climate Figure 4. Transversal section scheme of the hydrostratigraphy in Potter basin, King George Island. The photo of Potter Cove in the graph was taken from the Three Brothers Hill next to Carlini Station. Figure 5. Longitudinal section scheme of the hydrostratigraphy in Potter basin, King George Island. The photo of Potter Cove in the graph was taken from the Three Brothers Hill next to Carlini Station. Hydrol. Earth Syst. Sci., 25, 3227–3244, 2021 https://doi.org/10.5194/hess-25-3227-2021
U. Falk and A. Silva-Busso: Geohydrology of King George Island in a changing climate                                            3237

Figure 6. Hydrogeological map of suprapermafrost area and fluxes in the Potter basin, King George Island. Background source: SPOT 4,
18 November 2010. © ESA TPM, 2010.

Table 4. Hydraulic parameters and gradients calculated for the talik and suprapermafrost aquifers in the Potter basin, King George Is-
land, Antarctic Peninsula.

               Group     Lithological type      Aquifer      Thickness/    Permeability/   Transmissivity/   Hydraulic
                                                surface              m         (m s−1 )    (10−3 m2 s−1 )    gradient/
                                                  area/                                                      (m m−1 )
                                                  (m2 )
                 A       Actual fluvioglacial    544.18          5.231             1.74             9.097     0.066
                 A       Old till sediments      533.46          5.231              5.2            27.199     0.079
                 A       Marine sediments        280.15          1.389             1.18             1.620     0.029
                 C       Moraine                1411.73          0.372                2             0.752     0.093
                 E       Fissured                995.35   1.308 × 10⁻²                3             0.046     0.079

termined specifically for the sample wells for the piezometers       4.4    Hydrogeologic conceptual model and discharge
(see Fig. 1). The results are listed in Table 5. In summary,                estimation of groundwater flow
the maximum summer normative thawing depths, calculated
according to Khrustalev (2005), amount to values between
3.21 and 4.29 m. Analysis of the geoelectric measurements            In this section, a hydrogeological model is proposed for
leads to an estimate of the thawing depth of about 1.74 to           the groundwater flow discharge from the Potter basin into
5.2 m for austral summer months. The two methods show                the cove. The groundwater in the talik zone nearly com-
comparable results, meaning that the estimated thickness and         pletely saturates the coarse sediments over which channels
the aquifer cross section are plausible. It also shows that, al-     are formed. The groundwater static levels in the talik have a
though the PDD conditions in the Khrustalev method are not           depth between 0.25 and 0.65 m. Thus, the runoff is carried in
completely met, the application of this method yields realis-        channels on an almost completely saturated talik zone. The
tic results.                                                         Potter streams can be regarded as a direct product of glacial
                                                                     discharge with very little supply from the talik into the chan-
                                                                     nel. In addition, rainfall increases the volume of water flow-
                                                                     ing through these channels significantly. These conditions are
                                                                     met during the period of more or less 2 months in the austral
                                                                     summer and autumn, with varying duration (Falk and Sala,

https://doi.org/10.5194/hess-25-3227-2021                                          Hydrol. Earth Syst. Sci., 25, 3227–3244, 2021
3238 U. Falk and A. Silva-Busso: Geohydrology of King George Island in a changing climate
Table 5. Characteristics of the active layer and maximum summer normative thawing depth for the Potter basin, King George Island, Antarctic
Peninsula, according to the empirical relationship for normative parameters of seasonal defrosting by Khrustalev (2005) in Eqs. (3) to (7).
Month tp / t1 / τ1 / q ksoil / Hd /
(◦ C) (◦ C) h (kcal ◦ C m−2 h−1 ) m
December 1.54 4.556 1037.4 870.905 −158.556 4.29
January 1.59 4.626 966.05 844.455 −74.687 4.24
February 0.61 3.254 843.0 787.337 42.730 3.44
March 0.88 3.632 594.60 710.169 213.945 3.21
2015a). The hydrogeological observations in this paper re- calculation of the area of each aquifer section. With this in-
fer to the period between 27 January to 5 March 2011. The formation, the monthly discharge can simply be estimated
groundwater flow circulates in the suprapermafrost aquifer, with Darcy’s law as follows:
aquifer talik and fissured basaltic rock. It is assumed to be a
free aquifer for its hydrogeological and geocryological char- Q = K · S · ∇i , (10)
acteristics. A pumping test in the adjacent Matías basin, car-
ried out by Silva-Busso (2009), proves this basin to be a free where Q is the flow through the permeable porous section
aquifer, as is inferred for the Potter basin. First, both aquifers in cubic metres per second, S is the saturated area in square
are considered free or unconfined, and the specific porosity metres, and ∇i the hydraulic gradient of the aquifer section
or specific yield (φe ) can be calculated by the specific reten- in m m−1 (metres vertical per metre horizontal). It is also
tion (mr ) according to Custodio and Llamas (1983) as fol- possible to calculate the Darcy velocity (Vd ), which can be
lows: estimated by an approximation of groundwater flow velocity
by the following:
mr = 0.03(% sand) + 0.35(% silt) + 1.65(% clay), (8)
Vd = K · ∇i . (11)
and subtracting it from the total porosity (φt ) leads to the
following: Applying Eqs. (10) and (11) for each aquifer results in the av-
erage monthly flow in cubic metres per second and is listed
φe = φt − mr . (9) in Table 6. Based on the analysis for the study period, the set
of aquifers (groups A, C and E) have a monthly average dis-
This was done by a particle size analysis of samples obtained charge of Q = 0.47 m3 s−1 into Potter Cove during the aus-
from the wells (permeability test sites; see Fig. 1). The to- tral summer months 2011.
tal porosity amounts to φt = 0.17 m3 m−3 for group A and It is noteworthy to analyse the Darcy velocity, as it rep-
φt = 0.14 m3 m−3 for group C, respectively. The calculated resents approximate transit times. The total time it takes for
effective porosity is then calculated as φe = 0.12 m3 m−3 for a water parcel to traverse the whole groundwater reservoir
group A and φe = 0.06 m3 m−3 for group C. As for fissured along the direction of the discharge was measured for each
aquifer (group E) in the lower basin, this may have some hydrostratigraphic set. In the case of group A aquifers, the
degree of confinement since low-pressure hydraulic exsur- transit time was calculated to up to 14 d, meaning a high ve-
gence (due to the topography) occurs. Thus, free aquifers locity of the water flow. For group C aquifers, the calculated
exist in the fluvial talik of the Potter basin (group A) that velocities are significantly lower, with estimated transit times
have moderate to high transmissivity (140 to 2350 m2 d−1 ) of the order of months to a maximum of 4 months. For a short
in an aquifer depth of 5.2 m. The specific yield (φe ) amounts summer, the observed transit times might not be sufficient for
to φe = 0.12 m3 m−3 and is limited to the cryopeg and the the water flow to cross the aquifer, resulting in transit times of
talik area. The unconfined suprapermafrost aquifer (group C) over a year. Finally, the aquifers of group E show the lowest
has moderate to low transmissivity (65 m2 d−1 ), low aquifer velocities and a determined annual flow rate that can be on
depth (1.74 m) and a specific yield of φe = 0.06 m3 m−3 . the scale of decades. In this group, it is important to consider
Group C has a limited extension to the middle and lower its location at the top of the bedrock of Fourcade Glacier.
basin. The fissured aquifer (group E) is the largest layer that According to Paterson (1994), polythermal glacier water
covers the entire catchment area. It has, however, a very small circulation at the base occurs throughout the year. This means
depth of 3 m, and a low transmissivity of 4 m2 d−1 . The hy- that, for the fissured basaltic rock aquifer of group E, it is
draulic type is not exactly known. All aquifers form a well- the only one with the possibility to recharge and discharge
integrated piezometric surface with a flow discharge into Pot- throughout the year. Otherwise, if it is only active during
ter Cove, with hydraulic gradients in the range of 0.029– summer, the transit of water through this layer would have
0.093 m m−1 . The transversal section of Fig. 4 allows for the significantly longer resident times.
Hydrol. Earth Syst. Sci., 25, 3227–3244, 2021 https://doi.org/10.5194/hess-25-3227-2021U. Falk and A. Silva-Busso: Geohydrology of King George Island in a changing climate 3239
Table 6. Calculated aquifer discharge from Potter basin to Potter Cove, King George Island, Antarctic Peninsula.
Group Lithology Permeability/ Aquifer ∇i / Vd / Q/
(10−3 m s−1 ) section/ (m m−1 ) (10−6 m s−1 ) (10−3 m3 s−1 )
(m2 )
A Actual fluvioglacial deposit 5.231 544.18 0.066 345.25 187.89
A Old till deposit 5.231 533.46 0.079 413.19 220.47
A Marine sediment 1.389 280.15 0.029 40.28 11.28
C Moraine 0.372 1411.73 0.093 32.64 48.78
E Fissured aquifer 0.013 995.35 0.079 1.03 1.04
In summary, it is possible to differentiate between three maximum flow values. Rt,min and Rt,max are the maximum
main flow regimes of distinct discharge timescales (daily, and minimum plausible total groundwater storage terms, re-
monthly and decadal). Finally, the total groundwater stor- spectively.
age (Rt ) is determined by the total water capacity that drains The most sensitive parameters have been highlighted in
the aquifer gravitationally (Custodio and Llamas, 1983). The Tables 6 and 7. In the assessment of groundwater flow
storage capacities can be calculated for each group by the discharge, three sensitive parameters have been detected.
following: The first is the hydraulic gradient of group A, particularly
in the fluvioglacial deposits where variations between 1–
Rt = A · bsat · φe , (12) 5 × 10⁻² m m−1 are sufficient to overcome the condition in
Eq. (13). However, since these layers exist in a well-defined
where A is the extension area, bsat is the saturated thickness, integrated piezometry with a defined hydraulic gradient, the
and φe is the effective yield. variability in hydraulic gradients is limited, and it is there-
This allows for an estimation of the respective storage fore considered a robust parameter. The quantified discharge
terms derived from the effective porosity. The results are of group A is also sensitive to the permeability. Values for
listed in Table 7. The sum is the total groundwater storage the permeability vary on a daily basis between 2.31 and
and amounts to 560 × 103 m3 . 11.57 × 10⁻³ m s−1 in the old till deposit layers. This is a
complex issue as this layer is only detectable in deep VESs
4.5 Sensitivity analysis of groundwater discharge and
that have not been applied in the field. Therefore, the mea-
storage terms
sured values in the actual fluvioglacial deposits cannot be
The characteristics of the applied methods and results sug- considered a robust parameter. The permeability could be
gest the application of a sensitivity analysis of the parameters higher, resulting in a possible underestimation of groundwa-
used to estimate groundwater discharge (Q) and total stor- ter storage terms.
age terms (Rt ). The task is to assess the importance of flow The third parameter is the aquifer cross section of the old
in basaltic rock compared to the other flows, and to check till deposits. Variations that double or half the size of the
the sensitivity of the achieved results depending on the input aquifer cross section fulfil the condition in Eq. (13) for the
variability. A ceteris paribus approach analyses the impact same reasons mentioned above. It is, however, assumed to be
of one parameter on a reference outcome, while holding all a robust parameter since the VES data are the basis on which
other parameters constant. However, in this case it is very the layer geometry was determined, and the calculation of
difficult to obtain alternative values for comparison. For this the depth of seasonal normative thawing were well defined
reason, it was decided to establish a reference condition, al- for the considered areas and layer depths. The calculation
though no longer arbitrary, that allows us to study the possi- of total groundwater storage has proven to be sensitive to
ble dispersion of the results. The sensitivity ratio (Ss ) is given the parameterization of specific porosity within group E (fis-
by the following: sured aquifers). The problem is related to the type of poros-
ity (fissures) and the difficulty in assessing the layer depth.
Ss = (Qmax − Qmin ) /Q > 0.5, (13) Assuming a higher confinement or higher values of specific
porosity as condition in Eq. (13) is rapidly reached. It is dif-
and the following: ficult to estimate an appropriate value for this parameter. The
permeability measured in areas of outcrops give us a simi-
Ss = Rt,max − Rt,min /Rt > 0.5, (14) lar magnitude, but several authors have mentioned a nonlin-
ear relationship between permeability and porosity (Kozeny,
where Qmax and Qmin are the maximum and minimum plau- 1927; Carman, 1938). A value of φe = 0.01 m3 m−3 has been
sible discharges and are taken from as the minimum and applied according to the empirical relationship proposed by
maximum hydraulic gradient to calculate the minimum and
https://doi.org/10.5194/hess-25-3227-2021 Hydrol. Earth Syst. Sci., 25, 3227–3244, 2021You can also read