Bank Technology and the COVID-19 Pandemic - FDIC
←
→
Page content transcription
If your browser does not render page correctly, please read the page content below
WORKING PAPER SERIES

       Bank Technology and the COVID-19 Pandemic

                                               Mark J. Kutzbach
                                      Federal Deposit Insurance Corporation

                                                Jonathan Pogach
                                      Federal Deposit Insurance Corporation

                                                    February 2022

                                              FDIC CFR WP 2022-02

                                                      fdic.gov/cfr

The Center for Financial Research (CFR) Working Paper Series allows CFR staff and their coauthors to circulate
preliminary research findings to stimulate discussion and critical comment. Views and opinions expressed in CFR Working
Papers reflect those of the authors and do not necessarily reflect those of the FDIC or the United States. Comments and
suggestions are welcome and should be directed to the authors. References should cite this research as a “FDIC CFR
Working Paper” and should note that findings and conclusions in working papers may be preliminary and subject to
revision.
∗
           Bank Technology and the COVID-19 Pandemic

                      Mark J. Kutzbach†                       Jonathan Pogach‡

                                             February 2, 2022

                                                   Abstract

          We examine how banks’ technological investments affected their ability to maintain or
       expand their business in the unprecedented economic recession associated with the COVID-
       19 pandemic. A one standard deviation increase in our financial technology measure, which
       describes a bank’s coverage of products installed at nonbank fintech firms, is associated with
       an 8.7 percentage point increase in Paycheck Protection Program (PPP) loan volume in
       2020Q2. Furthermore, advanced technology enables banks to supply PPP loans outside of
       their branch market area, though this more geographically dispersed lending does not crowd
       out in-market lending. Thus, technology-intensive banks, which seem to operate as a hybrid
       between physically-based traditional banks and less physically-based nonbank fintech lenders,
       can compete effectively for financial products that are less reliant on a relationship lending
       model.

          Keywords: Banking, Fintech, Technology, Paycheck Protection Program, COVID-19

          JEL Codes: G21, G23, O3

   ∗
       The analysis, conclusions, and opinions set forth here are those of the authors alone and do not necessarily
reflect the views of the Federal Deposit Insurance Corporation or the United States. The authors thank Rosalind
Bennett, Jake Goldston, Amanda Heitz, Hua Kiefer, Abdollah Farhoodi and participants of the 15th North American
Meeting of the Urban Economics Association for helpful comments. The authors also thank Michael Carabello,
David Lee, Christopher Offoha, Michael Pessin and Noah Shult for excellent research assistance. All remaining
errors are the authors’ alone.
     †
       Federal Deposit Insurance Corporation. mkutzbach@fdic.gov. 550 17th St NW, Washington, DC 20429.
     ‡
       Corresponding Author:Federal Deposit Insurance Corporation. jpogach@fdic.gov. 550 17th St NW, Washing-
ton, DC 20429.
I. Introduction
The conventional view on the comparative advantage of small banks’ business models centers
on relationship lending. In that narrative, small banks’ structures enable them to acquire
soft information about borrowers’ creditworthiness that is not easily gleaned from a loan
application. In contrast, large banks - through economies-of-scale - and financial technology
firms - through innovations in technology - have comparative advantages in the processing of
a larger volume of loans based on hard information. Consistent with theories of relationship
lending, as of year-end 2019, banks’ with less than $10 billion accounted for 31.6 percent of
the industry aggregate of small-loans to businesses even though the same banks comprised
only 15.2 percent of total industry assets.1 Yet, increases in data availability, advances in
statistical classification methods to identify risk, greater computational power, and the rise of
financial technology firms have the potential to erode the benefits that smaller banks derive
from their comparative advantage in soft information gathering.
Launched in the early weeks of the onset of the 2020 COVID-19 pandemic in the United
States, Paycheck Protection Program (PPP) loans are precisely the information-insensitive,
transactional loans that extant theories suggest are the province of larger banks and tech-
nology firms. In particular, the Small Business Administration (SBA) guaranteed the full
outstanding balance of PPP loans and that guarantee was itself backed by the full faith and
credit of the United States: soft information on creditworthiness provided no comparative ad-
vantage to lenders. Furthermore, because funds were potentially limited and due to pressure
from borrowers, PPP lending volume depended on rapid processing of application materials.
However, the 40.7 percent share of PPP lending volume and 45.1 percent share of total PPP
loans made by banks with less than $10 billion as of June 2020 was not only larger than their
market share in assets, but also an even greater share of PPP lending than their collective
prior small business loan portfolio would suggest.2 Therefore, while relationship banking
1
Source: Call Reports. Small loans to businesses are defined as those with less than $1 million at issuance, as
measured on Call Reports. Small loans are often used as a proxy for small-business lending (see Cortés et al. (2020))
though Federal Deposit Insurance Corporation (2018) notes important limits to its interpretation for that purpose.
2
Source: Call Reports.
2may have played a role in facilitating banks’ PPP lending through pre-existing relationships
(see Li and Strahan (2020)), it is difficult to reconcile relationship lending with the excess
representation of smaller banks in the information-insensitive, transaction-based PPP loan
market.
The rapid onset of the pandemic and the demands on banks’ technological infrastructure
to provide funding through PPP suggest that many small banks’ were not well-equipped to
provide funding. As a June 10, 2020 American Banker article argues, “[w]hen the Small
Business Administration rolled out its Paycheck Protection Program, it set off a fire drill
of sorts among bank technology executives, who had to quickly figure out how to accept
applications from borrowers and load them into the SBA’s system before the money ran out.”3
A March 19, 2020 American Banker article reports that “digial usage is rising alongside the
proliferation of the virus. In some cases, it is surging.”4 Technology reports cite increased use
of process automation, natural language processing, and machine learning tools to improve
speed of operations at banks.5 Together, these articles suggest that banks with stronger
technology were better positioned to take advantage of the unprecedented financial stimulus
associated with the economic fallout of the novel coronavirus.
In this paper, we use evidence from the PPP to demonstrate that technology varies widely
across smaller and mid-sized banks and is a significant component in the average bank’s ability
to support information-insensitive, transaction-based lending. Unlike relationship lending,
transaction-based lending does not rely on knowledge about borrowers that results from close
physical proximity. Consequently, we expect that technology-based lenders lend over a more
diffuse geography given a particular number of loans than do lenders with a physical presence.
While many banks invested in technology and developed partnerships during the pandemic,
we expect that those with pre-existing investments would be the most knowledgable and best
positioned for the demands of remote access. We distinguish high-technology banks from low-
3
Crosman, Penny. “The tech Sunrise Banks used to quickly dole out PPP loans.” American Banker. 10 Jun.
2020.
4
Dobbs, Jim. “Coronavirus throws digital banking into the crucible.” American Banker. 19 Mar. 2020.
5
Wolfgruber, Marlene. “Banks Turn to Automation to Speed SBA PPP Loan Process.” CMSWire June 12,
2020.
3technology banks by computing a Fintech Similarity Score (FSS), which measures a banking
institution’s pre-pandemic coverage of the technology products at a typical nonbank fintech
firm (we assume that fintechs are at the forefront of innovation in financial services). Our
primary measure of geographic lending concentration is a Herfindahl-Hirschman Index (HHI)
of lender-level PPP county-loan concentration (discussed further below).
To provide an overview of how technology facilitates diffuse lending, Figure I plots kernel
densities of the residuals from a lender-level OLS regression of county-loan HHI on a quadratic
expression of log PPP loans (to control for loan volume) for lenders with at least 500 loans.
We plot residuals for nonbank fintech firms, large banks (greater than $50 billion in assets
as of year-end 2019), high-technology (top five percentile FSS) banks between $1 billion
and $10 billion in assets and low-technology (lower 50th percentile FSS) banks between $1
billion and $10 billion in assets. Higher density on the left side of the graph indicates that
conditional on the number of loans, loans tend to be more geographically dispersed for a
given lender type. Conversely, higher density on the right side of the graph indicates that
conditional on the number of loans, PPP loans tend to be more geographically concentrated
for a given lender type. Fintech firms (discussed further below) have the most geographically
dispersed loan portfolios given the number of PPP loans. Large banks, which tend to operate
large branching networks that are expected to produce some ties between lending and their
physical presence, are more concentrated than fintechs, which are thought to operate without
a comparable physical presence. Banks between $1 billion and $10 billion and in the bottom
50th percentile FSS are far more geographically concentrated than fintech firms given the
number of PPP loans issued. Perhaps more surprising is that technology-heavy banks (top
fifth percentile) with between $1 billion and $10 billion in assets not only lend more diffusely
than large banks, but also lend nearly as diffusely as fintechs. Through the remainder of
this paper, we explore the margins along which technology explains differences in bank PPP
outcomes.
Financial technology and its role in the financial landscape is prevalent in discussions in
4the academic literature,6 popular press,7 , and regulatory communities.8 From June 2010 to
June 2019, the number of commercial bank branches declined by 6.3 percent (from 82,011 to
76,837) even as total commercial bank assets grew 22 percent (43 percent nominal growth).
In this way, banks transitioned from a physical branch model toward one using information
technology and online platforms (see Vives (2019)). Yet, in small business lending before
the pandemic, personal contact had remained central to the banking business model, with
only limited competition from fintech firms. The FDIC’s 2018 Small Business Lending Survey
Federal Deposit Insurance Corporation (2018) finds that only 11.2 percent of small banks and
22.8 percent of large banks allowed small business borrowers to apply online (as opposed to
at a branch, by telephone, or on-site). Almost half of large banks, but only one in ten small
banks, considered nonbank fintech firms to be a frequent competitor, with neither size class
of banks considering nonbank fintechs to be a top competitor. Thus, whether the average
bank could be competitive in technology-based lending remains an open question.
Among the largest challenges to examining the role of financial technology in the banking
industry is the measurement of technology itself. Toward this end, we construct a novel
measure of financial technology using product installation data from the Aberdeen Technology
Data Cloud (hereafter Aberdeen). FSS captures the substance of technology investment
more so than the scale. To feature these substantive differences, we also create component
measures for a bank’s similarity to fintech firms within various categories of technology (e.g.
hardware and software). Banks may access technology along other dimensions, for example,
in partnerships or contracting arrangements with technology providers. In robustness checks,
we show that our results hold when we use alternative measures of bank technology based
upon expense information available in quarterly financial statements (Call Reports). We
also show that while FSS is correlated with measures of technological investment from Call
6
See Thakor (2020), and references therein.
7
E.g., Verhage, Julie and Jennifer Surane. “Big Tech Is Coming for Banking: Experts Predict Fintech’s 2020.”
Bloomberg, 23 Dec. 2019.
8
E.g., “The Federal Reserve has committed substantial staff resources to assessing financial innovation related
to our policy and regulatory responsibilities.” Statement for the Record of Staff of the Board of Governors of the
Federal Reserve System, U.S. House of Representatives, 25 June 2019.
5Reports, it appears to capture some distinct aspects of technology.
For our empirical analysis, we examine whether technology, as of 2019, plays an important
role in understanding the average banks’ PPP lending outcomes in the second quarter of 2020.
We find that our FSS technology measure is strongly associated with more intensive and more
geographically diffuse PPP lending, all while controlling for an array of 2019 balance sheet
variables (e.g. bank size). Our finding of technology reducing concentration holds even
after controlling for the geographic concentration of a bank’s deposits and small business
lending in 2019. We also find broadly similar results when substituting Call Report-based
technology measures, which capture different aspects of technology. Thus, technology appears
to facilitate less geographically concentrated PPP lending.
Our results suggest that tech-heavy banks appear to operate in the competitive landscape
between fintech firms and traditional banks. While the physical presence of banks played an
important role in small business lending (as in Bolton, Freixas, Gambacorta, and Mistrulli
(2016)), we provide evidence that technological investments of banks enabled banks to oper-
ate more similarly to fintechs. We compare the PPP lending profile of nonbank fintechs to
banks, segmented according to our technology measures. In a result that parallels Figure I,
we find that banks with technological profiles similar to fintechs issued PPP loans at quanti-
ties and levels of geographic concentration more similar to the nonbank fintechs than other
banks. Conditional on the quantity of loans, we find that the difference in geographic loan
concentration between banks and nonbank fintechs is reduced by approximately 40 percent
when a bank has a technological profile similar to fintechs.
Consistent with our findings regarding the geographic diffusion of lending, we find that
technology is strongly related to the proportion of out-of-area PPP loans made by a bank.
For this paper, we define out-of-area PPP lending as lending in counties or states where a
bank does not have a physical, branch presence. We find that the result is driven primarily by
the out-of-area lending rather than substitution from in-area lending to out-of-area lending.
Technology does not depress in-market PPP loans overall, as might be expected if there
were an “either-or” decision to provide local relationship-based lending versus more remote,
6technological-based loans (or a clear tradeoff between those options). On the other hand,
technology is associated with more out-of-area PPP loans, both large and small. We also
find that bank technological similarity to fintech lenders on hardware and software are the
primary drivers of out-of-area PPP lending conditional on a bank engaging in out-of-area
lending.
Following the view that technology enables banks to operate more similarly to fintechs,
we examine the extent to which county-level PPP credit supply is met by out-of-area lenders
or fintech lenders as a function of local bank technology. We find that those counties whose
banks had stronger technological profiles relied less on out-of-county PPP lenders and fintech
lenders. In contrast, bank technology does not relate to the proportion of county PPP loans
provided by credit unions, consistent with the view that technology is not a primary dimension
along which banks competed with credit unions for PPP loans.
Our research is relevant for understanding the impetus of technological innovation in bank-
ing and its impact on bank outcomes. Prior innovations include the adoption of Automated
Teller Machines (Saloner and Shepard, 1995) and transactional bank websites (DeYoung,
Lang, and Nolle, 2007). These innovations and others (i.e. automated clearinghouse) have
become widespread and may have contributed to consolidation, though many of the bene-
fits were eventually passed on to consumers (Berger, 2003). Early adoption varied with the
characteristics of a bank (e.g. size, extent of branch network, and deposit mix). More re-
cently, Pierri and Timmer (2020) find that banks with higher technology adoption (measured
primarily through computers per employee) prior to the 2008 financial crisis subsequently
had fewer nonperforming loans. In contrast, our analysis focuses on the role of technology
in meeting credit demand when underwriting is a lesser consideration (i.e., backed by the
government). In addition, we are the first, to our knowledge, to provide evidence of how a
bank’s use of technology can be used to mimic fintechs.
Our paper also relates to existing research on the channels through which the banking
system, and financial system more generally, responded to the pandemic and associated gov-
ernment programs. Li, Strahan, and Zhang (2020) show that most of the aggregate deposit
7inflows in 2020Q1 are attributable to credit-line drawdowns at the largest banks. More closely
related to this paper, Li and Strahan (2020) find that traditional measures of relationship
lending (e.g., decreases in bank size, increases in prior experience, increases in commitment
lending, and increases in core deposits) predict PPP lending supply. Erel and Liebersohn
(2020) show that fintechs help pick up slack in PPP lending where there exist fewer bank
branches and Howell et al. (2021) show that Black-owned businesses were particularly likely
to borrow from fintechs. In contrast, we study the role of bank credit supply as a function of
technology (while also controlling for some of the balance sheet factors included in previous
empirical work). Complementing Li and Strahan (2020), we find that while local relationships
mattered for in-area PPP lending, technology is a critical feature to understand the ability of
smaller banks to capture shares of PPP lending above and beyond their pre-existing shares
of small-business lending.
The rest of the paper is organized as follows. Section II provides some background on the
pandemic and the government response. Section III discusses the measures of bank technology
used throughout the paper. Section IV examines the relationship between bank technology
and PPP lending and compares the PPP lending profile of nonbank fintech lenders to bank
PPP lenders. Section V examines the proportion of PPP loans supplied by different segments
of the market based on local bank technology. Section VI concludes.
II. Background
The federal government fiscal response in the United States came in the last few weeks of the
first quarter of 2020. The first territorial mandatory stay-at-home order was not issued until
March 15 (Puerto Rico) and the first state order was not issued until March 19 (California).9
On March 27, 2020, Congress passed the CARES Act, which included the Paycheck Protection
Program (PPP) offering $350 billion in aid to small businesses, later extended to $669 billion
9
Source: Centers for Disease Control and Prevention.
8by the Paycheck Protection Program and Health Care Enhancement Act on April 24, 2020.10
Collectively, the government response to the coronavirus is associated with unprecedented
increases to the commercial and industrial lending reported on banks’ Call Reports. Figure
II plots quarterly C&I lending growth from 2000Q2 until 2020Q2. Bank C&I lending grew
by $343 billion (15.5 percent) in 2020Q1 and by $146 billion (5.7 percent) in 2020Q2. The
first quarter growth is attributable to credit-line drawdowns at the largest banks Li, Strahan,
and Zhang (2020). The second quarter includes $482 billion in lending supported by PPP.
The distribution of PPP lending across banks was uneven, resulting in substantially greater
growth in the highest percentiles of C&I lending (see Figure III).11 In 2020Q2, the median
bank’s C&I lending growth increased by over 42 percentage points relative to the median
bank’s lending growth one year prior: in the prior four years, the increase in the median
bank’s CI lending growth never exceeded 1 percentage point.
III. Data
Our analysis sample of banks derives from quarterly Call Report data. We consider a set of
active banks in 2020Q2 and define balance sheet variables (e.g. assets, or size) from 2019
data. Bank branch locations derive from FDIC Summary of Deposits (SOD) data, reported
as of June 30, 2019. We link these data to loan-level data, data on financial technology, and
data on location characteristics to assemble our analysis dataset.
A. PPP loan-level data
To analyze the role of technology in PPP lending, we use SBA data on the location and
lender names for all PPP loans. To match with Call Report data, we restrict attention
10
In addition, the CARES Act provided direct stimulus payments of up to $1,200 per adult in households earning
less than $99,000 per year. Although the passage of the bill was in the first quarter of 2020, the first stimulus checks
were sent April 13, 2020, and the PPP was opened on April 3, 2020.
11
The Call Reports do not distinguish PPP by loan type. However, Federal Register Vol. 85, No. 98 suggests
that most PPP loans were expected to be commercial and industrial lending, with the remainder as agricultural
loans and all other loans.
9to PPP loans made by June 30, 2020.12 SBA data does not include a unique institution
identifier. Consequently, we match the names of lenders in the PPP data to Call Report
names. In addition, we verify matches by cross-referencing the number of loans by institution
reported in the Call Reports to the number observed in the SBA data.13 We use the loan-level
PPP data, by institution, to construct several measures of lending described in more detail
in Section IV.
B. Local Economic Factors
We include two location-based measures to capture a bank’s exposure to the local PPP
loan demand and the local economic disruption from the pandemic. Both measures are
applied based on the counties in which a bank operates. The PPP loan demand measure is
constructed for each bank-county as the total number of competitor PPP loans made in that
county divided by the total number of 2019 competitor deposits in that county.
Regarding shocks to labor demand because of COVID, which varied widely across indus-
tries, we construct the following economic exposure variable. We first construct a county-level
exposure to national industry employment from 2019Q2 to 2020Q2.14 That is,
X
Exposurec,2020Q2 = zi,c,2019Q2 · gi,2019Q2−2020Q2
i
where industry i represents a three-digit NAICS code, zi,c,2019Q2 is the employment share
of industry i in county c in 2019Q2, and gi,2019Q2−2020Q2 represents the national employ-
ment growth for industry i from 2019Q2 to 2020Q2. County-level employment by industry
comes from the Quarterly Workforce Indicators (QWI) data from the U.S. Census Bureau.15
12
The program ran until August 2020. As of June 30, 2020, 4.89 million loans were made under PPP. As of
August 8, 2020, 5.21 million were made. Source: Treasury PPP Reports, June 30, 2020 and August 8, 2020. The
program was reopened on January 11, 2021 and ended May 31, 2021, comprising an additional 6.68 million loans.
13
Because loans could be withdrawn, the numbers are not expected to match entirely. We drop observations that
differ by more than 300% from the PPP data to the Call Report data.
14
Due to seasonality, especially for harder hit retail and travel industries, this measure is preferred to quarterly
employment growth.
15
This is effectively a Bartik instrument. See Bartik (1992)
10Employment growth is sourced from the Bureau of Labor Statistics. Ex-ante exposure to
industries that were hard hit by the pandemic strongly predicts subsequent employment out-
comes.16 In unreported results, we regress year-on-year Q2 actual employment growth on
predicted employment growth using the industry exposure measure. The coefficient on the
predicted unemployment growth measure is approximately 0.5 and the F-statistic is about
40 both with and without state fixed effects and demographic controls. For each bank, we
construct the bank-specific labor demand shocks by taking a deposit-weighted average of the
county level exposure variable.
C. Fintech Similarity Score
Aberdeen’s Product Install table provides information on the vendors and products installed
at the establishment level (as defined by Dun & Bradstreet, a business information company)
for firms across the United States and Europe. Aberdeen (formerly Harte-Hanks and more
recently of Spiceworks Ziff Davis) uses web-mining of businesses and employee profiles for
data collection and redistributes it for marketing purposes. The range of products covered
includes software, hardware, and communications technologies. While other papers have used
Aberdeen data IT expenditures (Pierri and Timmer (2020)), to the best of our understand-
ing this is the first paper to make use of the Product Install tables. The Product Install
table is highly granular, with establishment level data on products or models, along with
the product class, subclass, and manufacturer.17 Our analysis focuses on subclasses, which
are more granular than classes but more aggregate and more consistently coded than sub-
class/manufacturer pairings. We find a similar pattern of results whether we examine product
installs by class, subclass, or subclass/manufacturer.
To link banks to establishments, we match the Site Description table, which provides a
16
We exclude counties with less than 10,000 people, as the censoring of small employment values becomes an
issue in small counties for calculating county-industry employment shares.
17
A heirarchical example of hardware product is: Server, Mainframe and data integration (class), Other Server
Manufacturer (subclass), IBM (manufacturer), z Mainframe (model). A heirarchical example of software product
is: Digital advertising (class), Web Technology (subclass), Google (manufacturer), Google AdWords (model).
11location’s business name, address and industry information, to the FDIC SOD data on bank
branches.18 Our matching algorithm ultimately covers 95 percent of all banks (i.e. 95 percent
of banks have at least one branch that matches to an Aberdeen establishment).
In addition, we identify nonbank fintech firms names from CB Insights 2018, 2020 Forbes
50, American Banker, Medium, and Crunchbase and obtain address information via their
websites.19 This set of fintech firms is composed primarily of lenders. We then use a similar
name and address matching method to match the fintech firms with the Aberdeen Site De-
scription to link them to the Product Install table. Aberdeen data include a website address,
which we use as an additional matching characteristic. We linked 47 fintech firms to Aberdeen
establishment data.
We construct a measure to assess the similarity between banks and fintech firms as:
PS
F SS = s ws max Ip
p∈Ps
1 PF
ws = F f max Ip
p∈Ps
where Fintech Similarity Score, F SS (or F inT echScore in Tables and Figures), measures
bank coverage of fintech technology (i.e. products used by fintechs get more weight). Ab-
erdeen has P products (e.g. Concur Travel - an online booking tool), indexed p, with each
product belonging to one of S subclasses (e.g. ERP - Enterprise resource planning - soft-
ware), indexed s. The indicator Ip equals one for a bank or fintech using product p (and zero
otherwise), so max Ip = 1 if the entity uses any of the Ps products in subclass s. There are
p∈Ps
F fintech firms, indexed f . Subclass weights, ws , give the share of fintechs with a product
in a subclass, a guage of the importance of those products for financial technology.20 High
18
Matching is limited to 2019 for both Aberdeen and SOD. Aberdeen establishments are limited to those with
a 2-digit SIC code of 60, which includes banks and savings institutions. We standardized names and addresses in
both data files. Matching was done in five passes, starting with the key name, street, city, state, zip, and then
relaxing some elements of the key. We used a Jaro-Winkler string distance comparator to match name fields.
19
Examples include Kabbage, a business lender based in Atlanta, GA (see CB Insights 2018) and Plaid, a payments
firm based in San Francisco, CA (see 2020 Forbes 50).
20
Out of forty two product classes, the ten with the greatest weight among fintech firms include four relating to
software, four relating to hardware and operating systems, as well as products in customer relationship management
and digital advertising.
12scores correspond to a bank being more aligned with the technologies that are more prevelant
among fintech firms (there is no penalty for having other technologies not present in fintech
firms).
D. Summary statistics
Of the 4,092 banks that had the specified characteristic variables for our analysis from Call
Reports and local economic factors, we calculate FSS for 3,384 banks that matched to at
least one Aberdeen site. Our analysis mostly focuses on the intensive margin of PPP use. In
Table I we present summary statistics for the 2,961 of these banks that had at least one PPP
loan in 2020Q2. Financial stock variables are measures as the average quarterly balance over
2019, branches are measures as of the June 2019 SOD, financial flow variables are measured
as the sum over 2019. Aberdeen data is measured from their 2019 data sample. These tables
include log-transformed values for variables entering in regression models in that form.
Figure IV shows the distribution of FSS. As can be seen, there is a heavy right tail to the
distribution, with a subset of several hundred banks having substantially greater alignment
with fintech technology than the bulk of other banks. We expect that banks in this right
tail of the distribution may be especially well positioned to use a wide range of web-based,
computational, and remote methods to reach customers during the pandemic. Longitudinal
analysis of Aberdeen data from 2017, 2018, and 2019 indicates a similar distribution over time
as well as persistence within banks in technology investment. The year-on-year correlation in
FSS is 0.792 from 2018 to 2019 and 0.780 from 2017 to 2018. Our analysis will focus on 2019
values of the FSS, though it may be of interest whether banks with longstanding technology
investments can be differentiated in their 2020 outcomes relative to banks that are newer to
fintech technology.
Because the FSS is highly aggregate, spanning the full range of classes and subclasses, we
also conduct some analyses with components of the FSS. We define four components (com-
posed of subclasses): hardware (e.g. PCs, servers), communications (e.g. Virtual Private
13Networks, phones), services (e.g. personnel management systems, web hosting, accounting),
and software (e.g. digital advertising software, database management software). These com-
ponents are calculated by first computing the share of all fintech firms in the 2019 Aberdeen
data that have at least one install of a subclass. We use these shares as weights of the
importance of a subclass for fintech operations within each component. The scores are calcu-
lated as the inner product of bank-level subclass indicators with the fintech subclass weights
within each component. The software component is substantially broader than the others,
comprising more subclasses than all the others combined.
Why do some banks have more extensive technology investment than others in 2019?
While this question is not the core focus of our paper, the absence of an answer limits
the causal claims we can make in our analysis. Nevertheless, showing how FSS relates to
bank characteristics gives some indication of the type of variation that identifies our results.
In particular, for our analysis to be meaningful, there must be substantive differences in
the technology measures across banks. Here, we show how the technology measures relate
to one another as well as to total assets and number of branches. Figure A.VIII displays
the relationship of FSS with the log of total assets and the log of number of branches.
FSS increases with bank size and number of branches, though there is substantial variabion
throughout most of the size distribution. The largest banks possess installs in almost all of
the financial technology subclasses, so there is little variation among the largest banks.21
IV. Bank PPP Lending
A. Intensive and Extensive Margins of PPP Lending
We first run regressions to examine whether the number of PPP loans issued by a bank are
associated with our technology measure and lagged 2019 controls. We examine both the
21
In Appendix Table A.XIV Column 1, we regress FSS on the bank characteristics used in regression models.
14extensive margin of participating in PPP lending and the intensive margin.
P r(P P P > 0) = logit(βT echb + ΓControlsb ) (1)
Ln(P P P Loans) = βT echb + ΓControlsb + b (2)
We include bank balance sheet variables as controls for traditional factors bank relation-
ship lending (e.g., size, branches, employees, commercial and industrial lending volumes)
and also include the two location-based controls for local PPP demand and local economic
disruption from the pandemic.
In Table II we report results of the extensive margin and intensive margin regressions of
PPP lending on our technology measure, FSS. We first present extensive margin regressions
run as a Logit. While we find that FSS has a strong positive relationship with participation in
PPP when no controls are included (Column 1), once controls are added there is no significant
effect (Column 2). Limiting to banks with at least one PPP loan, we find a strong positive
association between the volume of PPP loans and each of the technology measures on the
intensive margin (Columns 3, 4, 5, and 6). From the parameter estimate in Column 4, a
one standard deviation increase in FSS (from Table I) is associated with a 8.7 p.p. increase
in PPP loan volume in 2020Q2. Thus, it appears that technology may be related with the
extent of participation in PPP lending, but not the decision to participate. With most banks
participating (87.5 percent of our sample), it seems unlikely that technology was a decisive
factor for the low threshold of making any PPP loans. Given these results, we focus on the
intensive margin and (unless otherwise stated) drop banks that did not participate in PPP.
B. PPP Loan Concentration
If technology enables banks to extend credit by means other than their physical establish-
ments, then we expect that it also results in a more geographically diffuse loan portfolio. The
relationship between technology and the concentration of a bank’s loan portfolio is particu-
lary salient in the context of government-backed PPP loans where local or soft information
15is likely to be less valuable for lending decisions.
To examine this hypothesis, we first construct a HHI measure of geographic concentration
for banks PPP loans and deposits. In particular, for each bank b we construct:
!2
X ybg
Y _HHIb = P
g g ybg
where y is the measure of a bank’s deposits or loans for geography g.
In Figure V we plot the distribution of banks’ county concentrations of deposits (left) and
PPP loans (right) for those banks in our regression sample with nonzero PPP lending. Banks
with deposits or lending in only one county have an HHI of exactly one. While bank deposits
are heavily concentrated in a small number of counties (median HHI of 0.668), bank PPP
loans are geographically far more diffuse (0.345).22 The disparity in the diffusion of banks’
PPP loan concentrations relative to their physical deposit presence suggests that factors
beyond physical presence must play a role in bank PPP credit supply.
We estimate a regression similar to Equation 2, restricting attention to only those banks
with nonzero PPP lending. We report results for the effect of FSS on bank PPP geographic
loan concentration in Table III, with Columns 1 through 3 measuring concentration by county
and Columns 4 through 6 measuring concentration by state.23 We include a control of banks’
pre-existing geographic concentration, measured primarily with deposits. In Columns 2 and
4 we restrict attention to banks that operate in a single geography, county and state, respec-
tively. That is, for banks in each sample, the deposit HHI is necessarily equal to 1 (so deposit
HHI is not included in those specifications).
In each case, and even when restricting to single geography banks, we find that higher
values in our technology measure are associated with a less geographically concentrated PPP
22
Whereas the average banks’ deposit base is spread over 1.5 counties, the average banks’ PPP loan portfolio is
spread across 3 counties. Among Community Reinvestment Act (CRA) lenders, county-concentration is similar for
PPP and CRA lending, however, fewer than one in six banks in our sample are CRA lenders and these tend to be
substanially larger, consistent with reporting requirements.
23
See Appendix Table A.XIII for results including controls for loan volume, which do not affect the findings.
16loan portfolio. We also find evidence consistent with the established literature on the role
of relationship banking. In particular, we find that core deposits and branches are associ-
ated with more concentrated PPP lending. Regarding economic significance, a one standard
deviation increase in FSS is associated with a decrease in PPP county concentration (from
Column 1) of 0.0153 (or 0.0665 standard deviations) and a decrease in state concentration
(from Column 4) of 0.0177 (or 0.0804 standard deviations). For perspective, a one standard
deviation increase in geographic deposit concentration is associated with an increase in PPP
county concentration (from Column 1) of 0.1641 (or 0.713 standard deviations). So, the
effects of technology is approximately a tenth as large as the effect of geographic presence.
In Columns 3 and 6 we restrict attention to banks with publicly observable geographic
small business lending data for the Community Reinvestment Act (CRA) in 2019.24 CRA
data include loans to businesses with less than $1 million in revenue and reporting is restricted
to banks with greater than $1.284 billion in total assets as of the end of 2019. Consequently,
the sample size is significantly smaller than the sample used in Columns 1 and 4. However,
the CRA data allows us to construct a loan concentration measure for banks prior to the
pandemic, which we can use as an additional control to understand banks’ PPP loan concen-
trations. In Column 3, we find that banks’ PPP county loan concentrations are negatively
correlated with FSS even after controlling for banks’ CRA loan concentrations. In Column
6, we similarly find that banks’ PPP state loan concentrations are negatively correlated with
FSS after controlling for CRA state loan concentrations. Notably, the parameter estimates
are similar to the estimates in Columns 1 and 4.
C. Fintech Firms versus High-tech Banks
The evidence from prior sections suggests that banks with stronger technology according
to our measures issued PPP loans less like branch-centered traditional banks and closer to
geography-less fintechs. In this section, we explore the extent to which banks with more
technology according to our financial technology measure look like nonbank fintech lenders.
24
CRA Disclosure Files, Table D1-1.
17To do this, we incorporate nonbank data on PPP lending from SBA and rely on the definitions
of Erel and Liebersohn (2020) to classify nonbank fintech lenders. Nonbank fintech lenders
do not generally have financial data similar to our set of controls for banks. Consequently, we
compare banks and nonbank fintechs according to two measures: the quantity of PPP loans
and the geographic concentration of PPP loans. Following Erel and Liebersohn (2020), we
also restrict attention to those lenders that issued at least 500 PPP loans.
In Figure I, we present kernel density plots of nonbank fintech PPP lending (left panel) and
the geographic concentration of PPP lending (right panel), using the county-level construction
of HHI as a concentration measure. We segment banks according to FSS (discussed in Section
III). In the left plot, we show that the distribution of PPP loan volumes is visually similar
between nonbank fintechs and banks with the highest FSS. However, the distribution of PPP
loans issued by banks in the 75th to 90th percentile of FSS is notably lower.25 In the right
plot, we show that the distribution of PPP loan HHIs for nonbank fintechs and high-tech
banks look fairly similar. In contrast, PPP loan concentration is far higher for those banks
in the 75th to 90th percentile of FSS.26
By construction, firms with more PPP loans are able to spread their loans across larger
geographic areas. As a result, it is helpful to distinguish whether the diffusiveness of PPP
loans for nonbank fintech lenders and high-tech banks is a separate issue from the quantity of
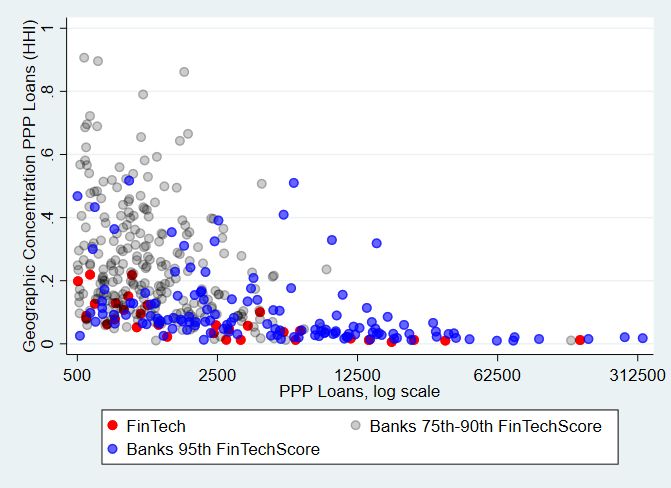
loans. In Figure VI, for lenders with more than 500 PPP loans, we plot the quantity of loans
for nonbank fintech lenders (red), banks in the 75th to 90th percentile in FSS (grey), and
banks above the 95th percentile in FSS (blue). For all firms issuing more than 25,000 PPP
loans, the geographic concentration of loans is similarly diffuse, i.e. HHI is low. However,
for firms issuing fewer loans, we find that only banks with more advanced techonologies have
similar diffusion as fintechs. Consistent with theories of banks and fintechs, banks with less
25
The kernel density plots are skewed even further toward fewer loans for banks in lower percentiles of the FSS
distribution.
26
Despite the visual similarity, a Kolmogorov Smirnov test weakly rejects (90 percent confidence interval) equality
between the nonbank FSS distribution and banks with FSS above the 95th percentile for log PPP loans and HHI,
respectively. Distributional tests for log PPP loans and HHI between banks in the 70th and 95th percentile and
both fintechs and banks in the 95th percentile are strongly rejected (99 percent confidence interval for both).
18advanced technology issue loans in more concentrated geographies.
In Table IV we report regression results of loan-county HHI on log PPP loans. To under-
stand how nonbank fintech loan concentration differs from bank lenders we include a nonbank
fintech indicator variable. Similar, we include an indicator for banks in the 95th percentile
of the FSS distribution. In Columns 1 to 3, we include only those lenders with more than
500 PPP loans. In Columns 4 to 6, we include only lenders with more than 500 PPP loans
and less than 25,000 PPP loans. In Columns 2 and 5, we include log PPP loans as a linear
terms and in Columns 3 and 6, we allow for a quadratic relationship between log PPP loans
and loan HHI. Across all specifications, we find that banks in the 95th percentile FSS and
nonbank fintechs are less concentrated in lending geography than other banks. In addition,
the concentration difference between banks and nonbank fintechs is cut substantially (a little
less than half, for the specifications including a control for lending volume) when a bank is
in the 95th percentile in FSS. Thus, it appears that banks with a stronger technology base
tend to operate as hybrids between traditional physical branches and fintech lenders.
D. In and Out of Market PPP Lending
Bank lending markets are often physically proximate to their branches, within the county,
MSA, or state (see, Federal Deposit Insurance Corporation (2018)). Evidence from Li and
Strahan (2020) suggests that physical proximity and measures of traditional banking also
played an important role in the participation of banks in the PPP program. In this section,
we examine the role that technology played in affecting where banks’ lent money under PPP.
While local relationships may have enabled banks to provide PPP loans locally, we hy-
pothesize that technology may have given banks an opportunity to expand the reach of their
PPP lending out of area. To understand the role of technology in the location of PPP loans,
we run an OLS regression of the proportion of out-of-area PPP loans made by a bank on our
19technology measures and lagged 2019 controls:
P P P (Outof Area)b
= βT echb + ΓControlsb + b . (3)
P P P (T otal)b
We report results from the OLS regression of Equation 3 in Table V. In Columns 1
through 3 we report results of a regression using the proportion of loans made outside of
counties with a bank’s branch as the dependent variables and in Columns 4 through 6 we
report the results of a regression using proportion of loans made outside of states with a
bank’s branch as the dependent variable. In Columns 1 and 4, we first estimate a Logit
with an outcome indicating whether a bank makes any out-of-area loans. For both county
and state definitions, technology does not appear to matter on the extensive margin. To
investigate the intensive margin, we explain the proportion of out-of-area loans, first for all
banks making any PPP loans (in Columns 2 and 5) and then for banks with any out-of-area
loans (in Columns 3 and 6). In all of these cases, we find that banks with a higher FSS have
a higher percentage of out-of-area loans.
E. Technology Classes
Our results suggest that banks with greater technological investment bear resemblance to
fintech firms (as defined in Erel and Liebersohn (2020)) with regard to their ability to lend
in areas without a physical branch presence. In this section, we delve further into the kinds
of technology installed at banks that are most associated with their PPP lending. We re-run
regressions from the above tables using the breakdown of FSS by technology type (hardware,
communications, services, and software), as described in Section III and report results in
Table VI. We find that the hardware and software components of FSS each have significant,
positive effects on loan volume (Columns 2 to 4). For out-of-area lending, the hardware
component appears to the strongest effect on dispersed lending and proportion of lending out
of area, though software has a similar pattern of estimates, though less precise. The effect of
the hardware component is also larger than the software component when measured in terms
20of a standard deviation change in each component. Thus, it appears that hardware (and its
associated technologies, such as server operating systems) plays the most important role in
the ability of banks to engage in out-of-area lending, with software playing a secondary role.
F. PPP Lending: Out-of-Area and In-Area Loan Quantities
To unpack the findings of Table V, we examine the quantities of PPP lending in area and
out of area. In doing so, we can assess whether banks substitute out-of-area PPP lending
for in-area PPP lending or whether they change the total amount of PPP loans. We run
regressions of the following form by loan size and in- or out-of-area markets:
Ln(P P P + 1)b = βT echb + ΓControlsb + b . (4)
We define in-area as those regions (i.e., county or state, depending on the specification) where
a bank had a physical branch as of June 2019 and out-of-area as those regions where the bank
did not have a physical branch.
In Table VII, we report the results from the regression of out-of-area PPP loans on the
FSS measure and controls. In Columns 1 through 3 we report results for out-of-county PPP
loans and in Columns 4 through 6 we report results for out-of-state PPP lending. In Column
1, we find that the FSS is strongly correlated with the number of out-of-county PPP loans.
We find that the effect is similar for small ($1 million) PPP loans in Column 3. We find similar results for out-of-state PPP lending.
Though we find that the increase in the proportion of out-of-area lending is driven in part
by more out-of-area PPP loans, we also examine whether the technology is associated with
decreases in in-area PPP lending. That is, does technology depress the relationship lending
function found in Li, Strahan, and Zhang (2020)?
To examine in-area lending quantities, we run regressions of in-area lending at the bank
and bank-geography levels. As above, geographies are defined at the county and state levels.27
27
Note that we cannot perform similar analysis for out-of-area bank-geographies, as we do not have any similar
21We report the results from the in-area regressions of lending in Table VIII.
In Column 1, we report results of a bank-level regression of in-county PPP loans on the
FSS and bank controls. We do not find a significant relationship between technology and
in-area PPP lending. We then examine the data at the bank-geography level, allowing for
geography fixed effects as well as bank-geography specific measures on local presence, such
as number of branches or deposits. Given the ability to control for local factors using fixed
effects, we also exclude the bank-level local economy proxies of local PPP loan demand and
exposure to COVID related employment shocks. The results do not differ materially when
including them in lieu of geography fixed effects.
In Columns 2 through 4 we report results using the number of in-county PPP loans
including bank-county fixed effects. In Column 2 we find that banks with a higher FSS did
not make any more or less PPP loans in counties where they had a physical presences, relative
to other banks. We find that technology has a slight negative relationship in Column 3 with
the number of small ($1 million) in-county PPP loans. Consistent
with Li and Strahan (2020), we find that local presence, measured using in-county deposits
and/or branches, is associated with in-county PPP loans, for both small and large loans.
In Columns 5 through 8 we report results of similar regressions at the bank-state level.
In Column 5, we do not find that a higher FSS is associated with more in-state PPP lending
at the bank-level and similarly in Column 6 we find no association with PPP lending at the
bank-state level, after controlling for state fixed effects. Similar to the bank-county analysis,
in Columns 7 and 8 we find that there is no relationship between small PPP in-state loans and
technology, but there is a a strong positive association between technology and large in-state
PPP loans. Furthermore, we find that in-state measures of physical presence (deposits and
branches) are significant drivers of in-state PPP lending for all loan sizes. Combined with the
results from Section IV.F, the results suggest that the relationship between technology and
measure of a bank’s presence in a geography out-of-area prior to the pandemic. Furthermore, there is not a clear way
to establish the appropriate set of bank-geographies for out-of-area lending, as the vast majority of bank-geography
pairs are associated with zero PPP loans.
22the proportion of PPP loan out-of-area is driven primarily by increases in out-of-area loans
and not through the substitution of in-area loans for out-of-area loans.
G. Expense-based measures of financial technology
As alternative measures of bank use of financial technology, we consider two expense-based
measures reported by banks in quarterly Call Reports. We expect that these measure may
capture different aspects of technology than our product-based measure, FSS, though they
may also affect lending outcomes. Whereas we expect that FSS most directly reflects the
types in-house technological capabilities of a bank, our expense measures may reflect both
the scale of technology investment and use of external, contracted capabilities (and potentially
partnerships).
Our first alternative measure, other noninterest expenses (Call Report Schedule RI, item
7.d.) reports spending other than salaries and employee benefits, premises and fixed assets,
and intangible assets. As reported below, we find that the plurality of other noninterest
expenses are associated with data processing. Additional subitems that may relate to tech-
nology include advertising and marketing expenses and telecom expenses. Other noninterest
expense also includes research and development costs incurred in the internal development of
computer software. Our second alternative measure, data processing expeneses (Call Report
Schedule RI-E, item 2.a.) is more specific to technology, and reports “services performed for
the bank by others.”
From Call Reports, we observe other noninterest expense for all banks, but subitems,
including data processing, may be censored. As of 2018, subitems of other noninterest ex-
pense have minimum reporting thresholds of $100,000 and seven percent of other noninterest
expenses. The data does not distinguish between true zeros and censored values, and some
banks below the reporting thresholds respond anyways. In addition, due to year-to-date
(cumulative) reporting on quarterly filings, there are substantially more censored observa-
tions for earlier quarters. For our analysis, we use the most recent year-end values of other
23noninterest expense and noncensored values of data processing expense. From 2016 to 2019,
there is a noncensored observation for bank data processing expenses for 81 percent of banks’
December Call Report data.28
Other noninterest expense is best understood by examining its components. Table IX
reports statistics on the breakdown of subitems in Schedule RI-E relative to other noninter-
est expense. We also report the count of nonzero observations, and note the exact shares
of each subitem are not certain (and could be higher or lower) due to censoring across each
of the subitems. Data processing expenses account for the plurality of other noninterest ex-
penses, but still represent just 19.1 percent of other noninterest expense on average (treating
empties as zero). If we restrict to only those observations with strictly positive data pro-
cessing expenses, it makes up approximately 24 percent of other noninterest expenses. The
next largest (observed) driver of other noninterest expense in Schedule RI-E is advertising
and marketing expenses, which accounts for 5.0 percent of other noninterest expense and
may include expenses on digital advertising. Telecommunications expenses associated with
telephone, telegraph, cable, and internet services (including web page maintenance) account
for 2.6 percent of observed total other noninterest expenses. Thus, the plurality of expenses
captured by other noninterest expense reflects the technology investments of interest, though
the measure incorporates many other expenses outside our scope of interest.
Figure VII displays the relationship of FSS with other noninterest expense and data
processing expense. While one might expect these measures to be related (as larger banks
might use more technology), the product information clearly presents another dimension of
technology investment. These figures show that the expense and product install measures
capture related, but somewhat different dimensions of technology investment and exhibit
variation across a wide range of bank sizes.29
28
In unreported analysis, we use multiple imputations for data processing expenses. Because the censored variable
is necessarily selected on the basis of the censored variable’s value, the multiple imputation uses only those banks
below the reporting thresholds that nevertheless report data processing expenses. All results using data processing
expenses are robust to using multiply imputed data rather than restricting to uncensored values.
29
Appendix Table A.XIV Columns 2 and 3, explains other noninterest expense and data processing expense in
terms of the main specification control variables.
24Table X reports results equivalent to Table II (for PPP lending and volume) and III (for
geographic concentration of lending). These expense results exhibit a similar pattern as the
FSS results using Aberdeen data for product installs as a measure of technology. Table XI
presents additional results that include both FSS and expense based measures. The effect
of FSS on loan volume remains positive and statistically significant, and the effect of FSS
on loan concentration remains negative and significant, even when including expense-based
measures of technology alongside FSS. These results suggest that product- and expense-based
investments in financial technology may have similar, complementary effects that facilitate
processing of PPP loans, especially for out-of-area borrowers.
V. County PPP Loan Supply
Our bank-level results suggest that technology heavy banks operate more similarly to fintechs
than other banks. Consequently, we expect that a borrower inclined to use a technologically-
based lender is more likely to view local bank technology as a substitute for a potentially out-
of-area loan. Even so, that tendancy may be diminished if local banks are more technologically
savvy.
Thus, we examine whether the local presence of technology heavy banks relates to the
nature of competition for local PPP loans. In particular, we expect that a county with more
technologically-oriented banks might rely less on out-of-area lenders in general, or fintechs
in particular, than counties with less technologically-oriented banks. On the other hand, we
expect that technology plays a lesser role in local banks’ abilities to compete for customers
more associated with traditional relationship lending.
To examine these hypotheses, we construct a county-level bank technology variable equal
to the deposit-weighted average of banks’ FSS for that county. Similarly, we construct a
measure of the deposit-weighted average of log bank assets. We also include county aggregates
of bank branches, credit union branches, and the county-level deposit HHI (where county-
shares are calculated at the bank level). We also incorporate demographic data such as the
25You can also read