Barings Core Property Fund - (BCPF) - Mendocino County
←
→
Page content transcription
If your browser does not render page correctly, please read the page content below

Barings Core Property Fund
(BCPF)

February 2021
Barings Core Property Fund: Executive Summary

        FUND OBJECTIVE                                             MARKET OPPORTUNITY                                                 BARINGS EXPERTISE

•   Construct a private equity portfolio targeting             •   Fundamentals are improving, as governments                   •   24+ year cycle-tested track record
    core, income producing real estate assets                      work to accelerate the COVID-19 recovery
    in primary U.S. markets                                                                                                     •   In-house expertise spans portfolio management,
                                                               •   Real estate is a compelling alternative to                       acquisitions, asset management, research &
•   Consistently outperform the NFI-ODCE while                     volatile public markets                                          strategy, and other shared platform services
    strategically managing risk
                                                               •   Core real estate, focused on durable income, is              •   Strong Equity and Debt capabilities providing
•   Diversify by sector, geography, and tenancy                    an attractive investment across cycles                           unique insights and ability to execute

          7-9% / 4-5%                                                         40+ Years                                                      7.5% / 4.7%

As of December 31, 2020.
1. Investors should bear in mind that these are return targets, rather than actual returns, and the Fund may experience substantial loss. There can
     be no assurance that such return targets will be achieved. Distribution yield is based on yield adjusted for weighted average equity for the period.
2. Source: NFI-ODCE 1988-2018, Investor Diversified Realty. Style appropriate time period is greater than five years.
3. Fund Inception Date: July 1, 2004. Since Inception returns are annualized.
For investment professionals only                                                         2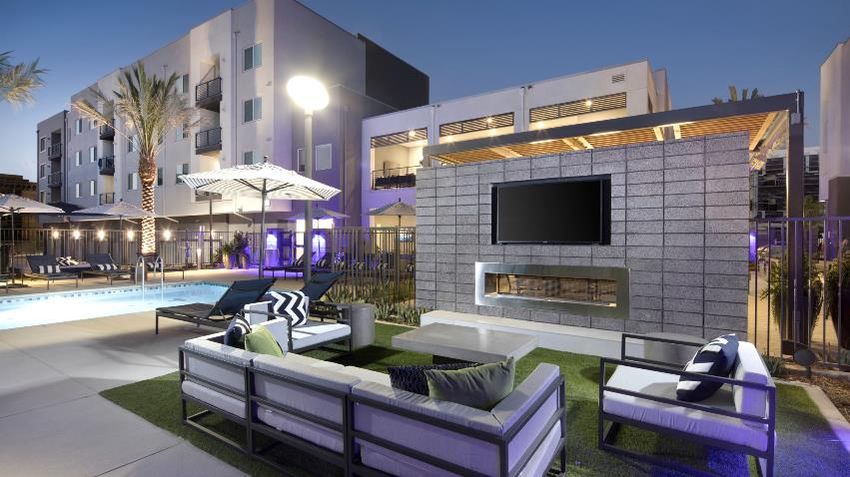
Table of Contents
Section 1: Barings Overview
Section 2: Barings Real Estate Overview
Section 3: Barings Core Property Fund
Section 4: Barings Real Estate Research & Strategy
Section 5: Barings Core Property Fund Portfolio Construction
Appendix
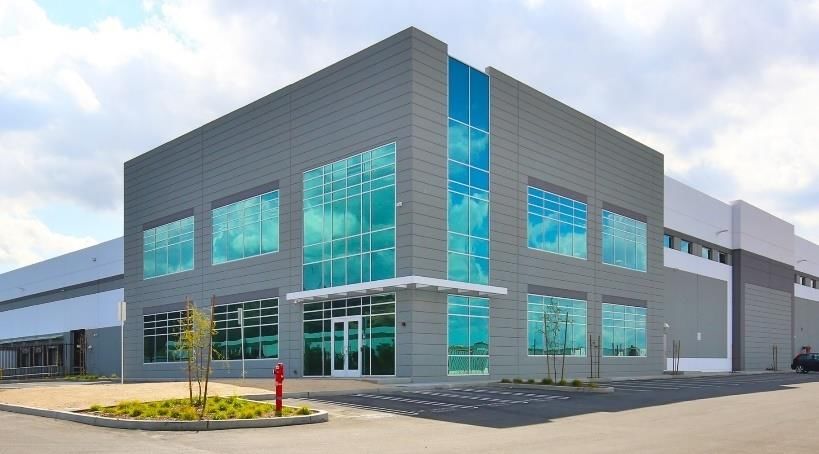
METRO POINT LOGISTICS 33 NEW MONTGOMERY SUN VALLEY INDUSTRIAL TRIANGLE APARTMENTS
NY - NORTHERN NJ SAN FRANCISCO LOS ANGELES SEATTLE
For investment professionals only 3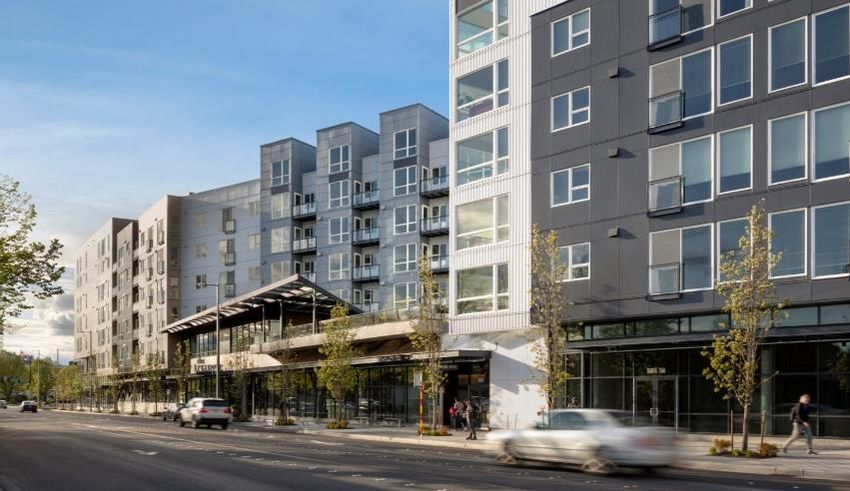
Section 1: Barings Overview

Barings Overview

     •   Barings is a GLOBAL INVESTMENT MANAGER sourcing differentiated
         opportunities and building portfolios across public and private fixed income, real                    $345+ B
         estate and specialist equity markets
                                                                                                           ASSETS UNDER MANAGEMENT

     •   A subsidiary of MASSMUTUAL , we have the financial stability and flexibility to
         take a long-term approach
                                                                                                                 1,200+
     •   Our GLOBAL FOOTPRINT gives us a broad perspective and the ability to truly                            EXTERNAL CLIENTS 1
         partner with our clients to invest across North America, Europe and Asia Pacific

     •   We are committed to SUSTAINABLE PRACTICES AND RESPONSIBLE
         INVESTMENT as we aim to serve our clients, communities and employees
                                                                                                                 1,700+
                                                                                                           PROFESSIONALS GLOBALLY

                                                                                                           EXTERNAL AUM BY REGION 2

                                                                                                                34%            31%

                                                                                                                       35%

           Global Headquarters            Investment Offices          Other Locations                      Americas   Asia Pacific   EMEA

1. Number of clients excludes structured funds and mutual funds.
2. Includes third party, external AUM only.
All figures are as of December 31, 2020 unless otherwise indicated. Assets shown are denominated in USD.
For investment professionals only                                                    5
Global Investment Capabilities

                                                           Barings leverages its DEPTH AND BREADTH OF EXPERTISE across public
                                                                 and private markets to help meet our clients’ evolving investment needs

                                                                                                              PUBLIC
                                      PUBLIC FIXED INCOME 1                                                                                    PUBLIC EQUITIES & MULTI ASSET 2
                 Provides access to strategies ranging from investment grade                                                    Aims to deliver superior risk-adjusted returns through fundamental
                    to high yield across developed and emerging markets                                                             analysis and high-conviction, high-active share solutions

                                          INVESTMENT GRADE 3                                                                                    GLOBAL & INTERNATIONAL EQUITIES
                                             $113.1 B AUM                                                                                                  $3.4 B AUM

                                 HIGH YIELD BONDS AND LOANS 4                                                                                         EMERGING MARKET EQUITIES
                                          $59.7 B AUM                                                                                                        $8.9 B AUM

                                          STRUCTURED CREDIT                                                                                                  SMALL CAP EQUITIES
                                              $17.3 B AUM                                                                                                        $3.1 B AUM

                         GLOBAL SOVEREIGN DEBT & CURRENCIES                                                                                                         MULTI ASSET
                                                  $11.7 B AUM                                                                                                        $4.1 B AUM

                                                                                                             PRIVATE
                      PRIVATE CREDIT                                                                    REAL ESTATE 5                                                                PRIVATE EQUITY 5
     Offers a diverse range of private debt financing                                 Provides a broad spectrum of solutions across                               Leverages our global presence in an effort to identify
 solutions by partnering with our broad industry network                                    private real estate debt and equity                                        unique risk-adjusted return opportunities

               GLOBAL PRIVATE FINANCE                                                               REAL ESTATE DEBT6                                                           DIRECT PRIVATE EQUITY
                    $19.4 B AUM                                                                        $33.5 B AUM                                                                    $2.4 B AUM

 INFRASTRUCTURE & PRIVATE PLACEMENTS                                                               REAL ESTATE EQUITY                                                         FUNDS & CO-INVESTMENTS
             $38.0 B AUM                                                                               $14.4 B AUM                                                                   $3.6 B AUM

                                                                                                      MULTI STRATEGY
                                       Utilize our expansive asset market coverage to offer solutions such as income, target return and absolute return

1.      Excludes the Korean fixed income strategy and other fixed income, totaling $2.0 billion in AUM.
2.      Excludes the Korean domestic equities strategy, which has $10.3 billion in AUM and other equities of $0.3 billion.
3.      As a result of an acquisition that took place on January 4, 2021, the AUM shown as of 12/31/20 reflects an additional $11.6B that Barings does not currently have under management. The
        amended AUM will be reflected in the Q1 2021 AUM number.
4.      Includes the EM Corporate Debt strategy, which has $4.8 billion in AUM.
5.      Projected AUM figures.
6.      Includes real estate debt assets that are managed as part of affiliated fixed income portfolios.
All figures are as of December 31, 2020 unless otherwise indicated. Assets shown are denominated in USD.

For investment professionals only                                                                                   6
Section 2: Barings Real Estate Overview
Barings Real Estate Platform

                                                          BARINGS REAL ESTATE PLATFORM

   $45.4B / $11.0B                                 268                             22 / 9                                  683                            180+
             AUM/AUA                       Dedicated Investment           Local Offices in Countries                Active Investments            Institutional Investors
                                              Professionals

                             REAL ESTATE DEBT                                                                            REAL ESTATE EQUITY

                      $29.4B AUM/$11.0B AUA                                                                                 $16.0B AUM
                 Benefits from broad direct origination capabilities                             Applies an active management approach in an effort to maximize
                              and deep credit expertise                                                               each asset’s potential

                          STYLE                                                    SECTOR                                             CAPITAL STRUCTURE

           Core, Core+, Value-Add, Opportunistic             Office, Multifamily, Industrial/Logistics, Retail, Hotel,       Direct Equity & Debt (Senior, Stretch Senior,
                                                                               Niche/Alternatives                                     Mezzanine, Subordinate)

        EXPANSIVE PLATFORM                            DEPTH OF TEAM                                LOCAL PRESENCE                                  STABILITY

           Promotes constant market              Spans entire investment process:           Local origination and acquisition teams      Significant support from our parent,
         participation—uncovering the               acquisitions and originations;            in key markets provides real time             MassMutual, investing capital
      interconnectivity between markets,          investment, asset, and portfolio              feedback and trend monitoring                    alongside our clients
             economies and cycles               management; research and strategy;
                                                     and other shared services

As of September 30, 2020. Office count and Investment Professional count as of October 2020, taking into account the agreed spin-off of the German
third party asset management business as announced on October 12, 2020 and expected to complete in early November 2020.
For investment professionals only                                                       8
Barings Real Estate Private Equity U.S. Platform

                                                 BARINGS REAL ESTATE U.S. OFFICES & ASSETS

 U.S. PRIVATE EQUITY
 HIGHLIGHTS

 $10.9B
 ASSETS UNDER MANAGEMENT

 6 OFFICES ACROSS THE U.S.
 BOSTON, MA
 CHARLOTTE, NC
 CHICAGO, IL
 EL SEGUNDO, CA
 HARTFORD, CT
                                                                                                                 Barings Real Estate
 NEW YORK, NY
                                                                                                                 Private Equity Offices
                                                                                                                 Barings Real Estate
 69 DEDICATED REAL ESTATE                                                                                        Private Equity Assets
 PROFESSIONALS

 INTEGRATED PLATFORM PROMOTING
 A HOLISTIC APPROACH TO
 INVESTING                                                            ASSET ALLOCATION
                                                                           117 TOTAL ASSETS
 ACQUISITIONS
 ASSET MANAGEMENT                            STYLE                                                    SECTOR
 PORTFOLIO MANAGEMENT
 RESEARCH & STRATEGY
 RISK MANAGEMENT                                                                                                Hotel
                                                                                                                14.9%
                                                    Opportunistic/
                                                    Construction
 OUR LOCAL TEAMS PRODUCE                                                                      Multifamily
                                                       25.4%                                   30.2%
 STRONG NETW ORKS AND UNIQUE
                                                                                                                    Industrial
 ACCESS                                                                                                               11.6%
                                    Core/Core+            Value-Add
 SECTOR-SPECIALIZED ASSET             62.8%                 8.7%
 MANAGERS ENHANCE VALUE AND                                                                                         Retail
                                                                                                                    11.5%
 MAXIMIZE INCOME
                                                                                                       Office
                                                                     Turnaround/                       31.0%
                                                                      Distressed                                        Land
                                                                         3.2%                                           1.0%

As of September 30, 2020.
For investment professionals only                        9
Section 3: Barings Core Property Fund
Barings Core Property Fund Team
                                                                         JOHN OCKERBLOOM
                                                                            BEN SILVER
                                                                       CO-HEAD OF U.S. REAL ESTATE

                                     BARINGS REAL ESTATE U.S. PRIVATE EQUITY INVESTMENT COMMITTEE

                                                           BARINGS CORE PROPERTY FUND TEAM

                                                                                                                                     EMMA CARLONE
                                                                                                                                        FUND ANALYST

                                                                                                                                     COREY PINETTE
                                                                                                                                        FUND ANALYST

                                                                                                                                     STACY GRECULA
                                                                                                                                     FUND ADMINISTRATOR

                         CHRIS BERRY                        DEB SCHWARTZ                         CHARLIE MURRIN                      2 FUND CONTROLLERS
                         PORTFOLIO MANAGER                   PORTFOLIO MANAGER                 ASSISTANT PORTFOLIO MANAGER

   RESEARCH & STRATEGY                                   ACQUISITIONS                              ASSET MANAGEMENT                      PORTFOLIO MANAGEMENT

           PHILIP CONNER                                   CHRIS BLACK                                  JOHN KENNEDY                                   JOE GORIN
  U.S. REAL ESTATE RESEARCH & STRATEGY          REAL ESTATE ACQUISITIONS – WESTERN U.S.          U.S. REAL ESTATE ASSET MANAGEMENT     U.S. REAL ESTATE PORTFOLIO MANAGEMENT AND
                                                                                                                                                  VALUE-ADD INVESTING
           PAUL STEWART                                   KEVIN MILLER                                   JERRY SPELTZ
EUROPE & ASIA PACIFIC REAL ESTATE RESEARCH      REAL ESTATE ACQUISITIONS – EASTERN U.S.             U.S. REAL ESTATE ENGINEERING
               & STRATEGY
                                                      JIM O’SHAUGHNESSY                             24 investment professionals             CAPITAL STRATEGIES
                                                          REAL ESTATE HOTEL
       8 investment professionals
                                                                                                                                                  PAM BONEHAM
                                                     20 investment professionals                                                                U.S. CAPITAL STRATEGIES

                                                                     PLATFORM SHARED SERVICES
                                             BUSINESS MANAGEMENT – CAPITAL MARKETS – COMPLIANCE – ESG – GLOBAL INVESTMENT SERVICES
                                                    INVESTMENT ACCOUNTING – LEGAL – PRODUCT MANAGEMENT – RISK MANAGEMENT

 Organizational structure as of January 25, 2021. Personnel as of December 31, 2020.
 For investment professionals only                                                        11
Barings Core Property Fund
UNIQUE POSITIONING COMPELLING RESULTS
Strategic market allocations and disciplined
Outperformed NFI-ODCE on a 3- and 5-year basis
asset selection drives outperformance
Active asset management fuels income growth Generated 3.1% NOI growth over the past year, with over
and value creation 700,000 sqft of commercial leasing
Competitive size and agile portfolio management Risk-mitigated approach: no hotels, malls, senior housing,
seeks to avoid at-risk sectors co-working tenancy, or Houston exposure
Non-core strategies drive alpha and supplement Produced over 500 bps of non-core outperformance
the core portfolio during value-creation and nearly 600 bps once stabilized 1
Forward-looking ESG strategies designed to
Ranked 2nd out of 48 funds in the 2020 GRESB survey2
create and enhance long-term value
Strong platform and significant, long-term MassMutual investment provides stability, demonstrates
parent company investment alignment, and limits competing capital
The above represents the views of the Barings Real Estate Team as of December 31, 2020 and are subject to change at any time.
PAST PERFORMANCE IS NOT NECESSARILY INDICATIVE OF FUTURE RESULTS
1. Source: MSCI ACOE Benchmark Report dated December 31, 2020. Non-core performance is over the trailing 3-year period.
2. GRESB Peer Group represents the U.S. Diversified Core peer set participating in GRESB.
For investment professionals only 12Barings Core Property Fund: Characteristics
CHARACTERISTICS1,2
GAV ($B) 3.5
NAV ($B) 2.5
Number of Assets 43
Core Commercial Occupancy (%) 95.1
Leverage (%) 27.1
Core Exposure (%) 90.0
2020 GRESB Survey Ranking 2nd of 48
Mondial River West
Subscription Queue ($M) None
Redemption Queue ($M) 106.9
Number of Investors 124
Parent Company Investment (% of NAV) 16.1
SECTORS3,4
Assets BCPF % NFI-ODCE % Target %
Apartment 14 32.2 26.6 35.0
Industrial 9 17.1 21.6 20.0
33 New Montgomery Gateway 190 Industrial Portfolio
Office 6 31.6 32.9 25.0
Retail 9 15.5 14.2 15.0
Other 5 3.6 4.4 5.0
REGIONS4
Assets BCPF % NFI-ODCE % Target %
West 16 43.2 41.8 40.0
East 11 30.1 31.0 30.0
South 14 23.1 19.0 25.0
Midwest 2 3.6 8.1 5.0
Sun Valley Industrial Park Park Central at Flower Mound
As of December 31, 2020.
1. Subscription Queue and Redemption Queue as of January 4, 2021.
2. GRESB Peer Group represents the U.S. Diversified Core peer set participating in GRESB.
3. Other includes Self Storage, Land, and Mezzanine Debt.
4. Diversification figures are based on Ownership of GMV. NFI-ODCE figures may not sum due to rounding.
For investment professionals only 13Barings Core Property Fund: Value-Enhancing Active Investments
Near-term upside from over $250 million in accretive investments
TOTAL YIELD1 / CAP
ASSET STATUS HIGHLIGHTS
COST ($M) RATE SPREAD
BARDIN ROAD • State-of-the-art, 400,000 sf cross-docked warehouse
AMERICANA 6.50% with 36’ clear heights and ample trailer parking
Lease-Up 24.4
Industrial, 150 bps • Located adjacent to Interstate 20 with excellent access
Dallas to key highways within the DFW metroplex
• Modern, 1,900-unit self-storage facility that also
CERRITOS
7.75% includes 50,000 sf of vehicle storage
SELF STORAGE Lease-Up 41.8
250 bps • Located in an attractive bedroom community with
Los Angeles
limited competing supply
• Climate controlled, 1,840-unit self-storage asset located
MAIN STREET
Q2 2021 7.00% in downtown Los Angeles
SELF STORAGE 51.5
Completion 200 bps
Los Angeles • Limited modern self storage inventory despite strong
residential growth in the area
ALTAIRE AT • Highly amenitized, 330-unit apartment community in
MILLENIA LAKES 6.00% one of the nation’s hottest apartment markets
Mid-2021
68.9
Completion 125 bps
Apartment, • Benefits from walkability to upscale retail, easy highway
Orlando access, and proximity to job centers
• Forward commitment to acquire a 121,000 sf boutique
701 RIO
Mid-2021 7.00% office building in downtown Austin
Office, 72.1
Completion 150 bps
Austin • Features modern floor plates, a rooftop terrace, and
strong walkability to numerous retail & dining options
As of December 31, 2020.
1. Underwritten yield at stabilization.
For investment professionals only 14Barings Core Property Fund: Performance
BCPF continues to outperform based on durable income, with valuations that are in-line with the NFI-ODCE
1,2
HISTORICAL PERFORMANCE (%)
BCPF Net Return BCPF Income BCPF Appreciation NFI-ODCE Income NFI-ODCE Appreciation
9.44 9.88
10
7.46 7.51
8.54
6.46 6.21 4.65
4.99
2.33 2.23
6.56
4.96 4.92
2.08 1.93
5 0.58 1.19 5.65
0.72 0.81
4.20
5.04 5.18
4.25 4.32 4.63 4.70
0.45 1.30 3.85 4.22 4.08 4.22
0.38
0.28 0.90 0.92
0 -0.45
-0.12
-2.59
-3.55
-5
Q4 1 Year 3 Year 5 Year 10 Year Since Fund Inception
Gross
Distribution 0.88 3.53 3.93 4.10 4.49 4.66
Yield (%)
As of December 31, 2020.
PAST PERFORMANCE IS NOT NECESSARILY INDICATIVE OF FUTURE RESULTS. Figures will not sum due to geometric linking.
1. Fund Inception Date: July 1, 2004. For periods greater than one year, returns are annualized.
2. Gross distribution yield is based on yield adjusted for weighted average equity for the period.
For investment professionals only 15Barings Core Property Fund: Mendocino County’s Investment
Mendocino County Employees’ Retirement Association
$10,000,000 on July 1, 2011
COMMITMENTS
$7,800,000 on January 1, 2017
REDEMPTIONS None
DRIP PARTICIPATION Yes
NAV $28,668,919
Since
1 Year 3 Year 5 Year
Inception1
Gross Total (%) 0.58 4.96 6.45 8.70
Gross Income (%) 4.25 4.22 4.31 4.55
Gross Appreciation (%) -3.55 0.71 2.08 4.02
Net Total (%) -0.32 3.97 5.40 7.59
Net Income (%) 3.33 3.23 3.27 3.47
Net Appreciation (%) -3.55 0.71 2.08 4.02
As of December 31, 2020. Past performance is not a guarantee of future performance.
1. Account since inception: July 1, 2011
For investment professionals only 16Section 4: Barings Real Estate Research & Strategy
Real Estate Research & Strategy Team

                                     PHILIP CONNER                                                               PAUL STEWART
                                    HEAD OF U.S. REAL ESTATE                                              HEAD OF EUROPE & ASIA PACIFIC
                                     RESEARCH & STRATEGY                                                REAL ESTATE RESEARCH & STRATEGY

                                                                   RESEARCH & STRATEGY

         OFFICE                  MULTIFAMILY 1                 INDUSTRIAL 2                        RETAIL                          EUROPE

         Ryan Ma                    Ryan LaRue                     TJ Parker                  Abigail Rosenbaum          Ben Thatcher        Jo Warren
   U.S. Office Specialist,    U.S. Multifamily Specialist   U.S. Industrial Specialist        U.S. Retail Specialist   European & APAC    European & APAC
  U.S. Geographic Market                                                                                                   Generalist         Generalist
   Specialist, Asia Pacific
           Liaison

As of December 31, 2020. Research professionals also cover hotel sector.
1. Includes Student Accommodation
2. Includes Self Storage
For investment professionals only                                                        18
2021 U.S. Outlook: Spring Is Coming...
WINTER IS HERE, BUT SPRING IS COMING U.S. Real GDP
(US$ Trillions)
$22
• Recovery was well underway in Q3, but has been suspended
$20
due to surging COVID cases
$18
• Authorities have reintroduced restrictions on social and business
activities, limiting social interactions and economic growth
$16
• Employers added 12+ million jobs from May-November, then
$14
shed 227k jobs in December amid new COVID restrictions
$12
• Job losses in December remained concentrated in the services
3Q99
3Q00
3Q01
3Q02
3Q03
3Q04
3Q05
3Q06
3Q07
3Q08
3Q09
3Q10
3Q11
3Q12
3Q13
3Q14
3Q15
3Q16
3Q17
3Q18
3Q19
3Q20
3Q21
3Q22
3Q23
sector, with more than 500k jobs lost in leisure & hospitality alone
Recessions Real GDP Forecast
• With additional fiscal relief and steady progress in vaccinations in
H1 2021, economy should be regaining momentum by end of Q2
U.S. Employment
(Millions of Jobs)
• Even with a robust rebound in jobs, unemployment is likely to
165
remain elevated for an extended period, which should keep the
Fed from raising rates anytime soon 160
155
150
145
140
135
130
3Q99
3Q00
3Q01
3Q02
3Q03
3Q04
3Q05
3Q06
3Q07
3Q08
3Q09
3Q10
3Q11
3Q12
3Q13
3Q14
3Q15
3Q16
3Q17
3Q18
3Q19
3Q20
3Q21
3Q22
3Q23
Recessions Employment, total Forecast
Sources: Oxford Economics, Barings Real Estate Research (January 2021)
For investment professionals only 19Consumers Will Be Key to Recovery
CONSUMERS SPENDING, BUT CONFIDENCE FRAGILE CORE RETAIL SALES
(US$ Billion, Seasonally Adjusted)
$450
• Supported by government stimulus and consumer savings, $430
core retail sales have surpassed pre-pandemic levels $410
$390
• This swift rebound stands in contrast to the prolonged $370
recovery after the Great Financial Crisis (GFC) $350
$330
30 months
• After peaking in September at an all-time high, core retail $310
sales have drifted lower over the last 3 months of 2020 as $290
businesses were forced to close or scale back operations $270
$250
Jun-16
Jun-07
Jun-08
Jun-09
Jun-10
Jun-11
Jun-12
Jun-13
Jun-14
Jun-15
Jun-17
Jun-18
Jun-19
Jun-20
• Consumer confidence avoided the steep declines seen
during the GFC, rebounding from the lows early in the
pandemic
• Confidence suffered a setback in late summer and again in CONSUMER CONFIDENCE INDEX (1985 = 100, SA)
November as fiscal relief programs expired and new COVID 200
cases spiked 180
160
140
• Latest confidence readings (January) showed a slight uptick
120
in consumer expectations, an encouraging sign consumers 100
see light at the end of the tunnel 80
60
40
20
0
Jan-20
Jan-07
Jan-08
Jan-09
Jan-10
Jan-11
Jan-12
Jan-13
Jan-14
Jan-15
Jan-16
Jan-17
Jan-18
Jan-19
Jan-21
Jul-07
Jul-08
Jul-09
Jul-10
Jul-11
Jul-12
Jul-13
Jul-14
Jul-15
Jul-16
Jul-17
Jul-18
Jul-19
Jul-20
Recessions Present Expectations
Sources: Moody’s Analytics (U.S. Census Bureau, The Conference Board, NBER), Barings Real Estate Research
For investment professionals only 20U.S. Office Market
SECTOR OUTLOOK
NE G ATI V E NE T ABS O RP TI O N AL RE ADY E X CE E DS G F C
Fundamentals 30 17%
• National office vacancy in Q4 increased by an additional 90 bps to 15%,
20 16%
still below the GFC peak but rising quickly
10 15%
• Negative net absorption since the start of the pandemic has already
exceeded the total during the GFC 0 14%
• Pressure on fundamentals continues to intensify in tech markets such as -10 13%
San Francisco, San Jose and Austin
-20 12%
• Capital remains readily available for modern, well-leased office assets
-30 11%
with credit and term, but data points are scarce for assets with vacancy
and/or credit risk -40 10%
2008
2020
2005
2006
2007
2009
2010
2011
2012
2013
2014
2015
2016
2017
2018
2019
COVID-19 Implications
Completions (msf) Net absorption (msf) Availability (rt)
• Work-From-Home will continue until the vaccine has been distributed
widely, and will likely accelerate adoption of more flexible working
arrangements CAP RATE S DRI F T UP W ITH HI G HE R TRANS ACTI O N V O L UM E
• Leasing decisions will be delayed until the recovery is on firm footing 9.5% $80
• Post-pandemic, expect tenants will demand modern buildings with state- 9.0% $70
of-the-art health and wellness features and technology infrastructure 8.5% $60
Key Themes 8.0% $50
• In top tech markets, job growth and occupancy are forecast to outperform 7.5% $40
• Multi-cycle densification trend has been a headwind to absorption but 7.0% $30
could stabilize or reverse course post-pandemic 6.5% $20
• Long-term leases protect landlords, but tenant health should be 6.0% $10
monitored
5.5% $0
Q101
Q102
Q103
Q104
Q105
Q106
Q107
Q108
Q109
Q110
Q111
Q112
Q113
Q114
Q115
Q116
Q117
Q118
Q119
Q120
Quarterly volume ($bil) Office cap rate
Sources: Barings Real Estate Research, CBRE-EA (Q4 2020), Real Capital Analytics (Q4 2020)
For investment professionals only 21U.S. Retail Market
SECTOR OUTLOOK
W E AK ABS O RP TI O N TURNE D NE G ATI V E I N Q 3
Fundamentals 80 14%
• National availability rate in Q4 for neighborhood and community 60 13%
centers remained stable at 9.4%, or ~80 bps higher than a year ago
40 12%
• Neighborhood & community centers have performed better than other
formats and were seeing increasing foot traffic before restrictions were 20 11%
re-introduced 0 10%
• Rent collections have improved from less than 60% last spring to more -20 9%
than 80%, but service-oriented inline tenants face near-term headwinds
-40 8%
COVID-19 Implications
-60 7%
• Pandemic likely to accelerate e-commerce adoption among some
2006
2007
2008
2009
2010
2011
2012
2013
2014
2015
2016
2017
2018
2019
2020
cohorts
• Retailers are building capabilities to fulfill online and in-store orders Completions (msf) Net absorption (msf) Availability (rt)
• Neighborhood centers have emerged as important last-mile distribution
points TRANS ACTI O N V O L UM E DO W N, CAP RATE S S TABL E
Key Themes 9.5% $35
• Grocery stores and other essential retail will continue to outperform 9.0% $30
other retail formats
8.5% $25
• Online grocery shopping will continue to increase, but is unlikely to
8.0% $20
replace grocery shopping at “brick-and-mortar” centers in strong trade
areas 7.5% $15
7.0% $10
6.5% $5
6.0% $0
Q401
Q402
Q403
Q404
Q405
Q406
Q407
Q408
Q409
Q410
Q411
Q412
Q413
Q414
Q415
Q416
Q417
Q418
Q419
Q420
Quarterly volume ($bil) Retail cap rate
Sources: Barings Real Estate Research, CBRE-EA (Q4 2020), Real Capital Analytics (Q4 2020)
For investment professionals only 22U.S. Apartment Market
SECTOR OUTLOOK
AP AR TM E N T D E M AN D F E L L S H AR P L Y I N H 1 2 0 2 0
(TRAILING 4Q ABSORPTION AND COMPLETIONS)
Fundamentals
• Nationally, apartment vacancies remain at historically low levels (4.4%) 400 8%
but are increasing in most markets
300 7%
• Supply continues to deliver and permitting activity so far shows little
disruption from COVID 200 6%
• Homeownership in 2020 increased to its highest level in a decade, a 100 5%
potential headwind to apartment demand
0 4%
• Equity and debt capital is readily available for most segments of the
apartment market, but the GSEs will have less capital available in 2021 -100 3%
COVID-19 Implications
-200 2%
• Suburban markets have been less impacted than downtown / urban
2012
2005
2006
2007
2008
2009
2010
2011
2013
2014
2015
2016
2017
2018
2019
2020
locations
• Class B/C apartments face increased risk due to mounting rental debt Completions (000s units) Net absorption (000s units) Vacancy (rt)
and looming expiration of eviction moratoriums
TRANS ACTI O N V O L UM E RE BO UNDE D I N Q 4 2020
• Class A apartments face increased risks from new supply and rising 9.0% $80
homeownership
8.5% $70
Key Themes 8.0% $60
• Demographic tailwinds are weaker than a decade ago, but remain 7.5% $50
supportive 7.0% $40
• Millennial renters’ focus shifting to good schools, walkable amenities and 6.5% $30
good access to employment nodes 6.0% $20
• Housing shortage and limited mortgage availability put homeownership 5.5% $10
out of reach for many renter households
5.0% $0
Q401
Q402
Q403
Q404
Q405
Q406
Q407
Q408
Q409
Q410
Q411
Q412
Q413
Q414
Q415
Q416
Q417
Q418
Q419
Q420
Quarterly volume ($bil) Apartment cap rate
Sources: Barings Real Estate Research, CBRE-EA (Q4 2020), Real Capital Analytics (Q4 2020)
For investment professionals only 23U.S. Industrial / Logistics Market
SECTOR OUTLOOK
Q 4 I NDUS TRI AL ABS O RP TI O N AT 20 -YE AR HI G H
Fundamentals 125 15%
• Industrial net absorption in Q4 surged to a 20-year high, snapping a 100 14%
nearly 2-year streak of completions outpacing absorption and driving 75 13%
down the availability rate to 7.3% 50 12%
• Healthy demand for functionally modern warehouse product should drive 25 11%
rent growth, albeit at a slower pace than in recent years 0 10%
-25 9%
• As the consensus favorite among equity investors and lenders, industrial
-50 8%
prices continue to climb
-75 7%
COVID-19 Implications
-100 6%
•
2005
2006
2007
2008
2009
2010
2011
2012
2013
2014
2015
2016
2017
2018
2019
2020
E-commerce demand continues to drive absorption as online and
traditional retailers move quickly to build out their online fulfillment
capabilities Completions (msf) Net absorption (msf) Availability (rt)
• Sharp increase in online grocery sales has buoyed demand for cold
storage TRANS ACTI O N V O L UM E BACK TO P RE -CO V ID L E V E L S
9.5% $45
Key Themes 9.0% $40
• Functional obsolescence will propel future demand for industrial 8.5% $35
$30
• “Near- / on-shoring” is likely to boost demand over the medium term 8.0%
$25
7.5%
$20
7.0%
$15
6.5% $10
6.0% $5
5.5% $0
Q401
Q402
Q403
Q404
Q405
Q406
Q407
Q408
Q409
Q410
Q411
Q412
Q413
Q414
Q415
Q416
Q417
Q418
Q419
Q420
Quarterly volume ($bil) Industrial cap rate
Sources: Barings Real Estate Research, CBRE-EA (Q4 2020), Real Capital Analytics (Q4 2020)
For investment professionals only 24Section 5: Barings Core Property Fund Portfolio Construction
Barings Core Property Fund: Investment Themes in the Decade Ahead
DEMOGRAPHICS INNOVATION
• The final and largest wave of Baby Boomers will turn 65 within 10 years • The digital economy has grown 3x faster than the U.S. economy since 1997
• The economic torch will gradually pass to Millennials and Gen Z, the most • Tech employment expanded ~24% since 2010 versus 15% for non-tech jobs
educated generations yet
• Strong tech employment growth positions metros focused on Science,
• Cities that attract a disproportionate share of these cohorts should benefit Technology, Engineering and Mathematics (STEM) jobs for outperformance
from more vibrant local economies and resilient real estate fundamentals
• Cities with high levels of educational attainment and STEM jobs have
• Targeting where Millennials and Gen Z want to live and work will drive alpha experienced higher population growth over the past decade
U.S. POPULATION BY AGE PERFORMANCE vs. NPI 1
Metros satisfying at least
Millennials
5.0 one of these criteria:
Gen Z Gen X Baby Boomers
4.5 (75 mil) (65 mil)
• Austin
4.0
• Baltimore
3.5 • Boston
Population (m)
3.0 +126 bps • Charlotte-Raleigh
2.5 • Denver
Silent
2.0 Generation +72 bps • Minneapolis
(23 mil)
• New York
1.5
• Orange County
1.0
Greatest • Portland
0.5 (3 mil)
Metros where +40% Metros where +9% • SF Bay area
0.0 of the population has of jobs are in • Seattle
0
5
10
15
20
25
30
35
40
45
50
55
60
65
70
75
80
85
90
95
100
an advanced degree STEM sectors • Washington, DC
Age
1. Average three-year forward total return for the basket of markets vs. the NCREIF Property Index (NPI) since 1994, calculated as the average
performance of markets meeting thresholds at the time of performance measurement, not necessarily the markets that meet the thresholds currently.
Sources: U.S. Census Bureau, U.S. Bureau of Economic Analysis, U.S. Bureau of Labor Statistics, Pew Research Center; Barings Real Estate Research.
For investment professionals only 26Barings Core Property Fund: Market Positioning
Target markets are based on our investment themes and grounded in Barings’ proprietary City-Sector scoring
STRATEGY AND EXECUTION MARKET DIFFERENTIATION
• Target metros that are poised to benefit from demographic tailwinds, and which rank • Traditional markets have deep institutional ownership, while offering
highly in educational attainment and STEM employment stable growth and greater liquidity
• Traditional Markets: Target emerging nodes in higher growth metros with compelling • These markets represent 67% of the market value of the NPI 1
relative value, barriers to new supply, and favorable demand drivers
• Ascending markets have an expanding employment base, growing
• Ascending Markets: Increase allocation to tech-focused metros that offer attractive housing markets, and increasing institutional ownership
risk-adjusted returns and future outsized growth
• Over the next five years, population and employment growth are
• 15% exposure as of Q4 2020, with a medium-term target of 15% - 20% projected to exceed the US by 102 and 136 bps, respectively2
HIGH CONVICTION MARKETS
Apartment
Apartment
Industrial
Industrial
Office
Office
Retail
Retail
TRADITIONAL ASCENDING
MARKETS MARKETS
Boston ● ● ● Atlanta ● ●
Dallas - Fort Worth ● ● Austin ● ●
Los Angeles ● ● ● Charlotte / Raleigh ● ●
Miami / South FL ● ● Denver ●
New York - Northern NJ ● Orlando ● ● ●
Traditional Market
SF Bay Area ● ● ● Portland ●
Ascending Market
BCPF Exposure Seattle ● ● Salt Lake City ● ●
1. Source: NCREIF Property Index.
2. Source: Moody’s Analytics, Oxford Economics.
For investment professionals only 27Barings Core Property Fund: Sector Positioning
Sector allocations are adjusted based on their risk profile at a given time in the cycle
STRATEGY INVESTMENT CRITERIA
APARTMENT
• Maintain OVERWEIGHT exposure • Attractive discount to single-family / condo ownership
• Target close-in, transit-oriented nodes with high • Newer assets in top school districts, with +60 Walk
single-family housing costs and barriers to Scores and less than a 30 minute drive to job centers
supply through acquisitions and development • +100 bps cap rate spread for new developments
Boardwalk at Millenia
INDUSTRIAL
• Achieve OVERWEIGHT exposure • Last-touch assets in Traditional & Ascending markets
• Utilize non-core allocation to acquire or build • 2005-vintage or newer assets with market-standard
modern warehouse properties in port markets clear heights, column spacing, and truck doors
and major distribution nodes • +100-150 bps cap rate spread for developments
Jupiter Road Industrial Park
OFFICE
• Maintain UNDERWEIGHT exposure • Minimal capex that does not directly enhance value
• Continue building high-quality portfolio of CBD • Flexible, efficient floor plates with low loss factors
and CBD-adjacent properties, particularly in (10% - 20%) and market-standard parking ratios
Ascending markets with live-work-play attributes • Opportunity to implement ESG and wellness strategies
Chevy Chase Plaza
RETAIL
• Achieve UNDERWEIGHT exposure • Track record of increasing sales and sustainable
health ratios (anchors below 5%; in-lines below 15%)
• Focus on necessity-based, primarily grocer-
anchored assets in dominant trade areas with • Diverse tenancy with minimal co-tenancy restrictions,
supply constraints and strong demographics termination options, and shadow tenants / parcels
Renaissance Creek
Source: Barings Real Estate Research.
For investment professionals only 28Barings Core Property Fund: ESG and 2020 GRESB Results
STRATEGY
• The Barings Core Property Fund is committed to sustainable investment and management
• Achieve 100% green building certification for the office portfolio and pursue IREM CSP certification for
retail & multifamily properties and BREEM for industrial properties
• Improve property-level utility and waste data through monitoring, sustainability measures and driving reductions
• Achieve ENERGY STAR certifications for all eligible buildings
• Committed to Barings Real Estate Responsible Contractor Initiatives
HISTORIC GRESB RESULTS
Rank
Rank
Rank 2 nd
5th of 48
100
Rank 6th of 47
4th of 42
Rank Rank of 39
Rank 8th 15th
80 7th of 33 of 31
of 36
60
40
20
0
2014 2015 2016 2017 2018 2019 2020
BCPF U.S. Diversified Average Global Average
Source: GRESB Real Estate Assessment 2020. GRESB Peer Group represents the U.S. Diversified Core peer set participating in GRESB.
All intellectual property rights to these data belong exclusively to GRESB BV (GRESB). All rights reserved. GRESB has no liability to any person
(including a natural person, corporate or unincorporated body) for any losses, damages, costs, expenses or other liabilities suffered as a result of any
use of or reliance on any of the information which may be attributed to it.
For investment professionals only 29Barings Core Property Fund: Durable Base of Income
Strong occupancy, minimal near-term lease expirations, and tenant diversification mitigate downside risk
TENANCY OVERVIEW NEAR-TERM LEASE EXPIRATIONS (%)
Industrial Office Retail
• The portfolio is well-leased with a diverse tenant base 20
15%
15 14%
• The core portfolio is 94% occupied and 94% leased:
10
Property Type Occupied (%) Leased (%)
5%
Office 88 88 5
Industrial 99 99
Retail 93 94 0
2021 2022 2023
Core Commercial Assets 95 95
Apartments 92 92 INDUSTRY CONCENTRATION
All Core Assets 94 94
Industry Base Rent (%)
• Only three properties are currently in lease-up Professional, Scientific, and Technical Services 22.3
Finance and Insurance 17.6
• Including the lease-up assets, total occupancy is 88%
Retail Trade 14.6
Transportation and Warehousing 5.5
• Weighted average lease term (WALT) of 5.3 years Accommodation and Food Services 5.4
Manufacturing 5.3
• Less than 1% of commercial leases roll by year-end Other Services (except Public Administration) 5.1
Information 5.1
Wholesale Trade 4.8
• Industry concentration Admin, Support, Waste Mgt., and Remediation Svcs. 4.8
• Three travel industry tenants comprising 25,104 sf Other 2.7
• Two energy industry tenants comprising 75,097 sf Health Care and Social Assistance 2.3
Utilities 1.9
• No tenant represents more than 2.5% of base rent
Real Estate and Rental and Leasing 1.4
Arts, Entertainment, and Recreation 1.2
Total 100.0
As of December 31, 2020.
For investment professionals only 30Barings Core Property Fund: Non-Core Strategy
NON-CORE STRATEGY
• Attractive Spread To Acquisitions: Non-Core yields are a meaningful spread over market cap rates, driving performance
• Build And Hold Superior Core Product: BCPF’s Non-Core assets continue to outperform even after they convert to Core assets
• Prudent Use Of Allocation: Near-term target of 10-15% Non-Core, which is well within the Fund’s 20% Non-Core limit1
PORTFOLIO CONSTRUCTION NON-CORE EXPOSURE
BY SECTOR BY STRATEGY
Repositioning
12%
CORE
Apartment
30% Industrial
NON- 27% Development
CORE 37%
Land Lease-up
Self 8% 51%
CONVERTED Storage
CORE 30% Retail
Office 3%
2%
• BCPF’s “Not Stabilized” assets • Target short duration strategies that • Balanced utilization of lease-up and
outperformed the index by 533 bps2 can be executed / stabilized quickly development strategies
• BCPF’s Converted Core assets • Current emphasis on Industrial and • Weighting is adjusted depending on
outperformed the index by 593 bps2 Apartment opportunities the stage of the real estate cycle
As of December 31, 2020. Data represents weighted average non-core exposure over a three year period.
1. Maximum non-core allocation is based on the Fund’s Gross Asset Value.
2. Outperformance based on MSCI ACOE Benchmark Report over a three year period.
For investment professionals only 31Barings Core Property Fund: Leverage Strategy
CHARACTERISTICS1 DEBT MATURITIES BY SECTOR ($M) 2,3
Apartment Industrial Office Retail Self Storage
Leverage Ratio (%) 27.1
400
Fixed Rate (%) 100.0
Floating Rate (%) – 300
Weighted Average Coupon (%) 3.4
Debt Service Coverage Ratio 4.2x 200
Weighted Average Duration (Years) 2.6
100
Non-Recourse Loans (%) 90.0
Cross Collateralization None 0
2020 2021 2022 2023 2024 2025+
LEVERAGE BY SECTOR2
LEVERAGE STRATEGY
Property Type GMV ($M) MV of Debt ($M) LTV (%)
Apartment 1,112.8 267.2 24.0
Industrial 589.4 71.0 12.1 • Enhance returns without adding inordinate risk
• Strong preference for property-level, fixed-rate, non-recourse debt
Office 1,084.7 347.6 32.0
• 53% of the Fund’s assets (39% of GMV) are unlevered, providing flexibility
Retail 532.8 54.8 10.3 • Executed by in-house capital markets team
Land 19.6 - - • Focused heavily in multi-tenant sectors such as Office and Apartments
• Maximum of 35% leverage; targeting 20-25% in the near-term
Self Storage 108.3 20.7 19.1
As of December 31, 2020.
1. Leverage Ratio includes all debt. All other values exclude revolving line of credit.
2. Property-level debt only, excludes term loan.
3. Based on principal balance.
For investment professionals only 32Barings Core Property Fund: Apartment
SECTOR OUTLOOK
SINGLE-FAMILY HOMES FOR SALE AT HISTORIC LOWS
(thousands, seasonally-adjusted)
Fundamentals
• Nationally, apartment vacancies remain at historically low levels (4.4%)
3,500
• Homeownership spiked in Q2 but has since ticked back to prior levels. Rising
homeownership levels could pose a headwind to future apartment demand 3,000
Key Themes 2,500
• Demographic tailwinds are weaker than a decade ago, but remain supportive
2,000
• Housing shortage and limited mortgage availability put homeownership out of
reach for many renter households 1,500
COVID-19 IMPLICATIONS 1,000
1990
1996
1982
1984
1986
1988
1992
1994
1998
2000
2002
2004
2006
2008
2010
2012
2014
2016
2018
2020
Short term: Moderate risk
• Potential cash flow disruptions from the demand shock
• Workforce housing and Class B/C apartments most at risk SUBURBAN OCCUPANCY EXCEEDS URBAN
OCCUPANCY IN MOST FUND MARKETS
• Supply more of a concern for luxury product 100%
• Student housing at near-term risk due to school closings 98%
Long term: Favorable 96%
• Declining housing affordability, restrictive lending and shifting preferences
94%
support apartment demand over the long term
92%
TARGET MARKETS 90%
88%
• Atlanta • Dallas - Ft. Worth • Portland
86%
• Austin • Los Angeles • Salt Lake City
Dallas
Boston
Chicago
Seattle
York
Denver
Worth
Diego
Austin
Orlando
Oakland
New
San
Fort
• Boston • Miami / South Florida • San Francisco
• Charlotte-Raleigh • Orlando Urban Occupancy (%) Suburban Occupancy (%)
Sources: Barings Real Estate Research, U.S. Census Bureau, Moody’s Analytics, CBRE-EA Q3 2020.
For investment professionals only 33Barings Core Property Fund: Apartment Strategy
INVESTMENT STRATEGY
Maintain overweight exposure with emphasis on newer assets in close-in, transit-
oriented locations with high single-family housing costs and barriers to new supply
• Select development & repositioning in coastal and technology markets
• Urban core “next tier” submarkets and CBD-adjacent nodes
• Focus on walkability, top school districts, and quick commutes to job centers
PORTFOLIO POSITIONING
• 2,955 Class A for-rent apartment units located in major markets, with an
additional 330 units slated for completion in mid 2021 2019 NAIOP Multifamily
Development of the Year Award Winner
• 90.8% leased
• 52.4% High-rise / 47.6% Garden-style exposure TRIANGLE
REDMOND, W ASHINGTON – SEATTLE MSA
EXPOSURE
BCPF NFI-ODCE BCPF TACTICAL MID-
Q4 2020 Q4 2020 TARGET TERM POSITIONING
32.2% 26.6% 35.0% Overweight
HISTORICAL APARTMENT ALLOCATION (%)
40
20
BCPF Residential
NFI-ODCE Residential
0
BOARDWALK AT MILLENIA
2012 2013 2014 2015 2016 2017 2018 2019 2020 OTAY RANCH, CALIFORNIA – SAN DIEGO MSA
As of December 31, 2020. Source: Barings Real Estate.
For investment professionals only 34Barings Core Property Fund: Apartment
BOARDWALK AT MILLENIA
BCPF APARTMENT ASSETS OTAY RANCH, CALIFORNIA – SAN DIEGO MSA
Asset Name MSA Units Acquired
Boardwalk at Millenia San Diego, CA 309 2019
Center City Portfolio Philadelphia, PA 213 2015
Highlands at Westwood New York - Northern NJ 214 2010
Millenia Lakes Apartments Orlando, FL N/A 2014
Mondial River West Chicago, IL 141 2013
Park Central at Flower Mound Dallas-Ft Worth, TX 307 2013
Park on Brodie Lane Austin, TX 290 2015
Reserve at Evanston Chicago, IL 193 2011 OVERVIEW
Recently completed project located in the Millenia master planned community
Ridge Boston, MA 264 2006 with strong walkability featuring spacious floor plans and a suite of amenities
ASSET MANAGEMENT PLAN
Riello New York - Northern NJ 226 2014 • Complete rebranding of property to progress leasing initiatives
• ESG Initiative: Newly constructed with environmentally-friendly materials
Triangle Seattle, WA 195 2016 including low flow water fixtures, drought-resistant landscaping, ENERGY
STAR appliances and electrical car charging capabilities
Varsity Berkeley Oakland, CA 79 2015
Village at Taylor Pond Boston, MA 200 2013 STYLE AT ACQUISITION Core+
Water Tower Flats Denver, CO 324 2010 PROPERTY SECTOR / SIZE (UNITS) Apartment / 309
ACQUISITION DATE September 2019
TOTAL 2,955
SOURCE Competitive
LEVERAGE (%) 52.7%
OCCUPANCY (%) 94.5 / Multi-Tenant
As of September 30, 2020.
For investment professionals only 35Barings Core Property Fund: Industrial
SECTOR OUTLOOK
WAREHOUSE DEMAND REBOUNDS IN Q4 2020
Fundamentals 300,000 16
• Demand rebounded in Q4 driven by strong net absorption of warehouse space 14
250,000
• Availability is forecast to increase but remain below prior-cycle peak for fund 12
markets 200,000
10
150,000 8
Key Themes
6
• Functional obsolescence will propel future demand for industrial 100,000
4
• “Near- / on-shoring” will likely to boost demand over the medium term 50,000
2
0 0
2010 2011 2012 2013 2014 2015 2016 2017 2018 2019 2020
COVID-19 IMPLICATIONS
Completions Net Absorption Availability Rate
Short term: Moderate risk (SF x 1000) lhs (SF x 1000) lhs (%) rhs
• Warehouse space demand has held up relatively well during the pandemic and
we expect the underlying shift from the consumption of services to goods to
provide tailwinds over the near-term. INDUSTRIAL SPACE DEMAND RIDING ON E-COMMERCE TAILWINDS
• E-commerce demand has remained strong posting its biggest quarterly increase
1,600 18%
in Q2. Although the share reported a slight decline in Q3, it still remains well
1,400 16%
above historical rates.
1,200 14%
Long term: Favorable 12%
1,000
• Firms deploy supply chain risk mitigation strategies, increasing industrial demand 10%
800
8%
• Reconfiguration of supply chains will support industrial demand 600
6%
400 4%
TARGET MARKETS 200 2%
0 0%
• • •
Dec-13
Dec-99
Dec-00
Dec-01
Dec-02
Dec-03
Dec-04
Dec-05
Dec-06
Dec-07
Dec-08
Dec-09
Dec-10
Dec-11
Dec-12
Dec-14
Dec-15
Dec-16
Dec-17
Dec-18
Dec-19
Atlanta Dallas - Ft. Worth NY - Northern NJ
• Boston • Los Angeles • Seattle
• Charlotte-Raleigh • Miami / South Florida • San Francisco Total Retail sales (lhs) E-commerce as a percent of retail sales
Sources: Barings Real Estate Research, U.S. Census Bureau (BOC), CBRE-EA Q4 2020.
For investment professionals only 36Barings Core Property Fund: Industrial Strategy
INVESTMENT STRATEGY
Achieve overweight exposure by acquiring or building modern warehouse
properties in port markets and major distribution nodes
• E-tail driven, last mile warehouse in markets with strong demographic trends
• “Traditional” local light manufacturing and distribution assets
• Utilize non-core allocation to acquire or build at better than market yields
PORTFOLIO POSITIONING
• 4.3M square feet of high-quality warehouse assets
• 65% of the portfolio was acquired using non-core strategies
• 89.8% leased including a property in lease-up
• 12.3% same-store NOI industrial growth in the last 12 months SUN VALLEY INDUSTRIAL PARK
SUN VALLEY, CALIFORNIA – LOS ANGELES MSA
• 5.5 year weighted average lease term
EXPOSURE
BCPF NFI-ODCE BCPF TACTICAL MID-
Q4 2020 Q4 2020 TARGET TERM POSITIONING
17.1% 21.6% 20.0% Overweight
HISTORICAL INDUSTRIAL ALLOCATION (%)
40
BCPF Industrial
NFI-ODCE Industrial
20
0 METRO POINT LOGISTICS CENTER
2012 2013 2014 2015 2016 2017 2018 2019 2020 RIDGEFIELD, NEW JERSEY – NY / NORTHERN NJ MSA
As of December 31, 2020. Source: Barings Real Estate.
For investment professionals only 37Barings Core Property Fund: Industrial
JUPITER ROAD
BCPF INDUSTRIAL ASSETS GARLAND, TEXAS – DALLAS-FORT WORTH MSA
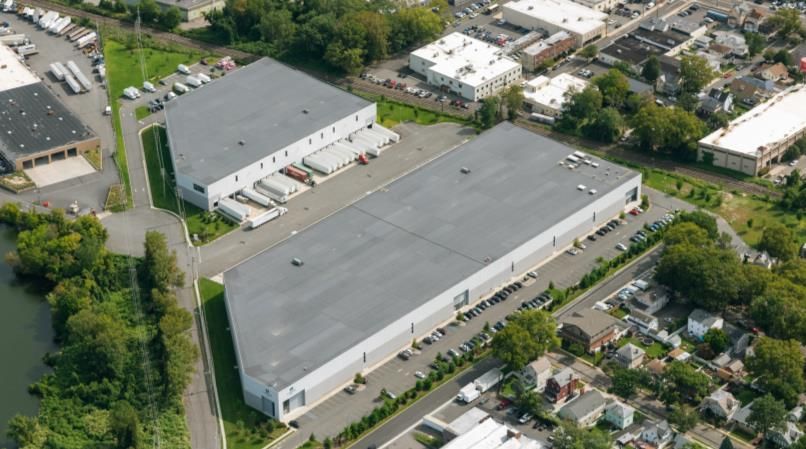
Asset Name MSA SQFT Acquired
191 Blair Road New York - Northern NJ 198,854 2018
215 Blair Road New York - Northern NJ 188,672 2017
Bardin Road Americana Dallas-Ft Worth, TX 401,115 2019
Gateway 190 Portfolio Dallas-Ft Worth, TX 964,015 2015
Jupiter Road Industrial Park Dallas-Ft Worth, TX 764,761 2018
Metro Point Logistics Center New York - Northern NJ 278,300 2017
Northpoint Business Center Las Vegas, NV 421,093 2016
Riverpark 500-600 Dallas-Ft Worth, TX 727,316 2010 OVERVIEW
Newly constructed, three-building asset on a 42 acre site. Each building is cross-
Sun Valley Industrial Park Los Angeles, CA 352,498 2015 docked with 36’ clear heights, ESFR sprinklers and room for 88 trailer spaces
ASSET MANAGEMENT PLAN
TOTAL 4,96,624 • Complete lease-up and occupancy of spaces leased in the first half of 2019
• ESG Initiative: Use of cool roofing reduces energy usage by reflecting solar
energy; track landlord paid utilities in ENERGY STAR Portfolio Manager
STYLE AT ACQUISITION Value-Add
PROPERTY SECTOR / SIZE (SQFT) Industrial / 764,761
ACQUISITION DATE September 2018
SOURCE Competitive
LEVERAGE (%) Unlevered
OCCUPANCY (%) 100.0 / Multi-Tenant
WALT 10.0 Years
As of September 30, 2020.
For investment professionals only 38Barings Core Property Fund: Office
SECTOR OUTLOOK
TECH MARKETS FORECAST TO OUTPERFORM U.S. OCCUPANCY
Fundamentals Forecast
• National office vacancy increased 280 bps to 15%, still below the GFC peak 100 300
200
95
• Even with the softening in Q4, tech markets such as San Francisco and Austin
100
continue to report among the nation’s lowest vacancy rates 90
0
85 -100
Key Themes
-200
• In top tech markets, job growth and occupancy are forecast to outperform 80
-300
75
• Multi-cycle densification trend has been a headwind to absorption -400
70 -500
• Functional obsolescence will necessitate the repositioning of assets
2012
1990
1992
1994
1996
1998
2000
2002
2004
2006
2008
2010
2014
2016
2018
2020f
2022f
2024f
2020
Spread (bps) ( R)
Top Tech Markets Occupancy Rate (%) (L)
COVID-19 IMPLICATIONS U.S. Occupancy Rate (%) (L)
Short term: Moderate risk
• Leasing decisions will be delayed until the recovery is on a firm footing MOST FUND MARKETS CONTINUE TO OUTPERFORM
• Co-working likely to be hit hard as workers avoid shared space
700 18%
• Long-term lease contracts insulate owners over near-term 600 16%
14%
500
Long term: High risk 12%
400 10%
• Flexible working arrangements likely to continue office densification but pace 300 8%
expected to slow 6%
200
4%
100 2%
0 0%
TARGET MARKETS
• Austin • Orlando • Seattle
• Boston • Salt Lake City
• Los Angeles • San Francisco YTD Vacancy Change (bps, left) Current Quarter Vacancy (right)
Sources: Barings Real Estate Research, Moody’s Analytics, CBRE-EA Q4 2020.
For investment professionals only 39Barings Core Property Fund: Office Strategy
INVESTMENT STRATEGY
Maintain underweight exposure of high-quality CBD and CBD-adjacent properties
with live-work-play attributes
• Selectively pursue assets in technology and innovation metros with quantifiable
upside through leasing
• Identify and invest in densifying suburban nodes and master-plan
developments with superior connectivity to amenities, transit, and housing
• Reposition underutilized buildings to appeal to technology / creative users
PORTFOLIO POSITIONING
• 1.9M square feet of NRA; 78.2% CBD / 21.8% Suburban
• 87.3% leased
• 2.4% same-store NOI office growth in the last 12 months 33 NEW M ONTGOM ERY
SAN FRANCISCO, CALIFORNIA
• 4.7 year weighted average lease term
• Need for social distancing may reverse office densification trend
EXPOSURE
BCPF NFI-ODCE BCPF TACTICAL MID-
Q4 2020 Q4 2020 TARGET TERM POSITIONING
31.6% 32.9% 25.0% Underweight
HISTORICAL OFFICE ALLOCATION (%)
40
20
BCPF Office 2020 BOMA Pacific Southwest Region
NFI-ODCE Office TOBY Award Winner
0 801 SOUTH FIGUEROA
2012 2013 2014 2015 2016 2017 2018 2019 2020 LOS ANGELES, CALIFORNIA
As of December 31, 2020. Source: Barings Real Estate.
801 South Figueroa won 2020 BOMA Pacific Southwest Office “The Outstanding Building of the Year” Award in the 250,000-499,999 Sqft Category.
For investment professionals only 40Barings Core Property Fund: Office
811 BARTON SPRINGS
BCPF OFFICE ASSETS AUSTIN, TEXAS
Asset Name MSA SQFT Acquired
33 New Montgomery San Francisco, CA 241,727 2014
100 Wall Street New York - Northern NJ 515,463 2015
801 South Figueroa Los Angeles, CA 462,656 2014
811 Barton Springs Austin, TX 143,957 2014
Boca Office West Palm Beach, FL 362,184 2014
Chevy Chase Plaza Washington, DC 171,488 2004
District La Brea Office Los Angeles, CA 41,056 2016
TOTAL 1,938,531 OVERVIEW
A nine-story, LEED Gold certified, multi-tenant class A office building with superior
access to MoPac Parkway and Interstate 35
ASSET MANAGEMENT PLAN
• Renovate lobby and targeted common area upgrades
• ESG Initiative: LEED Gold certified in 2013 and recertified in 2018. LED light
fixtures upgraded in 2019 and will be included in upcoming lobby renovations
STYLE AT ACQUISITION Core
PROPERTY SECTOR / SIZE (SQFT) Office / 143,957
ACQUISITION DATE June 2014
SOURCE Competitive
LEVERAGE (%) Unlevered
OCCUPANCY (%) 100% / Multi-Tenant
WALT 4.0 Years
As of September 30, 2020.
For investment professionals only 41Barings Core Property Fund: Retail
SECTOR OUTLOOK
DEFENSIVE GROCERY STORE SALES
Fundamentals
8.0%
Hundreds
• Q4 data indicates the national retail availability rate increased 80 bps year-over-
year and remained unchanged on a QoQ basis. 6.0%
• Mandated closures have threatened the viability of certain retail formats 4.0%
2.0%
• Neighborhood & community centers have performed better than other formats
0.0%
Key Themes
-2.0%
• Grocery stores and other essential retail will continue to outperform
-4.0%
• Online grocery shopping will continue to increase, but is unlikely to replace
grocery shopping at “brick-and-mortar” centers in strong trade areas -6.0%
2020
2009
2000
2001
2002
2003
2004
2005
2006
2007
2008
2010
2011
2012
2013
2014
2015
2016
2017
2018
2019
GDP Growth Core Retail Sales Grocery Store Sales
COVID-19 IMPLICATIONS
Short term: Moderate risk
• Grocery stores and other essential retail will continue to outperform, albeit with a CONSUMERS FOCUS ON ESSENTIALS AND E-COMMERCE
higher percent of those sales going online
40%
Long term: High risk
20%
•
YoY Growth (%)
Continued disruption may accelerate e-commerce adoption among some cohorts
0%
• Physical stores build capabilities to fulfill online and in-store orders
-20%
-40%
-60%
TARGET MARKETS -80%
Nonessential Essential Nonstore
Premier trade areas in top 20 metros supported by strong demographics
March April May June July
August September October November December
Sources: Barings Real Estate Research, U.S. Census Bureau (BOC), Moody’s Analytics.
For investment professionals only 42Barings Core Property Fund: Retail Strategy
INVESTMENT STRATEGY
Achieve underweight exposure while continuing to focus on necessity-based,
primarily grocer-anchored assets in dominant trade areas
• Target supply-constrained locations with durable population and income growth
• “Main Street” urban retail and mixed-use assets in urbanizing locations
• Select re-development / repositioning opportunities in proven retail nodes
PORTFOLIO POSITIONING
• 1.1M square feet of net rentable area located in attractive trade areas
• 58.1% of the portfolio is grocer-anchored
• 91.9% leased
LAKESIDE VILLAGE CENTER
• 5.1 year weighted average lease term W INDERMERE, FLORIDA – ORLANDO MSA
• 40% of retail revenue is from Food and Grocery tenants
EXPOSURE
BCPF NFI-ODCE BCPF TACTICAL MID-
Q4 2020 Q4 2020 TARGET TERM POSITIONING
15.5% 14.2% 15.0% Underweight
HISTORICAL RETAIL ALLOCATION (%)
40
BCPF Retail
NFI-ODCE Retail
20
TORRANCE CROSSROADS
0 TORRANCE, CALIFORNIA – LOS ANGELES MSA
2012 2013 2014 2015 2016 2017 2018 2019 2020
As of December 31, 2020. Source: Barings Real Estate.
For investment professionals only 43Barings Core Property Fund: Retail Portfolio
PORTFOLIO CHARACTERISTICS
NEIGHBORHOOD & COMMUNITY FOCUSED ON STRONG OCCUPANCY CONSISTENT
CENTER RESILIENCE DAILY NEEDS RETAIL AND LEASING OUTPERFORMANCE
• Retail real estate is constantly evolving • BCPF is exclusively focused on • BCPF’s portfolio is 92% leased • BCPF outperformed the NPI-ODCE’s
to accommodate consumer preferences neighborhood and community centers, retail over the 1-year, 3-year, 5-year,
with no mall or power center exposure • All of the grocer anchors have 7-year, 10-year, and since BCPF
• Consumers have consistently relied on remained open since the start of the inception time periods on an
neighborhood & community centers to • 58% of the portfolio by square feet is COVID-19 pandemic unleveraged, property-level basis
satisfy their daily needs grocer-anchored
• 5.1 years of weighted-average • The portfolio outperforms even when
• The neighborhood & community center • Food & Grocery comprises 40% of the remaining lease term with only 7.1% compared strictly to NFI-ODCE
subsector has had the largest decrease Fund’s retail revenue while Soft Goods leases rolling in 2021 neighborhood and community centers
in availability rates since the GFC are only 14% of revenue within the NPI database
BCPF 3-MILE
ALLOCATION RADIUS HH
RETAIL ASSET METRO (%) INCOME ($K)
1 Promenade at Town Center Los Angeles 2.8 113.4
8 2 Torrance Crossroads Los Angeles 2.8 86.0
3
3 Renaissance Creek Sacramento 2.5 98.2
6
4 Boca Center W. Palm Beach 1.7 71.3
1 5 District La Brea Los Angeles 1.6 58.3
5 2
6 University Park Denver 1.3 119.3
5 7 Weston Road Shopping Center Miami-Ft. Laud. 1.0 116.6
9 8 Village at Cambridge Crossing Philadelphia 0.9 102.4
4
7 9 Lakeside Village Center Orlando 0.9 93.4
As of December 31, 2020.
100% of BCPF’s valuations are reviewed and acknowledged by the Altus Group.
Source: ESRI 2019.
For investment professionals only 44Barings Core Property Fund: Retail
UNIVERSITY PARK
BCPF RETAIL ASSETS HIGHLANDS RANCH, COLORADO – DENVER MSA
Asset Name MSA SQFT Acquired
Boca Retail West Palm Beach, FL 116,295 2014
District La Brea Retail Los Angeles, CA 40,770 2016
Lakeside Village Center Orlando, FL 74,964 2013
Promenade at Town Center Los Angeles, CA 181,677 2004
Renaissance Creek Sacramento, CA 179,150 2004
Torrance Crossroads Los Angeles, CA 175,118 2015
University Park Denver, CO 88,618 2007
Village at Cambridge Crossing Philadelphia, PA 127,987 2014 OVERVIEW
Grocery-anchored, neighborhood shopping center located in an affluent, master-
Weston Road Shopping Center Miami-Ft Lauderdale, FL 106,118 2014 planned suburb in Denver
ASSET MANAGEMENT PLAN
TOTAL 1,090,697 • Retain existing tenants at high market rents
• ESG Initiative: Upgraded exterior lighting with LED fixtures, implemented
Trash Recycling program and installed efficient landscape irrigation system
STYLE AT ACQUISITION Core
PROPERTY SECTOR / SIZE (SQFT) Retail / 88,618
ACQUISITION DATE December 2007
SOURCE Competitive
LEVERAGE (%) Unlevered
OCCUPANCY (%) 97.5 / Multi-Tenant
WALT 3.0 Years
As of September 30, 2020.
For investment professionals only 45You can also read