Barking Town Centre Retail Study Update 2012 - February 2012
←
→
Page content transcription
If your browser does not render page correctly, please read the page content below
Barking Town Centre

Retail Study Update 2012

February 2012
Barking Town Centre – Retail Study Update - February 2012

Contents
1        Introduction ............................................................................................................................................................ 2
2        Barking Town Centre – Vitality & Viability Update.............................................................................................. 3
3        Updated Retail Capacity Analysis ...................................................................................................................... 12
4        Retail Audit ........................................................................................................................................................... 22
5        Conclusions ......................................................................................................................................................... 36

Appendix 1 – Study Area Plan
Appendix 2 – Economic Analysis
Appendix 3 – GOAD Town Centre Report

COPYRIGHT © JONES LANG LASALLE IP, INC. 2012. All Rights Reserved                                                                                                                      1
Barking Town Centre – Retail Study Update - February 2012
1 Introduction
1.1 In 2009, Jones Lang LaSalle, then King Sturge, was commissioned by the London Thames Gateway
Development Corporation (LTGDC), in partnership with the London Borough of Barking and Dagenham (LBBD)
to update the Retail and Leisure Capacity Study (RLCS) originally prepared by CB Richard Ellis (CBRE) for
Barking Town Centre in 2004.
1.2 This involved the preparation of a „heath check‟ and retail audit for Barking Town Centre which assessed its
vitality and viability and the preparation of a retail capacity analysis. The Study concludes by setting out the key
issues affecting the centre.
1.3 Since 2009 a number of changes have taken place and it is considered necessary to review the previous Study
and assess the implications of change on our conclusions. Since the last update PPS4 has replaced PPS6 and
the Council has adopted several Development Plan Documents. These comprise the:
The Core Strategy, adopted July 2010
The Site Specific Allocations, adopted December 2010
The Borough Wide Development Policies DPD, adopted March 2011
The Barking Town Centre Area Action Plan DPD, adopted February 2011
1.4 The Assessment updates the earlier Study prepared by King Sturge. Specifically it sets out to assist the Council
in the implementation of the Barking Town Centre Area Action plan by understanding current and future retail
needs of Barking Town Centre. This information will also be at the Council‟s disposal to assist in the
determination of relevant planning applications. In particular, the Council is currently considering a planning
application for the redevelopment of the London Road/North Street site for a foodstore (8,013m2 (GIA)) and six
ancillary retail units within use classes A1, A2, A3 and/or B1 totalling 543 m2 (GIA);
1.5 Our work draws on the results of the original 2004 household survey (1,502 households) and other empirical
evidence that has been supplied to the Council to support planning applications.
1.6 This Update comprehensively updates the earlier 2009 Study, in relation to the need for additional convenience
and comparison floorspace within Barking Town Centre. The analysis is considered in the context of current
Government Guidance, contained within PPS4 and the Barking and Dagenham Local Development Framework.
Structure
1.7 The Study is presented under the following section headings:
Barking Town Centre – a Vitality and Viability Update (Section 2);
Retail Capacity Analysis Update (Section 3);
Retail Audit (Section 4); and
Conclusions (Section 5).
1.8 The Study has been prepared in consultation with Officers at LBBD.
COPYRIGHT © JONES LANG LASALLE IP, INC. 2012. All Rights Reserved 2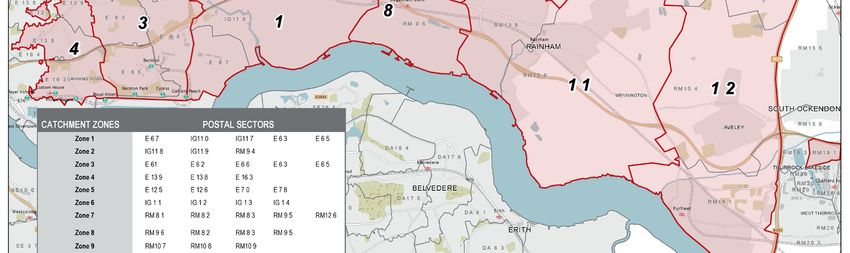
Barking Town Centre – Retail Study Update - February 2012
2 Barking Town Centre – Vitality & Viability Update
2.1 Barking town centre is defined as a “Major Town Centre” in the regional shopping hierarchy and is the largest
town centre in the Borough. It has a range of national multiple retailers alongside a strong independent offer,
resulting in a predominantly convenience goods destination. The town centre benefits from excellent public
transport links.
2.2 An assessment of Vitality and Viability of Barking Town Centre has been undertaken, using appropriate indicators
outlined in paragraph Annex D of PPS4. Both on-the-ground and other data sources have been used, and
reference is also made to the Town Centre Report undertaken by Experian Goad (September 2011) which is
attached at Appendix 3.
2.3 The indicators used in this Vitality and Viability Assessment are:
Diversity of Uses/Retailer Representation (including retailer requirements)
Retail/Leisure floorspace in Edge-of –Centre and Out-of-Centre
Proportion of Vacant Street Level Property
Growth Capacity
Shopping Rents
Commercial Yields on Non-Domestic Property, and
Accessibility
Pedestrian Flows
2.4 Together these indicators provide a framework for measuring and comparing the vitality, attractiveness and
viability of town centres.
Diversity of Uses
2.5 Barking Town Centre contains 260 retail outlets, totalling 51,697m² (gross) (Goad and Jones Lang LaSalle).
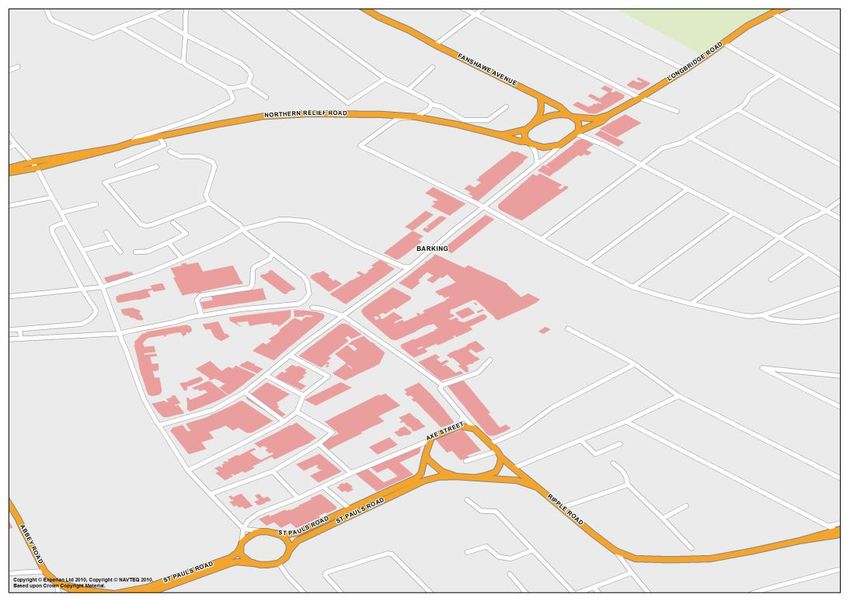
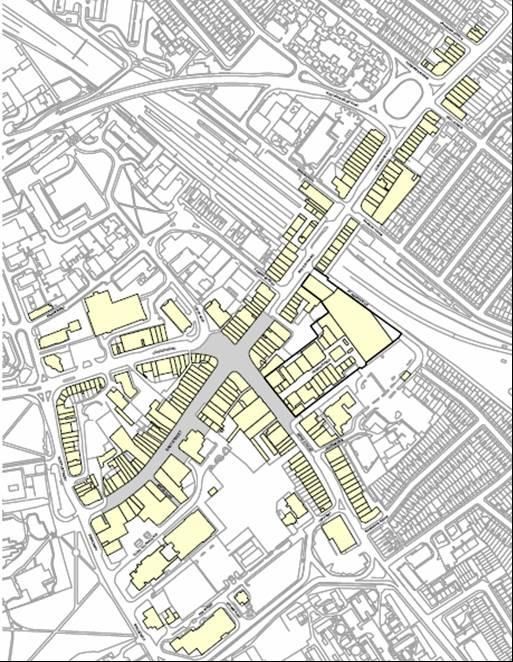
2.6 The main retail areas, within the Town Centre, include Vicarage Fields, East Street, Ripple Road and an area
around Barking Station, known as the “Station Quarter”. Furthermore, there is now the redeveloped Town
Square, which contains several retail units and a library.
2.7 The Vicarage Fields Shopping Centre provides a significant part of the centres modern retail floorspace and
accommodates a modest Asda supermarket (1,765m² net) which is a primary anchor for the both Vicarage Fields
and Barking Town Centre as a whole. Vicarage Fields is accessed from Station Parade and Ripple Road and
provides two floors of retail accommodation linked by an atrium. The lower level of the shopping centre, which is
accessed from Ripple Road, trades more successfully than the upper floor, which is accessed from Station
Parade.
2.8 Experian Goad‟s Town Centre Reports for Barking Town Centre in 2004 and March 2008 show the retail
composition of the centre. An Experian Goad survey of September 2011 has been updated by Jones Lang
LaSalle to provide the retail composition in February 2012.
COPYRIGHT © JONES LANG LASALLE IP, INC. 2012. All Rights Reserved 3Barking Town Centre – Retail Study Update - February 2012
Table 1 – Change in Retail and Service provision for Barking Town Centre 2004 - 2012
Unit Type Number of Percentage Number Percentage Number Percentage % Change % Change
Units 2012 (%) 2012 of Units (%) 2008 of Units (%) 2004 2004 - 2008 -
2008 2004 2008 2012
Convenience 28 11 31 12 26 10 +2% -1%
Comparison 90 35 110 41 121 45.4 -4.4% -6%
Services (1) 90 35 103 38 98 38.1 -0.1% -3%
Vacant & Misc 51 19 24 9 15 6.5 +2.5% +10%
Total: 260 100 268 100 260 100 - -
Source: Jones Lang LaSalle, Goad
(1) Goad defines Service sector as uses that fall into Classes A2 - A5
Table 2 – Retail and Service provision in Barking Town Centre by Experian Goad Floorspace (Gross)
Unit Type Floorspace % of Floorspace % of Total Floorspace % of Total % Change % Change
(m²) 2012 Total (m²) 2008 2008 (m²) 2004 2004 2004 -2008 2008 -2012
2012
Convenience 9,160 18 8,900 20 8,082 17 +3% -2%
Comparison 17,781 34 20,374 45 22,381 48 -3% -11%
Services (1) 17,697 34 13,220 29 13,310 29 0% +5%
Vacant & Misc 7,059 14 3,084 7 2,771 6 +1% +7%
Total: 51,697 100 45,578 100 46,544 100 - -
Source: Jones Lang LaSalle, Goad
(1) Goad defines Service sector as uses that fall into Classes A2 - A5
2.9 The convenience sector is in line with the UK average, supplying a variety of stores. In particular there is
significant competition and choice between both national multiples and independent retailers with respect to
groceries. Conversely, compared to the UK average Bakers and Fishmongers are under-supplied within the
centre.
2.10 In terms of the comparison sector there has been a continual and substantial decrease in supply from 2004 to
2012, and therefore is below the UK national average.
2.11 In the service sector the provision of restaurants, cafes and fast food is over supplied. However, it should be
noted that this provision almost entirely comprises of cafés and fast food outlets. Therefore, it is advisable that the
provision of restaurants within the town centre is encouraged to promote a night time economy.
Retail/Leisure Floorspace in Edge-Of-Centre and Out-Of-Centre
2.12 On the other side of Abbey Park to the west of the core town centre is the Abbey Retail Park. It has a floor area of
11,241m² and accommodates tenants such as Carpetright, Comet, Focus, Halfords, Harveys and MFI. Next to
the retail park on the other side of the river bordering The North Circular and London Road is a Tesco store.
Adjacent to Abbey Retail Park along Abbey Road is a Dreams store.
2.13 There is also Barking Retail Park located to the North of Abbey Retail Park along Hertford Road which contains a
Wicks Extra store of 5,323m².
Retailer Representation
2.14 Barking Town Centre contains a number of national multiple retailers. In January 2004, 93 of the total outlets
were occupied by multiple retailers (34.96%) and in March 2008 this figure increased to 95 (35.45%). However, in
2012 this figure decreased to 81 multiple retailers (30%). The provision of multiple retailers is considerably lower
compared to the overall UK average (59.19%).
COPYRIGHT © JONES LANG LASALLE IP, INC. 2012. All Rights Reserved 4Barking Town Centre – Retail Study Update - February 2012
2.15 In the convenience sector, national multiple retailers that are currently represented include Asda, with a net
floorspace of 1,765m² located in Vicarage Fields, Lidl comprising of 722m² (net) on Ripple Road, and Iceland of
527m² (net) located on East Street. There is also now two Tesco Express stores which have opened, one fronting
onto Ripple Road and the newly regenerated Town Square, comprising 420m² (net), and the other is on corner of
Fanshawe Avenue and Longbridge Road, comprising of 310m² (net).
2.16 A street market also takes place every Tuesday, Thursday and Saturday spanning East Street, the
pedestrianized section of Ripple Road and part of Station Parade. Occasional specialty markets also take place
in this area. The market sells a mixture of produce from food and non-food goods including ethnic and fresh
produce, clothing, household and other comparison goods.
2.17 Experian Goad highlight 31 key attractors as a benchmark against which to assess the relative strength of town
centres. Barking has twelve of these retailers identified in the table below.
Major Retailer No. in Major Retailer No. in
Barking Barking
Argos 1 Next 0
Bhs 0 O2 1
Boots the Chemist 1 Phones 4 U 1
Burton 1 Primark 0
Carphone Warehouse 1 River Island 0
Clarks 0 Sainsbury‟s 0
Clintons 1 Superdrug 1
Debenhams 0 T K Maxx 0
Dorothy Perkins 1 Tesco 2
H&M 0 Topman 0
HMV 0 Topshop 0
House of Fraser 0 Vodafone 1
John Lewis 0 Waitrose 0
Marks & Spencer 0 Waterstones 0
New Look 1 WHSmith 2
Wilkinsons 1
Source: Jones Lang LaSalle, Experian Goad
2.18 As noted in previous retail assessments Barking Town Centre does not contain a department store. This remains
the case. Stores such as Marks & Spencer and Debenhams are clearly absent from the retail offer of Barking.
Retailer Requirements
2.19 As set out in this report, a comprehensive Retail Audit was undertaken by Jones Lang LaSalle in February 2012,
sits alongside this analysis and critically reviews the existing retail offer and identifies operations that trade in the
benchmark centres but are currently absent from Barking and form a „gap‟ in the retail offer.
2.20 Of the 32 gap comparison goods retailers identified in the Audit, clothing and footwear retailers are the most
apparent. There a number of general clothing gaps at the upper mass-market level i.e., Next, Clarkes, Topshop,
and Monsoon. Another significant sector that appears to have significant gaps is the value market; retailer gaps
include Krisp, QS, Poundstretcher, Rosbeys, Card Fair, M &Co and Priceless.
2.21 Most of the comparison gap retailers identified are small/medium space occupiers, with the notable exception
being Marks & Spencer, as previously noted.
2.22 The non-comparison goods retailer gap includes retailers such as Sainsbury‟s, Waitrose, and Co-operative Food.
However, Sainsbury‟s do operate a store on the outskirts of Barking.
COPYRIGHT © JONES LANG LASALLE IP, INC. 2012. All Rights Reserved 5Barking Town Centre – Retail Study Update - February 2012
2.23 The Retailer Requirements database compiled by Focus shows registered demand from a mix of retailer and
quasi retail uses. Below are the retailer requirements for Barking Town Centre:
Retailer Requirements
Talarius PR Books Ltd
Peacocks Beaumont Beds
Gym 24 Limited Fonehouse Group Ltd
Traid Matalan Retail Ltd
Café Nero
Source: Jones Lang LaSalle, Focus
Growth Capacity
2.24 In accordance with PPS4, in order for Town Centres to improve it is important to assess the Town Centres
potential capacity for growth or change of centres in the network: opportunities for centres to expand or
consolidate. This is typically measured in the amount of land available for new or more intensive forms of town
centre development.
2.25 Barking Town Centre Area Action Plan (BTCAAP) was adopted in February 2011, the BTCAAP identifies sites
that can accommodate new retail development within the Town Centre boundary. Below are four sites that were
identified by the BTCAAP:
Referred to as BTCSSA1 within the BTCAAP, this site is located west of the town centre and is bounded
by London Road, East Street and North Street. The site is 1.3 hectares and is allocated to accommodate a
large non-food store (4,500 m²), other retail units, a square and new housing.
This site is currently the subject of an application which includes a new foodstore and ancillary retail units.
Referred to as BTCSSA10 within the BTCAAP, this site is located within the Vicarage Field Shopping
Centre bordering Ripple Road and Station Parade.
The site is allocated to provide 2,500m² of retail floorspace. In particular the site seeks to accommodate
larger shop units to attract the higher end retailers. For reference in December 2009 planning permission
was granted for 1,333²m of retail floorspace, services, restaurants and cafes (Classes A1, A2 and A3).
The retail element of the scheme was in response to attract multiple retailers who require large modern
units.
Referred to as BTCSSA3 within the BTCAAP, the site is in the north east of the Town Centre and includes
Barking Rail Station.
The site is 7.9 hectares in area and is allocated to accommodate 7,000m² of shopping units, in
combination with residential and commercial uses. The policy states that there would also be capacity to
accommodate leisure and evening economy uses such as a small cinema or a bowling alley.
Referred to as BTCSSA5 within the BTCAAP, the site is in the southern part of the town centre, bounded
to the south by St Pauls Road.
The site is 0.85 hectares and has capacity to accommodate mixed used development comprising of
commercial and leisure uses such as a cinema, new homes and a multi-storey town centre car park.
COPYRIGHT © JONES LANG LASALLE IP, INC. 2012. All Rights Reserved 6Barking Town Centre – Retail Study Update - February 2012
2.26 The above-mentioned allocations demonstrate that there is the ability to provide retail floorspace that would meet
Barking Town Centres current requirements. In particular it would allow the centre to provide a range of larger
retail units to accommodate multiple retailers that are not currently provided in Barking.
Vacant Retail Property
2.27 The proportion of vacant street level property provides a strong indication of the health of the town centre.
However, it should be considered with a degree of caution as vacancies can arise even in the strongest town
centres, particularly where properties are undergoing alteration, such as areas within the Town Square which
have just been completed.
2.28 In January 2008 Barking Town Centre had 24 vacant outlets, which accounts for 9% of the total retail units in the
centre. However, in September 2011 (Goad) the number of vacant units was 43, 16.17% of the total units in the
centre. This is above the national average of 13.65%. The recent review of vacant retail floorspace within the
town centre on February 2012 demonstrates that this situation has not improved, with 51 vacant outlets,
accounting for 19.6% of total units in the centre. This figure is again considerably above the national average of
13.65%.
2.29 The majority of vacant properties are however located along North Street and London Road and most of these
units, which number 22 (total 1,543m²), are earmarked for demolition to make way for a proposed retail-led mixed
use development. The units to be demolished are small, in poor condition and located on the periphery of the
centre. This area currently has low footfall and few of the units meet modern retailer requirements. When these
units are demolished the number of vacant units within the Town Centre will be reduced from 51 to 29. This
reduction takes into account the units identified within the site specific allocation (referenced BTCSSA1) along
North Street and London Road. Taking account of the new vacant unit number and the total retail unit number the
percentage of vacant space in Barking Town Centre is 12.18%, which would be below the national average.
2.30 Within the town centre there are other larger vacant units, such as in the recently regenerated Town Square. We
can expect this modern and well located floorspace to be occupied in the near future.
2.31 In conclusion the number of vacant units is not a true representation of the health of Barking Town Centre
because the many of vacant units are earmarked for demolition to enable the next stage of the centres
regeneration. The retail core of the centre, such as, East Street and Vicarage Field have few vacancies and this
area presents a better measure of the health of the centre.
Shop Rents
2.32 The level of rent which retailers are prepared to pay for retail space within a centre is an indication of the
perceived attractiveness of that centre.
2.33 The following table identifies the Prime Zone A rental values achieved in Barking Town Centre between 1993 and
2011 (the most recent figures available). Prime Zone A rental levels in Barking are currently £50 per sq² along
East Street and £60 per ft² in Vicarage Field. From the observation of Table 4 it is clear that the increase in rental
values has fluctuated, with a peak of £80ft² in 2007. Over recent years the rents have dropped from the 2007
peak to around £50 - £60ft².
COPYRIGHT © JONES LANG LASALLE IP, INC. 2012. All Rights Reserved 7Barking Town Centre – Retail Study Update - February 2012
Table 4 – Comparison of Prime Zone A Rental Values (£ per sq ft)
Town Street 1993 1995 1997 1999 2001 2003 2005 2007 2009 2011
Barking East Street 35 35 30 30 35 42.5 45 50 45 50
Barking Vicarage Field 35 35 35 40 40 60 70 80 50 60
Ilford High Road 80 80 90 140 140 135 140 140 100 140
Romford Liberty 110 115 125 180 180 185 185 220 230 225
Romford South Street 95 70 70 80 80 90 100 120 110 80
Romford Market Place 65 60 55 60 60 70 80 80 70 60
Source: Jones Lang LaSalle
2.34 For comparison we have benchmarked Barking against other nearby centres, and as you would expect, Prime
Zone A rental values are well below those in Ilford and Romford, as they are higher up in the retail hierarchy.
Over the same 11 year period from 2000-2011 Prime Zone A rental values have fluctuated in Ilford with the rental
value being the same in 2011 as 2000. However, within Romford along Liberty Street there has been a steady
increase of 73% from 2000-2011 in rental values. This is illustrated in the graph below (Source: Table 4 above)
Chart 1 – Comparison of Prime Zone A Rental Values (£ per sq ft)
2.35 This is helpful for comparison purposes and demonstrates that Barking sits beneath other centres in the local
shopping hierarchy. This is evident as Barking is classified as „Major‟ town centre and Ilford and Romford are
classified as „Metropolitan‟ town centres.
Commercial Yields
2.36 The following table shows prime shop property investment yields in Barking from 1998 - 2008. The yield on
property investment represents the return on capital to the investor. Yields are therefore an indicator of
expectations of rental growth and of general economic prospects for the town.
2.37 The table below does not show yields from 2009 – 2012 as the Valuation Office has ceased producing yield data,
therefore we have sourced yield data for 2012 from current retail investment transactions within Barking Town
Centre. From analysis of the recent retail property sales within Barking Town Centre the yield is generally
between 5% – 11% (Source; Essential Information Group), depending on the location of the unit. Generally if the
COPYRIGHT © JONES LANG LASALLE IP, INC. 2012. All Rights Reserved 8Barking Town Centre – Retail Study Update - February 2012
property is located along East Street or Station Parade, and therefore in a prime location, the yield is about 5.5%.
Those properties located along Ripple Road, London Road and North Street generally, depending in location and
quality, have a yield of between 7% - 11%.
2.38 From the analysis of the below table and recent data, prime retail yields have been improving since 1998 with the
prime shopping areas demonstrating the most improvement.
Table 5 – Prime Shop Property Investment Yields (%)
1998 1999 2000 2001 2002 2003 2005 2006 2007 2008 2012
8.75 8.75 8.75 8.75 8.25 8 6 5.5 6 6.5 5 .5*
Source: Valuation Office Agency & Essential Information Group
* Estimate of prime shop property investment yields from recent retail transaction
Pedestrian Flows
2.39 Pedestrian flows are a key indicator of the vitality of shopping streets, the higher the pedestrian flow the more
opportunity there is to attract people into shops, restaurants and other facilities. Pedestrian flows are also a key
indicator of which areas in the centre need improving in order to increase that footfall.
2.40 As noted above, Barking Town Centre‟s main shopping area is based along East Street, Station Parade,
Longbridge Road, with other shopping streets such as, Ripple Road, London Road and North Street. Along
Ripple Road and Station Parade is the Vicarage Shopping Centre. Around the shopping centre along the western
end of East Street and part of Ripple Road the area is pedestrianised. This pedestrianised car-free area tends to
attract the greatest proportions of shoppers and visitors.
2.41 Along the pedestrianised street is where the majority of multiple retailers and larger stores are located including,
Argos, Wilkinsons, Iceland, Peacocks Clothing, Boots, Superdrug, New Look and Dorothy Perkins.
2.42 On Tuesdays, Thursdays and Saturdays the market located along East Street and Ripple Road adds a significant
boost to the Town Centres activity and footfall.
2.43 Along North Street and London Road pedestrian footfall is substantially lower. This is particularly evident along
North Street where there is little pedestrian movement due to the majority of retail units being vacant. Further up
London Road towards the centre there is more pedestrian activity but this is mainly attributed to town centre
access from buses along this road and the nearby London Road.
Accessibility
2.44 In accordance with PPS4 accessibility allows for an ease and convenience of access by a choice of means of
travel into a town centre. The higher the accessibility of a town centre the increased attraction the town centre
has.
2.45 Barking Town Centre has a Public Transport Accessibility Level (PTAL) of 6, the highest rating given. The Town
Centre benefits form a good range of transport including the London Underground (District and Hammersmith and
City Line), overland rail links and 10 bus routes into Central London and surrounding East End destinations.
Barking Town Centre is well connected via road links, located off the A406 North Circular, which allows easy
access to the M25 via the A12 and A13.
COPYRIGHT © JONES LANG LASALLE IP, INC. 2012. All Rights Reserved 9Barking Town Centre – Retail Study Update - February 2012
2.46 Throughout the centre various opportunities for car parking is available. These include:
London Road Multi-storey 650 spaces
Asda Car Park, Station Parade 330 spaces
Vicarage Field Car Park 200 spaces
Axe Street Car Park (north) 100 spaces
Axe Street Car Park (south) 100 spaces
Lidi Car Park 7 spaces
North Street Car Park 40 spaces
2.47 In terms of cycle accessibility and facilities, the town centre is linked into an extensive network of cycle paths and
routes. Currently there are 2 kilometres of cycle paths in and around the town centre. There is a shortage of
secure and covered cycle parking facilities within the town centre, particularly at Barking Station.
2.48 It should be noted that Barking has benefit from the East London Transit Link, which has connected Ilford and
Barking Town Centre to the new development at Barking Riverside and to Dagenham Dock.
Environmental Quality
2.49 With a fully integrated and linked CCTV coverage, the Town Centre is considered to be a safe and comfortable
shopping environment.
2.50 An example of improvement in environmental quality is the redevelopment of the Town Square. The development
includes residential units, a library, and an education and skills centre has provided a striking iconic new building
within the street scene and the hard landscaping and street furniture associated with this development is of a very
high quality.
2.51 Currently around Barking Station there are numerous improvements happening to the streetscape. Once these
improvements are finished it will add significantly to the quality of the environment in the Town Centre and the
surrounding area of Barking Station.
Conclusions
2.52 Barking Town Centre has below national average representation of comparison goods retailers, which has
decreased considerably between 2008 and 2012. However, the Town Centre has the national average for
representation of convenience goods.
2.53 As demonstrated above the centre has experienced a decrease in the number of comparison, convenience and
service units over the previous four years since the Retail Study was carried out by Experian Goad in 2008.
2.54 Barking Town Centre is a centre that caters for local needs, predominantly catering towards the convenience
sector, with other retailers attracted to more prominent centres nearby. The comparison sector is poorly
represented, which is mainly due to the lack of large retail units available.
2.55 The role of the centre has been slowly changing as it is not able to compete with centres nearby that continue to
attract multiple retailers. Over the years large nearby centres have been improving their competitive position.
However, Barking has been slow to respond finding it difficult to attract these multiple retailers, locating in other
centres such as Ilford and Romford.
COPYRIGHT © JONES LANG LASALLE IP, INC. 2012. All Rights Reserved 10Barking Town Centre – Retail Study Update - February 2012
2.56 The ability for Barking to improve its retail offer, in particular the comparison sector, lies in the sites proposed by
the council coming forward and providing larger retail space for multiple retailers to move in. Public and private
investment in the centre is currently underway so it is important that development land is brought forward as they
will enable a significant improvement to the vitality and viability of the centre and capitalise on the improvements
to date.
2.57 There is undoubtedly scope for Barking to consolidate and improve its retail position within the retail hierarchy.
Given the recent investment and the growth capacity the Town Centre exhibits there is potential to enable growth
in the areas referred to.
COPYRIGHT © JONES LANG LASALLE IP, INC. 2012. All Rights Reserved 11Barking Town Centre – Retail Study Update - February 2012
3 Updated Retail Capacity Analysis
3.1 Recent changes to the retail composition of Barking Town Centre‟s catchment and economic circumstances have
led to the need for a further review of the assessment of need for new floorspace in Barking. In this section we set
out the findings of our Update, and forecast the need for further convenience and comparison retail floorspace to
the period 2020.
3.2 It is important to note that this assessment uses the 2004 household shopper survey as an empirical evidence
base to underpin this Update. Although, Jones Lang La Salle has sought to compensate for the age of the data it
is inevitable that there is will be a margin of error. The same issue arises when forecasting over lengthy time
periods. Therefore, the Council should review these forecasts at appropriate times throughout the LDF period,
generally no longer than five year intervals. Nevertheless, long term forecasting provides a good indication of the
broad levels of growth expected between 2012 and 2017, based on current research and evidence.
3.3 The following assessment of quantitative need, which should be read in conjunction with the tables in Appendix 2,
is based on a step-by-step approach, assessing the existing and projected available spending by residents of a
defined catchment area, and comparing the expenditure potential with an estimate of turnover provision within
Barking Town Centre. The approach follows that adopted in the CBRE Study as a starting point, but it has been
comprehensively updated to take account of more recent information including. In updating the Study, we have
also had regard to other shopper survey results and background data contained in a Retail Assessment
undertaken by G L Hearn in October 2008 to support a planning application for an extension to the Tesco store
on London Road, Barking. We have also had reference to recent planning applications by Land Securities on
Whalebone Lane South and the Sanofi site, both of which are promoting foodstores located in Dagenham.
3.4 The analysis separately assesses the needs for convenience and comparison goods floorspace.
3.5 The main steps are:
Definition of a study period;
Definition of a catchment area;
Estimation of existing and future population;
Estimation of spending on convenience and comparison goods, as existing and in the future;
Estimation of expenditure attracted to Barking Town Centre, based on an earlier household survey
(2004);
Derivation of “benchmark” turnovers;
Estimation of expenditure attracted to Barking Town Centre, following the implementation of retail
floorspace proposals either within or beyond the catchment area, and
Conclusions on the quantitative need for further convenience and comparison goods shop floorspace.
Catchment Area
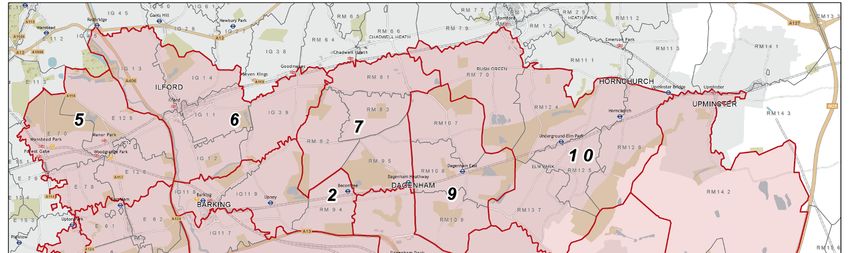
3.6 The catchment area is shown on the map in Appendix 1. We have adopted the same catchment area and sub-
division into zones as the earlier 2004 and 2009 Studies. This catchment area provides the basis for the 2004
shopper survey, which the Council considers, despite its age, remains suitably reliable for its requirements and
purposes of updating the Retail Capacity Analysis to 2020. Whilst there have been changes in retail provision in
the catchment area since it was undertaken, these can be understood and having analysed the more recent
shopper survey undertaken by G L Hearn in March 2007 and others (albeit based on a different catchment areas
and study zones), we consider the results are, subject to a margin for error, consistent. The adopted catchment
COPYRIGHT © JONES LANG LASALLE IP, INC. 2012. All Rights Reserved 12Barking Town Centre – Retail Study Update - February 2012
area is extensive, which reflects the earlier scope of the RLCS which included an assessment for other towns
within LBBD – Dagenham and Rainham.
3.7 Nevertheless, the shopper survey results enable information to be derived on the market share of Barking (and
other town centres within the Borough). Therefore, whilst the defined catchment area extends beyond that area
where Barking has the greatest influence, the shopper survey results enable estimates to be made on the current
market share of Barking Town Centre. By adopting this approach, it also enables comparisons to be made with
the earlier 2004 and 2009 studies.
3.8 Whilst the delineation of the catchment area does not necessarily affect the findings of a Retail Assessment,
assumptions made about the inflows and outflows of spending to the catchment area can have significant effects.
In updating the Retail Study, we have assessed the likely effects of planned retail proposals within and beyond
the catchment area, and how this might affect market shares in the future.
Population
3.9 Population change is one of the underlying drivers of changes in consumer retail demand. Population and
projections therefore provide a valuable insight into projected future demand within local areas.
3.10 We have revised and updated population data included in the 2009 Study on the basis of more up-to-date
information that is now available. Estimates of the catchment area‟s zone based populations at 2012 to 2020 are
provided by Experian, who provide population and projections from the year 2011.
3.11 Experian‟s demographic model uses 2011 mid-year age and gender estimates as a base and then projects these
forward year-on-year until the final year is reached (in this case, 2020).
3.12 We have also added to the trend-based population forecast figures, our own assessment of the likely growth in
population which will result from expected housing growth. This is based on information provided by the LBBD
and includes proposals for new housing development in Zone 2.
3.13 We accept that there may be an element of „double counting‟, but suggest that the use of these locally generated
figures is robust as these represent actual planned future developments, whereas Experian undertake their
forecasts at a macro level, and do not take account of significant housing allocations in a particular area, that will
have the effect of concentrating population growth.
3.14 The relevant figures for the catchment and its zones are presented in Table 1 of Appendix 2. The tables indicate
that at the base year of 2011, the study period has a population of 481,529. It is projected that this will rise to
493,370 in 2016 and to 507,083 in 2020.
3.15 This represents a growth in population in the period 2011 – 2020 of 25,554, representing an increase of 5.3%.
Expenditure
3.16 We have used local expenditure estimates for LBBD area provided by Experian and compared them against the
GLA Retail Study, 2009.
3.17 Per capita retail expenditure estimates in 2012 for the catchment area £1,615 per capita for convenience goods
and £2,248 per capita for comparison goods. These are the most up to date information available from Experian.
COPYRIGHT © JONES LANG LASALLE IP, INC. 2012. All Rights Reserved 13Barking Town Centre – Retail Study Update - February 2012
3.18 The figures quoted in the RLCS were at 2001 price level, but these have been updated. The 2009 Study used
2003 prices. This Study uses 2009 prices.
3.19 The 2012 per capital retail expenditure estimates have been adjusted and projected forward to take account of:
Deductions for Special Forms of Trading (SFT);
Annual growth rates.
3.20 Further explanations of these assumptions are set out below.
Special Forms of Trading
3.21 A significant factor in the estimation of retail capacity relates to the assumption relating to “Special Forms of
Trading” (SFT), representing retail spending which does not take place in shops, by, for example, mail order, and
the internet. Per capita spending figures are reduced by SFT percentages, usually on the basis of national
average rates.
3.22 The recent dramatic growth of internet sales is well documented. For many years, the proportion of SFT
remained broadly constant, but in the last five years, there has been a very significant increase in SFT. It is
reasonable to suggest that the amount of spending that will take place outside retail stores has, and will continue
to increase, due to a number of factors including consumer confidence in using alternative mediums for
addressing their shopping needs.
3.23 Experian recognise that an internet sale does not necessarily imply that items have not passed through a retail
outlet, and note that some supermarkets source internet goods from store space. In determining an appropriate
level of special forms of trading we have considered information from Experian, the GLA 2009 Retail Study and
household survey data. In light the available evidence we have applied a rate between 2% and 2.7% for
convenience goods and 7.2% growing to 11.2% for comparison goods.
Annual Growth Rates
3.24 We have utilised expenditure forecasts produced by Experian. This assumes the growth in convenience goods
expenditure of 0.5% per annum for each study year (down from 0.9% per annum in the 2009 Study for the period
to 2012 – 2016). For comparison goods, it is assumed that expenditure will increase by 2.8% (down from 4.3%
per annum in the 2009 Study for the period 2006 – 2016) for each study year.
3.25 The annual growth rates provided by Experian are based on the blending of long term trends and forecasts to
provide a long term forecast covering expected growth from 2012 to 2021. This forecast specifically excludes
recent trends and individual years and focuses on long terms which are more appropriate when looking many
years ahead.
3.26 Retail expenditure per head is set out for convenience and comparison goods in Tables 2a and 2b respectively.
These figures take account of Experian‟s predicted growth in retail expenditure, but with an increasing proportion
of expenditure on SFT (as described above). Per capita expenditure on convenience goods is anticipated to
grow from £1,615 in 2012 to £1,648 by 2016 and £1,681 in 2020. For comparison goods, per capita expenditure
is anticipated to increase from £2,248 in 2012 to £2,511 by 2016 and £2,804 by 2020.
3.27 Application of these per capita estimates to the population figures produces the projected “generated spending”
on convenience and comparison goods, presented in Tables 3a and 3b respectively. These indicate that the
catchment area is expected to generate about £767m and £1,000m on convenience and comparison goods
COPYRIGHT © JONES LANG LASALLE IP, INC. 2012. All Rights Reserved 14Barking Town Centre – Retail Study Update - February 2012
respectively in 2012 (at the 2009 price level). It is projected that these will increase to £796.6m and £1,136.7m
by 2016 and £832.6m and £1,246m by 2020.
3.28 The combined effect of the forecast growth in population and per capita expenditure is that we estimate that
catchment area expenditure will increase by £65.1m (8.5%) and £234.6m (23%), during the period 2012 – 2020
for convenience and comparison goods respectively.
Survey Based Turnover for Barking Town Centre
3.29 Having established the amount of potentially available retail spending to support floorspace within Barking Town
Centre, the next stage of the assessment is to consider the proportion of that potential which is actually, and
might realistically be, attracted to Barking Town Centre‟s shops in the future.
3.30 In June 2004, CB Richard Ellis commissioned a household survey of shopping patterns in the Barking and
London Riverside study area, which was used to inform the RLCS. The results of this survey have been used for
the purposes of this assessment. This approach is based on “spending retention”, as indicated by where the
respondents of the survey carried out their shopping. In so far as they have indicated that they make retail
purchases at shops within Barking Town Centre, this represents “retained spending” – expressed as a proportion
of the total estimated spending by study area residents. For the purposes of determining “retained spending” the
two previous Studies included the Tesco store on London Road. As the Tesco store is located in an out-of-centre
location and its performance does not contribute in any significance to the vitality and viability of the centre it has
been excluded. This means that “retained spending” is significantly reduced. For example, in Zone 1 the Tesco
store attracts around 30% of convenience spending.
3.31 In 2005 CBRE had assumed that for convenience goods expenditure, 75% would be main shopping trips, with the
remaining 25% for top-up shopping. The 2009 survey adjusted the survey results on the basis that main food
shopping accounts for 67% of retail expenditure, with the remaining 33% for top-up shopping trips. We have
adopted the same approach. The reason for this adjustment is two-fold. Firstly, it is evident from the further
surveys we have undertaken is that there is a significant amount of convenience goods floorspace within the
smaller shops, both in the town centre and in the various local centres and parades within the built-up area of
Barking. This would suggest that a significant amount of expenditure is undertaken in these shops. Secondly,
within a dense built-up area such as Barking, one would expect the proportion of top-up shopping to be greater
than in a lower density town where food shopping trips undertaken by car dominate more.
3.32 Since the survey was undertaken Barking has undergone significant change. On the upside the Town Square
scheme has been delivered, two Tesco Express stores have opened in the town and, as noted in the 2009 Study
Update, Asda has occupied of the former Somerfield‟s unit in Vicarage Fields. These changes have meant that
Barking has been able to maintain its modest convenience market share. The retail environment is continually
changing as a result of shifts in demographics, technology, evolving planning policy and the health if the wider
economy. Within this context many comparison retailers are concentrating on locations in city centres and major
regional shopping centres. Barking has been affected by these changes and as a result has lost a significant
amount of market share to higher order centres. This is reflected in the on-going decline in the amount of
comparison floorspace in the centre. As outlined in Section 2, the centre has lost 4,600m² (gross) of comparison
floorspace since 2004. The available survey data has been adjusted by Jones Lang LaSalle to reflect these
changes.
3.33 Tables 4b and 7b provide an estimate of turnover for convenience and comparison goods floorspace within
Barking Town Centre in 2012, using the results of this survey (shown in Tables 4a and 7a). In total, Barking
Town Centre is estimated to retain £38.4m (down from an estimated £50.9m in 2009) of convenience goods
COPYRIGHT © JONES LANG LASALLE IP, INC. 2012. All Rights Reserved 15Barking Town Centre – Retail Study Update - February 2012
shopping at 2012. For comparison goods, shops within Barking Town Centre retain an estimated £52.5m (down
from £89.6m in 2009) at 2012.
Benchmark Turnover
3.34 Benchmark turnovers are levels at which it is generally accepted that shops trade viably. It is normally accepted
as reasonable proxy for this, to assume that shops occupied by multiple traders perform at the national average
levels for those traders. As such information is not available for all shops, particularly for independent and smaller
chain stores, it is necessary to make assumptions about appropriate benchmark levels of trading performance.
3.35 The retail floorspace figures provided in the previous Studies have been updated following further analysis of
existing floorspace. This has included research into planning permissions, published information about retailer
and a comprehensive on-ground survey. It will be noted from Table 10a that within the town centre out of a total
of 5,224m² of net sales convenience floorspace, approximately half of this is in smaller outlets. We have made
assumptions in respect of net to gross ratios, based on our own inspection of retail facilities and experience
elsewhere.
3.36 For convenience goods, the benchmark sales density levels are derived from Mintel Retail Rankings 2011. For
comparison goods, Jones Lang LaSalle has also relied on Mintel, experience elsewhere, and historic references
such the GLA Retail Study.
3.37 In 2012, the base year, the total benchmark turnover of Barking‟s convenience shops is £38.2m, compared to the
survey derived turnover of £38.4m (Table 10a). For comparison goods, the total benchmark turnover in 2012 is
calculated to be around £52.3m which is about the same as what the available survey information is concluding
(Table 10b). This suggests that for convenience goods, existing stores are trading at levels in line with
expectation. The same analysis cannot be relied on when applied to comparison goods, as benchmark turnovers
cannot be assessed from company averages when there are large numbers of independent retailers selling a
variety of goods as is the case in most town centres, including Barking. However, from the information available,
historic references, on-the-ground observations and experience elsewhere it is considered that Barking is trading
more or less in line within expectations.
3.38 The purpose of estimating benchmark turnovers is to indicate a level at which existing retail floorspace can
operate at a viable and effective level.
3.39 Evidently, retail floorspace can operate at significantly above and below such average trading levels successfully,
without any harm to the objectives of meeting shopping needs and maintaining the vitality and viability of centres.
These derived benchmark turnovers are simply to provide broad guidance on the adequacy of the general level of
provision.
Retail Capacity Analysis
3.40 We have assessed capacity based on three scenarios. These are:
3.41 Scenario 1 – convenience and comparison goods market shares revised to take account of various changes that
have occurred to the retail environment including Asda‟s occupation of the Somerfield unit within the Vicarage
Fields Shopping Centre, the opening of two Tesco Express stores and the on-going loss of comparison
floorspace (the current position); and
COPYRIGHT © JONES LANG LASALLE IP, INC. 2012. All Rights Reserved 16Barking Town Centre – Retail Study Update - February 2012
3.42 Scenario 2 – builds on Scenario 1 by making judgements about the degree of impact various commitments will
have on market shares. We have considered committed developments, both within and beyond the study area,
which affects the potential capacity for both convenience and comparison goods floorspace.
3.43 Scenario 3 – builds on Scenario 1 and 2 and considers the implications on market share arising from the
redevelopment of the London Road/North Street site for a 3,716m² (net) foodstore. It is expected that
convenience goods will occupy 70% of the floorspace with comparison goods occupying the remaining 30%. Five
retail/business units are also proposed.
3.44 The new foodstore will act as a major retail anchor in the Town Centre, and will significantly enhance pedestrian
footfall to the western part of Barking. It is considered that the superstore will offer a modern fit-for-purpose
shopping environment on a scale capable of competing with a number of out-of-centre superstores.
Scenario 1 – Convenience Goods
3.45 Table 4a presents the projections of retained spending and benchmark turnover, with derived surplus (or deficit)
spending for convenience goods to reflect constant market shares, following Asda‟s occupation of the Somerfield
unit within Vicarage Fields Shopping Centre and other improvements or changes to the town centre.
3.46 The expenditure figures are projected forward by applying the 2012 trade draw (market share) for each year up to
2020.
3.47 The benchmark turnover figures are assumed to remain constant, i.e. no allowance for floorspace efficiency,
because of the limited growth in convenience goods expenditure per annum, and also due to the nature of
existing convenience goods floorspace, there is limited scope to increase floorspace efficiency over and above
the current situation.
3.48 Table 11 sets out a residual capacity for the years 2012 – 2020. This increases from zero starting point in 2012
to £2.4m by 2016 and £4.7m by 2016. We have applied a sales density figure derived from the average of main
national food retailers to this residual spending. The results of this are set out at Table 11a. It indicates that the
resultant floorspace capacity (expressed in net floorspace terms), is 69m² in 2012, rising to 202m² by 2016 and
372m² at 2020.
3.49 It should be noted that this capacity is on the basis that the new floorspace would be for a leading supermarket
operator (£12,000 per m²). Some of this floorspace could be provided within smaller shops which would have a
much lower sales density, and therefore justify additional floorspace. Such stores typically have a net sales
density of substantially less than half of the main supermarket operators. For reference, Lidl currently has a sales
density of £3,272 per m² (excluding VAT).
Scenario 1 – Comparison Goods
3.50 Table 12a presents the projection of retained spending and benchmark turnover with derived surplus spending for
comparison goods to reflect constant market shares. We have revised down the baseline market share to take
account of various changes that have occurred since 2004. In other words this scenario sets out the current
position and rolls it forward to 2020.
3.51 In looking forward from 2012, we have assumed that existing floorspace sales density increases by 1.5% per
annum. This takes account of a more significant retail expenditure increases anticipated for comparison goods
and the anticipation that this will justify the construction of a significant amount of new retail floorspace, which will
be more efficient than existing floorspace.
COPYRIGHT © JONES LANG LASALLE IP, INC. 2012. All Rights Reserved 17Barking Town Centre – Retail Study Update - February 2012
3.52 Table 12a illustrates that the residual capacity to support new comparison goods floorspace rises from £1.7m in
2012, to £5m in 2016 and £7.5m in 2020. To these figures, we have applied a sales density for new comparison
goods floorspace at 10% above the sales density of existing floorspace, reflecting that the new floorspace
supported by this additional capacity is likely to be in the form of new modern shopping units that meet retailer
requirements.
3.53 The resultant floorspace capacity (expressed in net floorspace) is 427m² in 2012, rising to 1,184m² in 2016 and
1,659m² by 2020. The Table 10a also considers commitments in the town centre. Vicarage Fields is estimated to
have the ability to deliver up to 1,000m² (net) of comparison floorspace. For the purpose of this assessment we
have allowed for this floorspace to have achieved a settled pattern of trading by 2015.
Scenario 2 – Convenience Goods
3.54 Scenario 2, builds on the results of Scenario 1. We have adjusted the fixed market shares (as shown in Table 4a)
to take account of a number of proposed retail developments within and close to the catchment area that are
likely to affect the existing market share of Barking Town Centre. In particular, after 2014, we anticipate that the
market share of Barking Town Centre will diminish mainly as a consequence growing competition from retail
destinations elsewhere including the provision of convenience goods floorspace at Barking Riverside, which will
limit to some extent the trade draw from residents living on the western side of Barking, in places such as
Canning Town, East Ham, Manor Park and Ilford and to some degree the extension to the Tesco store on London
Road. The implementation of new convenience floorspace in Dagenham may also divert a small amount of trade,
however this diversion adds to the overall loss of trade. As can be seen from comparing tables 11a and 11b,
although the capacity for further convenience goods up to 2013 remains the same, from 2014, the capacity is
expected to be reduced. We anticipate that because of a loss of market share to other destinations there will be
no residual capacity until 2018. By 2020 residual capacity is expected to be only £1.2m.
3.55 As outlined above, because of development elsewhere Barking is expected to lose ground to other destinations.
This would reduce its market share accordingly. Based on this scenario where existing and future capacity is
derived from market share Barking would continue to lose ground. In other words unless strategies are
implemented to combat this, the decline of Barking‟s town centre will exacerbate and compound over time.
3.56 The approach of rolling forward market shares is in line with standard practice, however does not take into
account the desirability or need to „claw back‟ expenditure leakage directed to centres and facilities elsewhere
through improvements in retail provision. This issue is dealt with in Scenario 3.
3.57 The loss in market share means that for the duration of study period there will be no floorspace capacity for any
meaningful amount of convenience floorspace.
Scenario 2 – Comparison Goods
3.58 Scenario 2 builds on Scenario 1 which sets out the existing situation. Scenario 2 is set out in detail at Tables 8a
and 8b and seeks to take account of proposed retail developments in the vicinity of Barking that are likely to affect
its market share. The plans for significant additional retail floorspace within Ilford Town Centre will have the effect
of diminishing Barking‟s trade drawn from the west. Critically however, as noted in the commentary supporting
Scenario 1, Barking has lost 4,600m² (gross) of comparison floorspace since 2004. However, the extension to
Vicarage Fields (estimated to be trading at 2015) is expected to stem the decline. While the extension is expected
to put a temporary stop to the downward trend is it not expected that it will “clawback” a significant amount of
trade. In other words, the proposed development would merely help the town centre maintain its current (2012)
position within the wider retail hierarchy for a few years, before levels of leakage, in monetary terms, continue to
increase.
COPYRIGHT © JONES LANG LASALLE IP, INC. 2012. All Rights Reserved 18Barking Town Centre – Retail Study Update - February 2012
3.59 Utilising the same assumptions regarding floorspace efficiency and the sales density of new floorspace as in
Scenario 1, it is anticipated that assuming the extension to Vicarage Fields come forward there will be no residual
capacity for additional comparison floorspace for the foreseeable future.
3.60 As outlined above in paragraph 3.56 the assessment of floorspace „needs‟ or capacity carried out in this retail
study is based on a relatively conservative, retention of existing market shares approach (with allowances for
commitments).
3.61 This would suggest that substantial benefits would arise from continuing the implementation of objectives set out
in the Barking Town Centre AAP in order to claw back as much of that expenditure as possible so as to achieve
more sustainable shopping related travel patterns and potentially to generate spin-off economic benefits.
Scenario 3 – Convenience Goods
3.62 Scenario 3 builds on Scenario 2 and, as noted above, analyses the likely implications of the redevelopment of the
London Road/North Street site. Tables 6a and 6b set out this this analysis. We have applied a 2015 design year
to the proposal as this represents the probable timeframe for the foodstore to be open for trading and achieve a
settled pattern of trading. With this in mind we have applied Scenario 2 market shares up until 2015. The scenario
has considered on the basis that Asda will occupy the new foodstore and thus vacate its Vicarage Fields store
once the London Road/North Street store is trading. We have also assumed that the vacated store is not likely to
be occupied by a foodstore operator.
3.63 At 2015 the new foodstore will “clawback” a significant amount spending from Barking‟s immediate catchment
area that has been lost in recent years to other destinations and increase the centre‟s market share. Barking‟s
immediate local catchment (Zones 1 and 2) are expected to “clawback” almost £10m of spending with another
£7.5m coming from surrounding areas (Zones 3, 4, 5 and 6). The increase in spending retention will improve the
centres competitive position and, insofar as convenience spending is concerned, reverse Barking‟s decline.
3.64 As a result of additional floorspace and the improved market share, residual capacity, expressed as net
floorspace, is expected to grow from 318m² in 2016 to 515m² in 2020 (Table 11c).
Scenario 3 – Comparison Goods
3.65 Scenario 3 builds on Scenario 2 and considers the implications on market share arising from the redevelopment
of the London Road/North Street site for a 3,716m² (net) foodstore. It is expected that convenience goods will
occupy 70% of the floorspace with comparison goods occupying the remaining 30%. We estimated that the
comparison floorspace would generate a turnover of just under £9m. As noted above, we consider that a 2015
design year is appropriate and therefore we have applied Scenario 2 market shares up until this point.
3.66 At 2015, once the store is open and trading, we expect that it would “clawback” about £9m of spending to the
town centre. The majority of this is expected to come from the centres immediate catchment (Zones 1 and 2).
Together with the Vicarage Fields extension the proposed foodstore will bring about a significant increase in
footfall and provide a critical mass of floorspace that will see the centre improved its competitive position. The
centre‟s share of Zone 1 comparison spending is expected to increase from 33% (2014) to 40% (2015), for Zone
2 the expected increase by 6% to 26%, up from 20% in 2014. The improved market share will “clawback”
spending that has been lost in recent years, however the centre is still behind its estimated position in 2009
where, for example, Zone 1 had a market share of 41%.
COPYRIGHT © JONES LANG LASALLE IP, INC. 2012. All Rights Reserved 19You can also read