Behavior and Welfare of Undocked Heavy Pigs Raised in Buildings with Different Ventilation Systems - MDPI
←
→
Page content transcription
If your browser does not render page correctly, please read the page content below
animals
Article
Behavior and Welfare of Undocked Heavy Pigs Raised in
Buildings with Different Ventilation Systems
Marika Vitali            , Enrica Santolini        , Marco Bovo        , Patrizia Tassinari, Daniele Torreggiani and Paolo Trevisi *

                                          Department of Agricultural and Agri-Food Sciences and Technologies, University of Bologna,
                                          40127 Bologna, Italy; marika.vitali4@unibo.it (M.V.); enrica.santolini2@unibo.it (E.S.);
                                          marco.bovo@unibo.it (M.B.); patrizia.tassinari@unibo.it (P.T.); daniele.torreggiani@unibo.it (D.T.)
                                          * Correspondence: paolo.trevisi@unibo.it

                                          Simple Summary: The relationship between animal welfare and housing conditions is still a matter
                                          of debate. The present study aimed to evaluate animal welfare of undocked heavy pigs from the
                                          same farm, raised in buildings with different ventilation systems, i.e., mechanical and natural,
                                          throughout the fattening period (90–160 kg average weight). Ventilation efficiency was evaluated
                                          using computational fluid dynamics. Results showed that overall pigs raised in the mechanical
                                          ventilated building were in a more positive affective state. Despite that, with hot temperatures, the
                                          higher occurrence of pig soiling indicated heat stress and consequent welfare impairment. The higher
                                          frequencies of dog sitting behavior also indicated worsening of welfare conditions in the middle–late
                                          phases of fattening, likely imputable to the lack of stimuli and boredom in the pigs.

                                          Abstract: The present study aimed to evaluate animal welfare of pigs from the same farm, raised
                                          with two ventilation systems. The study involved 60 pens of fattening pigs, raised in two buildings:

                                   one naturally ventilated (NV) and the other mechanically ventilated (MV). Pigs were assessed on
Citation: Vitali, M.; Santolini, E.;
                                          three observation days: at 40 kg (T1), 100 kg (T2), and 160 kg (T3) of live weight. Animal-based
Bovo, M.; Tassinari, P.; Torreggiani,     measures were used such as qualitative behavioral analysis (QBA), behavioral measures (BMs), and
D.; Trevisi, P. Behavior and Welfare of   lesion and health measures (LHMs). Housing conditions (HCs) measured at each observation day
Undocked Heavy Pigs Raised in             were the number of pigs per pen, space allowance, temperature, light, and CO2 . The association
Buildings with Different Ventilation      study was performed using a general linear model and analysis of variance. Ventilation effect was
Systems. Animals 2021, 11, 2338.          analyzed by performing computational fluid dynamics. Results showed that overall pigs raised
https://doi.org/10.3390/ani11082338       in the MV were in a more positive affective state. Despite that, with hot temperatures, the higher
                                          occurrence of pig soiling indicated heat stress in pigs and consequent welfare impairment. The higher
Academic Editor: Vera Baumans
                                          frequency of pigs showing dog sitting behavior at T2 and T3 suggest welfare worsening in the last
                                          phases of fattening. The study concludes that ventilation system influences animal behavior and
Received: 10 July 2021
                                          overall animal welfare, especially during the warmer season.
Accepted: 5 August 2021
Published: 8 August 2021
                                          Keywords: animal behavior; animal welfare; computational fluid dynamics; housing conditions;
                                          undocked tail; heavy pigs; animal-based measure; ventilation systems; association study; qualitative
Publisher’s Note: MDPI stays neutral
with regard to jurisdictional claims in
                                          behavioral assessment
published maps and institutional affil-
iations.

                                          1. Introduction
                                                Animal-based measures (ABMs) are considered the most reliable indicators to assess
Copyright: © 2021 by the authors.
                                          the welfare status of an animal and to identify the risk factors in the management and
Licensee MDPI, Basel, Switzerland.
                                          environmental conditions [1]. They include a large variety of indicators such as behavior,
This article is an open access article
                                          clinical signs (e.g., skin lesions, pathologies), and physiological and productive parameters.
distributed under the terms and           ABMS allow measuring how a single animal (or a group of animals) reacts to environ-
conditions of the Creative Commons        mental and management stressors. One of the main stressors in intensive pig herds is the
Attribution (CC BY) license (https://     fluctuation of the (indoor) environmental temperature, particularly when it overcomes
creativecommons.org/licenses/by/          the thermoneutrality threshold of the animal [2]. Further causes of environmental stress
4.0/).                                    can be attributed to excessive relative humidity (rH) and harmful gas concentrations (e.g.,

Animals 2021, 11, 2338. https://doi.org/10.3390/ani11082338                                                     https://www.mdpi.com/journal/animals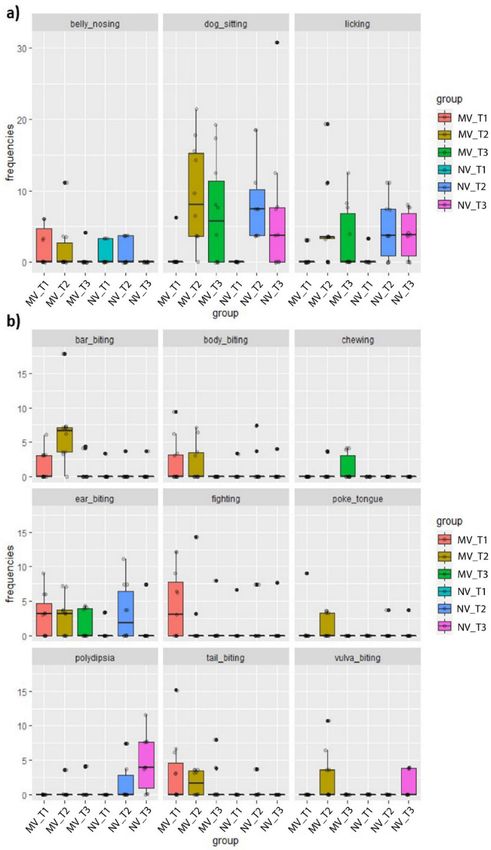
Animals 2021, 11, 2338                                                                                          2 of 20

                         CO2 and NH3 ) [3,4]. Concerning temperature control and gas removal, ventilation effi-
                         ciency plays the main role, and it is mainly dependent on the ventilation system in the
                         barn [5]. At present, pig barns in the Mediterranean area are mainly wind-driven and,
                         thus, naturally ventilated, while mechanical ventilation systems are less common [6]. In
                         naturally ventilated buildings, the external wind influences the indoor velocity magnitude
                         and distribution [7]. In these systems, the accurate control of the indoor conditions is
                         not always feasible, especially on warm days, when the windows and vents of the barns
                         are fully open [8]. In mechanically ventilated barns, the ventilation efficiency can vary
                         depending on the operational conditions of the ventilation system [9]. In both natural
                         and mechanical ventilation systems, the ventilation efficiency can vary depending on the
                         geometry of the piggery structure; therefore, it should be carefully evaluated.
                               Inadequate ventilation, leading to subsequent changes in temperature, humidity,
                         and presence of gas and dust [10–12], has been found linked to pig behavior, health,
                         and physiology [9]. For some ABMs, the effects of poor ventilation on animal health
                         are well known; for example, an insufficient air exchange can increase the occurrence of
                         respiratory disease and thermal stress [7,13], while contrasting results have been observed
                         with regard to animal behavior. In the case of aggressive behaviors and outcomes such as
                         lesions, specific studies are lacking. Some studies reported that heat stress can lead to the
                         development of aggressive behavior and consequent skin lesions [14]; other works showed
                         that high CO2 concentration might induce higher inactivity rates of pigs and could increase
                         the risk of overloading with subsequent occurrence of lesions in the middle area of the
                         body and/or the prevalence of bursitis due to the prolonged contact of bone prominence
                         with the floor [10].
                               Furthermore, tail biting and relative tail lesions have been hypothesized to be in-
                         fluenced by the ventilation conditions (i.e., magnitude air velocity, air direction, and air
                         exchange) and typologies (i.e., natural or mechanical). Hunter et al. [15] observed a higher
                         presence of lesions in the case of mechanical ventilation than in the case of natural ven-
                         tilation. Therefore, it is important to consider that, according to Hunter et al. [15], the
                         natural ventilated building considered in the study was provided with straw litter, which
                         is considered the “gold standard” to prevent tail biting behavior, and this aspect might
                         have biased the results. On the contrary, the study by Scollo et al. [16] reported higher
                         frequencies of tail lesions in the farms adopting natural ventilation.
                               Lastly, no studies have been found on the effect of ventilation on the emotional
                         state of fattening pigs. Today, it is worth noting that animals need a positive emotional
                         state to be in a positive welfare condition [17]; therefore, ABMs to assess pig emotional
                         state have been proposed, such as qualitative behavioral assessment (QBA), tail posture,
                         and tear staining [18,19]. It has been questioned if the impact of ventilation, dust, and
                         air quality could be a confounding factor for some emotional state indicators [20,21]. It
                         has been hypothesized that temperatures out of the acceptable range can influence tail
                         posture, which is also an indicator of tail biting behavior in a group of pigs, and pig
                         emotions, leading to misinterpretation of the measure itself. Similarly, high dust and gas
                         concentrations can mislead the interpretation of tear staining as an indicator of emotion in
                         pigs, due to inflammation of the eye and conjunctiva by poor air quality [20].
                               Lastly, previous research found evidence that the age and weight of the pigs might
                         also influence their behavioral response toward housing conditions, temperature, and
                         air quality [22], stressing the need to consider this variable when assessing the effect of
                         ventilation on ABMs in a productive cycle.
                               Being able to identify the relationships between ABMs and ventilation conditions
                         might be helpful to prevent the occurrence of harmful social behaviors and, therefore,
                         increase pig welfare conditions.
                               This study hypothesized that there would be significant associations between housing
                         condition management and behavior, lesions, and emotional state in undocked pigs during
                         the fattening phase. Therefore, the first aim of the study was to quantify and qualify the
                         main welfare issues of the pigs. The second aim was to define and compare the ventilation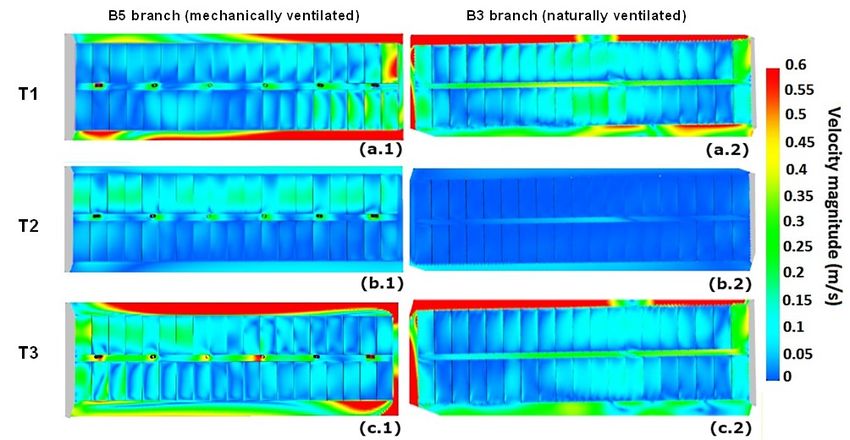
Animals 2021, 11, 2338                                                                                            3 of 20

                         conditions in two different buildings of a case study farm, using computational fluid
                         dynamics (CFD) simulations, and to investigate possible relationships between welfare
                         indicators and housing and ventilation conditions, to evaluate how these can impact
                         pig welfare.

                         2. Materials and Methods
                              In the study, a list of animal-based indicators of both negative and positive welfare
                         status was tested in two groups of finishing pigs reared in a barn located in northern Italy.
                         The two groups were housed in two different buildings, which were selected for the study
                         because they have analogous management conditions but are characterized by different
                         ventilation conditions (natural vs. mechanical ventilation).

                         2.1. Livestock, Building, and Animals
                              This study was conducted in a commercial pig farm located in northern Italy, in the
                         heart of the so-called Food Valley. At the beginning of the observations, a face-to-face
                         interview with the farmer was conducted by two authors, P.T. (Paolo Trevisi) and M.V.,
                         using a questionnaire (Supplementary File S1). The purpose of the questionnaire was used
                         to determine the overall rearing condition of the farm and main management practices.
                         Briefly, the farm was a fattening farm belonging to a specific supply chain. Therefore, all
                         the pigs came from the same group, genetic line, and overall housing conditions. All pigs
                         were left undocked. Pigs at the beginning of the fattening period weighted 40 kg and were
                         raised for 4 months until 160 kg of live weight. The farm had three employees caring for
                         the animals, and there were written procedures about the prevention of tail biting and
                         emergency culling.

                         2.2. Description of the Building
                               The farm was originally designed to host dairy cows; however, in the 1990s, it was
                         restored and converted to house finisher pigs. An aerial view of the particular shape of the
                         building, similar to a “star” with six buildings labeled B1–B6, is shown in Figure 1 together
                         with some representative pictures, both internal and external. The central core of the farm
                         is a heptagon with an edge dimension of about 20 m; the inner height is 7.50 m at the eaves
                         and 9.40 m at the top of the central dome. The buildings are 72.30 m long. Buildings B1, B2,
                         B3, and B6 are 17.70 m wide, whereas B4 and B5 are 19.80 m wide.
                               The present study focused on B3 and B5. The two different buildings were selected
                         since they can be considered representative of the two different ventilation conditions of
                         the farm. B3 is naturally ventilated and is (north–south) oriented. Natural ventilation (NV)
                         in B3 is obtained through wall windows and ridge vents running all along the building
                         length. B5 is SE–NW oriented and is equipped with a mechanical ventilation system. The
                         mechanical ventilation (MV) is realized by means of six longitudinally equally spaced
                         chimney fans (Fancom, The Netherlands). Furthermore, the wall windows on the lateral
                         longer side allow for the entering of the fresh air.
                               Each building hosts around 700 pigs (for a total of 4200 pigs in the farm). The buildings
                         hosting the pigs are characterized by two lines of pens (19 + 19) with a central service
                         corridor of about 0.90 m running along the whole length of the building. Pens have about
                         25% of the surface characterized by a slatted floor and 75% characterized by a full slab.
                         Each pen is provided with a trough for liquid feed (provided twice a day) and two nipple
                         drinkers. Environmental devices are constituted by a chain and a chain with wood placed
                         in the middle of each pen.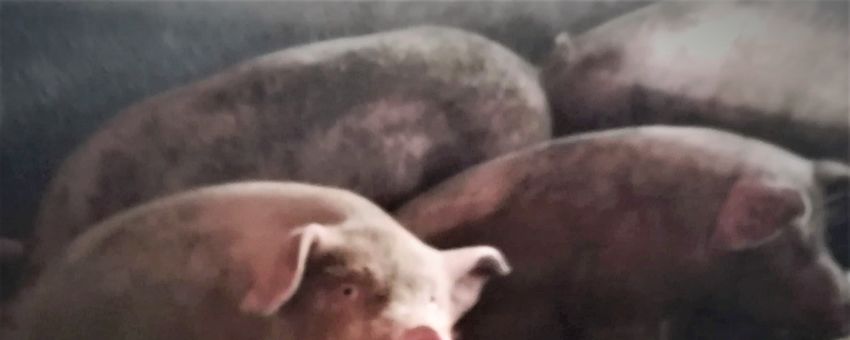
•     T3: the day before loading to the abattoir, at about 160 kg of body weight.
                              At each observation point (i.e., observation day), 10 pens per building were randomly
                         chosen, according to the Welfare Quality protocol [23].
                              The three observation days (T1, T2, and T3) for the two buildings (B3 and B5) led to
Animals 2021, 11, 2338   six different scenarios in which data on housing conditions and data on animal-based  4 of 20
                         measures were collected. Moreover, the same six scenarios were numerically investigated
                         by means of CFD simulations.

                          Figure 1. The
                         Figure      Thecase
                                          casestudy
                                               studybuilding:
                                                        building:(a)(a)
                                                                     aerial view
                                                                        aerial    of the
                                                                               view      farm;
                                                                                     of the    (b) external
                                                                                            farm;           viewview
                                                                                                   (b) external   of building  B3 (nat-
                                                                                                                       of building   B3
                          urally ventilated);
                         (naturally           (c) internal
                                     ventilated);           view
                                                  (c) internal    of building
                                                               view             B3 B3
                                                                      of building  (naturally ventilated);
                                                                                      (naturally           (d)(d)
                                                                                                 ventilated);  internal view
                                                                                                                  internal    of the
                                                                                                                           view  of the
                          building B5
                         building   B5 (mechanically
                                        (mechanically ventilated).
                                                        ventilated).

                         2.3. Sampling Procedure and Investigated Scenarios
                              The present study involved a total of 60 pens, 30 in the NV building (B3) and 30 in the
                         MV building (B5). The average number of pigs/pen during the study was 28.23 ± 2.77 SD.
                         The animals in each building were assessed on three observation days (T), for a total of
                         1694 pigs observed:
                         •    T1: 1 week after their allocation in the building, at about 40 kg of body weight;
                         •    T2: 1 month after the allocation, at about 90 kg of body weight;
                         •    T3: the day before loading to the abattoir, at about 160 kg of body weight.
                               At each observation point (i.e., observation day), 10 pens per building were randomly
                         chosen, according to the Welfare Quality protocol [23].
                               The three observation days (T1, T2, and T3) for the two buildings (B3 and B5) led
                         to six different scenarios in which data on housing conditions and data on animal-based
                         measures were collected. Moreover, the same six scenarios were numerically investigated
                         by means of CFD simulations.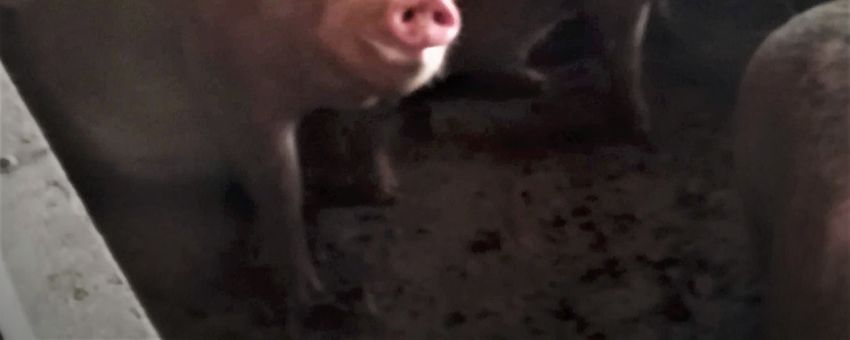
Animals 2021, 11, 2338                                                                                                                 5 of 20

                                      2.4. Experimental Measures
                                      2.4.1. Animal-Based Measures
                                           The ABMs were recorded on each observation day. Full references and explanations
                                      of the measures are reported in Table 1.

           Table 1. List of parameters measured in the study, as well as their level of sampling, references, and description.

   Type              Parameter              Reference                                         Description
               Qualitative Behavior                         The value was expressed in mm on a scale of 125 mm (visual analogue scale
   QBA                                          [23]
                  Assessment                                                                     for QBA).
                                                           Modified from the reference. Negative social behavior included any aggressive
                                                               social behavior or biting causing a response from the disturbed animal.
                                                           Positive social behavior consisted of sniffing, licking, play, and moving gently
                  Social behavior                          away from the other animal without an aggressive or fight reaction from this
    BM                                          [23]
              (negative and positive)                       individual. Negative and positive social behaviors were recorded, and they
                                                            were expressed as the ratio of the percentage of social behavior (positive or
                                                           negative) to the percentage of total active behavior (sum of social, explorative,
                                                                                          and other behaviors).
               Explorative behavior                        Pen- and enrichment- directed exploratory behaviors were recorded, and they
                    (pen and                                were expressed as the ratio of the percentage of social behavior (positive or
    BM                                          [23]
                  environmental                            negative) to the percentage of total active behavior (sum of social explorative
              enrichment—directed)                                                        and other behaviors).
    BM        Other active behavior             [23]                 Any active behavior not included in the previous categories.
    BM          Inactive behavior               [23]       Any behavior when the animal remained motionless, i.e., without any activity.
    BM              Tail biting                 [24]                 A pig attempting to manipulate or bite the tail of a pen mate.
    BM              Ear biting                  [24]                 A pig attempting to manipulate or bite the ear of a pen mate.
                                                           A pig attempting to manipulate or bite a part of the body of a pen mate (e.g.,
    BM              Body biting                 [24]
                                                                                               flank, legs).
    BM                Fighting                  [24]                                   A pig involved in fighting.
    BM               Bar biting                 [25]                A pig biting or nibbling the bars or other structures in the pen.
                                                             A pig is performing the same movements as when nursing on the body of
    BM              Belly nosing                [26]
                                                                                               another pig.
    BM,             Vulva biting                  -               A pig is attempting to manipulate or bite the vulva of a pen mate.
    BM              Poke tongue                   -                  A pig sitting or standing and poking the tongue in and out.
    BM                Chewing                   [25]       A pig showing continuous chewing without evidence of food in the oral cavity.
    BM               Dog sitting                  -               A pig sitting immobile on forelegs with hindquarters on the floor.
                                                               A pig whose snout or tongue was used to touch a pen mate followed by
    BM                   Licking                 -
                                                                                            head movements.
                                                                Repeated access of a pig to a drinker, with water intake that appeared
    BM               Polydipsia                  -
                                                                    excessive for its physiological needs and/or with water waste.
                                                             Scores were defined as follows: 0 = tail up (curly); 1 = tail down (hanging);
    BM              Tail position               [27]
                                                                          2 = tail tucked low (down and tucked to the body).
                                                            Considering 5 separate areas (ear, fronts, middle, hindquarters, legs). Scores
   LHM              Skin lesions                [23]         were defined as follows: 0 = up to 4 lesions visible; 1 = 5–10 lesions visible;
                                                                                       2 = 11 to 15 lesions visible.
                                                           Modified from the reference as follows: 0 = absence of lesions; 1 = superficial
                                                               biting along the length of the tail but no evidence of swelling or blood;
   LHM               Tail lesions               [23]
                                                            2 = fresh blood visible on the tail, or presence of a scar, swelling, or missing
                                                                                              part of the tail.
                                                            Presence of red tears in the left eye. Modified from the reference as follows:
                                                            0 = absence of staining; 1 = staining barely detectable or less than 50% of the
   LHM             Tear staining                [20]
                                                              total eye area; 2 = staining up to 100% of the eye area or extending below
                                                                                                the mouth.
                                                            Modified from the reference. The presence or absence of this parameter was
   LHM                   Hernia                 [23]
                                                                                  assessed in each observed individual.
                                                            Modified from the reference. The presence or absence of this parameter was
   LHM               Lameness                   [23]
                                                                                  assessed in each observed individual.
                                                           Animals that had to be removed from the pen, needing further care, or being
   LHM              Further care                [28]       emergency culled. The presence or absence of this parameter was assessed in
                                                                                        each observed individual.
                         QBA = qualitative behavior assessment; BM = behavioral measure; LHM = lesion and health measure.
Animals 2021, 11, 2338 6 of 20
Measures were divided into qualitative behavior assessment (QBA), behavioral mea-
sures (BMs), and lesions and health measures (LHMs). The same observer (i.e., the co-
author M.V., with 5 years of experience with ABMs and trained to use the Welfare Quality
protocol) recorded all the data. QBA was observed between 9:00 and 10:00 am and con-
sisted of four observations (5 min each) for a total of 20 min. Then, the data were reported
on a 125 mm scale and multiplied by the coefficients indicated in the protocol [23] to
calculate the QBA score. BMs were evaluated between 10:00 am and 11:00 am with the
direct observation of all pigs in each pen, three times per pen, for 5 min per observation.
Then, the average of the three observations was calculated. Behavioral measures consisted
of two types of observation: categories of behavior as described in the Welfare Quality [23],
and abnormal behaviors or stereotypies.
Categories of behavior included “inactive behavior”, “social behavior”, “exploratory
behavior”, and “other active behavior”, as detailed in Table 1. The frequency of “social”,
“exploratory”, and “other active behaviors” was determined by the total active behavior in
each pen. The frequency of “inactive behavior” was calculated as a function of the total
behavior observed, as explained in the Welfare Quality protocol for pigs [23]. Observed
stereotypies and abnormal behaviors were recorded (i.e., tail biting, ear biting, dog sitting,
bar biting), and they were calculated as the percentage of the mean of animals exhibiting
the behavior (Ab ) over the total number of animals (Atot ) in the pen [24].
Ab /Atot × 100 (%). (1)
Then, the sum of all stereotypies and abnormal behavior was calculated for each pen.
LHMs were assessed in the afternoon on a sample of 15 pigs/pen. The assessment
was carried out inside the pen at a distance of 0.5 m from the pig, using a headlight when
necessary. Only the left side of the pig was observed. Skin lesions were scored in each
pig using a score [23] ranging from 0 to 2 (i.e., 0: up to 4 lesions, 1: from 5 to 10 lesions;
2: more than 11 lesions); then, the most frequent (i.e., prevalence) score was calculated and
considered for each pen. The lesion score, ranging from 0 to 200 [24], was calculated for
each monitored area as follows:
prevalence of lesion with a score of 1 + (2 × prevalence of lesion with score of 2).
The same formula was used to calculate the dirtiness and tear staining index.
Other LHMs were recorded using a Y/N score (where Y denotes presence, and N
denotes absence), and the prevalence of pigs having a Y score was calculated in each
pen [24].
2.4.2. Housing Condition Measures
At each observation day, the most relevant parameters characterizing the housing con-
ditions (HCs) were measured. These were light intensity, temperature, CO2 concentration,
stocking density, and dustiness. Light intensity was measured using a Mini Light Meter
(UNI-T UT383, Dongguan City, China). The temperature was recorded with a Datalogger
(UNI-T UT330C USB, Dongguan City, China). CO2 concentration was measured with an
IR sensor using a XAM8000 Multigas Detector (Dräger, Lübeck, Germany). The area of
the pen was calculated using a Laser Distance Meter (Extech DT40M, Nashua, NH, USA),
excluding the feeding area, and then divided by the number of pigs to obtain the stocking
density. Light intensity, temperature, and CO2 were recorded at the pigs’ eye level as the
average of three points in the pen: the corner closest to the center of the building, in the
middle of the pen, and the opposite corner closer to the external wall.
2.4.3. Statistical Analysis of HCs and ABMs
All statistical analyses were performed using R software [29]. The statistical unit
was a pen. All observation days were considered separately. Descriptive analyses of
ABMs were performed using the psyc.ir package [30]. Frequencies of behavior or LHMAnimals 2021, 11, 2338 7 of 20
prevalence (considering the sum of scores of 1 and 2) showing a prevalence below 5% were
not submitted to further statistical analyses. A general linear model (GLM) was carried out
for the two buildings on the factors of the HCs, BMs, and LHMs intended as dependent
variables using the building as a factor (independent variable). The GLM procedure was
performed using the lme4 package [31], and the chi-squared test was used to evaluate
the differences between the two buildings (lsmeans package, [32]). QBA descriptors were
subjected to principal component analysis (PCA) using the FactoMineR package [33].
Statistical significance was set at p ≤ 0.05.
2.5. Computational Fluid Dynamics Simulations
The three-dimensional distribution of the ventilation conditions of buildings B3 and
B5 was assessed using CFD simulations. The CFD simulations considered the model of the
whole geometry of the pig farm, including the surrounding buildings, to take into account
the interactions between the different structures. The geometrical model was developed in
Autodesk Inventor [34], and the CFD analyses were carried out in VENTO AEC 2020 [35].
The geometrical model of the buildings is depicted in Supplementary Figure S1.
CFD analysis is based on the governing fluid dynamics equations (continuity, momen-
tum, and energy). The general Navier–Stokes equation, with Boussinesq approximation
that relates the Reynolds stresses and velocity gradients through the eddy viscosity, has
the following form:
! " #
∂Ui −∂P ∂ ∂Ui
ρUj = + (µ + µt ) . (2)
∂x j ∂x j ∂x j ∂x j
These models are also called eddy viscosity models and are classified on the basis
of the number of transport equations. The model, chosen for the simulations, was the
two-equation k–ε standard model, where the equations for k, kinetic energy per unit mass of
the turbulent fluctuations, and ε, dissipation rate, are as follows:
" #
∂k ∂k µt 2 ∂ 1 µt ∂k
+ Uj = S −e+ µ+ , (3)
∂t ∂x j ρ ∂x j ρ σk ∂x j
" #
∂e ∂e e µt 2 ∂ 1 µt ∂e
+ Uj = C1e S − C2e e + µ+ , (4)
∂t ∂x j k ρ ∂x j ρ σe ∂x j
where σk , σe , C2e , and C1e are experimental constants available from the literature [36].
The boundary conditions (i.e., outdoor temperature, relative humidity, wind mag-
nitude, and wind direction) for each one of the six scenarios considered were defined
according to the data recorded by the weather station of ARPAE, placed in Rolo (RE),
located only 5 km from the farm. They are summarized in Table 2. In the simulations, the
reference wind velocity profile was defined by the following logarithmic profile:
z−d
u
u(z) = log , (5)
K z0
where u(z) is the average wind speed at height z above the ground, u is the friction velocity,
K is the von Karman’s constant (assumed equal to 0.40), d is the displacement length, and
z0 is the aerodynamic roughness (in m).Animals 2021, 11, 2338 8 of 20
Table 2. Dates and main outdoor characteristics collected for every one of the six scenarios considered
in the CFD simulations.
Time dd/mm/yyyy T (◦ C) rH (%) V (m/s) Dir (◦ )
Building B3—Natural Ventilation
T1 02/04/2019 19.3 43.3 2.97 75
T2 21/05/2019 22.3 58.1 0.93 275
T3 20/08/2019 32.8 42.3 2.5 67
Building B5—Mechanical Ventilation
T1 14/02/2019 10.6 49.3 3.01 263
T2 22/03/2019 17.1 31.1 1.07 270
T3 17/06/2019 29.9 46.6 2.01 80
T = temperature; rH = relative Humidity; V = air velocity; Dir = direction of the wind.
Moreover, for the building with mechanical ventilation, each chimney was defined in
the model as a pressure–volume source with a pressure gradient of 16.8 Pa/m obtained
from the datasheet of the fans (Fancom, The Netherlands). The mesh was selected after a
grid independency study based on four different grids in terms of cell number. The final
grid adopted for the analyses was characterized by 9 × 10⁶ million cells.
A preliminary experimental campaign was conducted on the farm to collect the air
velocity magnitude using a hotwire anemometer (Delta Ohm, Italy) with an uncertainty of
0.01 m/s, to validate the numerical model for both buildings. The results of the validation
process are shown in Supplementary Figure S2. The relative mean square error (RMSE)
results were equal to 0.003 m/s for the natural ventilated case and 0.048 m/s for the
mechanically ventilated building, confirming the limited difference between experimental
and numerical results.
3. Results
During the study, clinical observations were carried out by the farm veterinary and
the coauthors P.T. (Paolo Trevisi) and M.V.; no infective disease occurred, there was no
need for antibiotic or other veterinary treatment, and the animals were in overall good
health status.
3.1. Animal-Based Measures
3.1.1. Qualitative Behavior Assessment
Considering the three observation days, the QBA score (average ± SD) resulted equal
to 16.8 ± 2.2 and 27.8 ± 20.6, respectively, for building B3 with NV and building B5 with
MV. The main difference was obtained in the first assessment (T1), where NV had a score
of 17.8 and MV had a score of 51.07. The PCA analysis showed that the first and second
dimensions (Dim) together explained 71.9% of data variance. Dim1 accounted for 47.6%
and Dim2 accounted for 24.3% (see Figure 2).
Figure 2 shows that Dim1 accounted for the observation day, while Dim2 accounted
for the building. The output of the PCA is reported in Table 3. In general, considering the
two buildings (Dim2), NV showed overall higher arousal and negative emotional states
(i.e., tense, irritable, agitated) than MV, where the animals showed more positive state
and lower arousal signs. On the other hand, considering the effects of the observation
time (Dim1), pigs were perceived as being in a more positive emotional state (i.e., active,
relaxed, enjoying, playful, positively occupied, lively, content, happy) at T1 and a negative
emotional state (i.e., bored, aimless, distressed and listless) at T3.Animals 2021, 11, 2338 9 of 20
Animals 2021, 11, x FOR PEER REVIEW 9 of 20
Figure 2.
Figure Qualitative behavior
2. Qualitative behavior assessment (QBA) analysis performed
performed on on the
the pigs.
pigs. The
The QBA
QBA was
wasper-
performed following
formed following thethe indications
indications of the
of the Welfare
Welfare Quality
Quality [23].[23]. Descriptors
Descriptors andand factors
factors werewere ana-
analyzed
lyzed
usingusing principal
principal component
component analysis.
analysis. The results
The results of Dim1
of Dim1 (Principal
(Principal component
component dimension
dimension 1)
1) and
and
Dim2 Dim2 (Principal
(Principal component
component dimension
dimension 2) reported.
2) are are reported.
OneOnespotspot corresponded
corresponded to one
to one obser-
observation.
vation. The color of the spot indicates the observation: T1 (yellow, indicating pigs of 40 kg on aver-
The color of the spot indicates the observation: T1 (yellow, indicating pigs of 40 kg on average);
age); T2 (pink, pigs of 100 kg of average); T3 (red, pigs of 160 kg on average). The shape of the spot
T2 (pink, pigs of 100 kg of average); T3 (red, pigs of 160 kg on average). The shape of the spot
corresponds to the building: square = pigs raised in naturally ventilated building; circle = pigs
corresponds
raised to the building:
in the mechanically square = building.
ventilated pigs raised in naturally ventilated building; circle = pigs raised
in the mechanically ventilated building.
Table 3. Eigenvalue (Coordinate), quality of the representation (Cos2) and contribute of the descriptors (Contribute) used
Table 3. Eigenvalue (Coordinate), quality of the representation (Cos2) and contribute of the descrip-
in the Qualitative Behavior Assessment.
tors (Contribute) used in the Qualitative Behavior Assessment.
Dim1 Dim2
Descriptors
Coordinate Cos2 Contribute
Dim1 Coordinate Cos2 Dim2Contribute
Descriptors
Active 0.78 0.61 Coordinate
6.45 Cos2 Contribute0.48 Coordinate0.23 Cos2 Contribute
4.69
Relaxed 0.50 Active 0.25 0.78 2.68 0.61 6.45−0.73 0.48 0.54 0.23 11.04 4.69
Fearful −0.30 Relaxed 0.09 0.50 0.92 0.25 2.68−0.57 −0.73 0.33 0.54 6.7411.04
Agitated 0.22 Fearful 0.05 −0.30 0.52 0.09 0.920.86 −0.57 0.74 0.33 15.236.74
Calm −0.49 Agitated 0.24 0.22 2.55 0.05 0.52−0.67 0.86 0.45 0.74 9.2815.23
Indifferent 0.23 Calm 0.05 −0.49 0.55 0.24 2.550.40 −0.67 0.16 0.45 3.219.28
Frustrated −0.47Indifferent 0.22 0.23 2.30 0.05 0.550.23 0.40 0.05 0.16 1.093.21
Enjoying 0.67 Frustrated 0.45 −0.47 4.72 0.22 2.300.24 0.23 0.06 0.05 1.151.09
Enjoying 0.67 0.45 4.72 0.24 0.06 1.15
Bored −0.89 0.78 8.24 0.37 0.14 2.88
Bored −0.89 0.78 8.24 0.37 0.14 2.88
Playful 0.68 0.46 4.79 −0.40 0.16 3.28
Playful 0.68 0.46 4.79 −0.40 0.16 3.28
Positively occupied 0.76 Positively 0.58 6.06 −0.57 0.33 6.77
Lively 0.74 occupied 0.54 0.76 5.68 0.58 6.060.06 −0.57 0.00 0.33 0.066.77
Sociable −0.75 Lively 0.56 0.74 5.90 0.54 5.68 0.56 0.06 0.31 0.00 6.35 0.06
Irritable −0.01 Sociable 0.00 −0.75 0.00 0.56 5.900.88 0.56 0.77 0.31 15.926.35
Tense 0.57 Irritable 0.33 −0.01 3.47 0.00 0.000.70 0.88 0.50 0.77 10.1815.92
Aimless −0.96 Tense 0.93 0.57 9.75 0.33 3.47−0.19 0.70 0.03 0.50 0.7110.18
Distressed −0.95 Aimless 0.90 − 0.96 9.46 0.93 9.75−0.17 − 0.19 0.03 0.03 0.610.71
Content 0.95
Distressed
0.89
− 0.95
9.38
0.90 9.46
−0.06
− 0.17
0.00
0.03
0.06
0.61
Content 0.95 0.89 9.38 −0.06 0.00 0.06
Happy 0.95 0.91 9.51 0.04 0.00 0.03
Happy 0.95 0.91 9.51 0.04 0.00 0.03
Listless −0.82 Listless 0.67 −0.82 7.06 0.67 7.060.18 0.18 0.03 0.03 0.690.69
Dim1 = Principal component dimension 1; Dim2 = Principal component dimension
Dim1 = Principal component dimension 1; Dim2 = Principal component dimension 2. 2.Animals 2021, 11, x FOR PEER REVIEW 10
Animals 2021, 11, 2338 10 of 20
3.1.2. Behavioral Measures
3.1.2. Behavioral Measures
Different
Different pigpig stereotypies
stereotypies were observed
were observed during
during the trial. the
Theytrial. They are summariz
are summarized in
Figure 3. The observed stereotypies show that belly nosing and
Figure 3. The observed stereotypies show that belly nosing and tail biting were tail biting were mor
more
quent atat T1
frequent and T2,
T1 and T2,while
while dog
dog sitting
sitting andand licking
licking were frequently
were more more frequently
observedobserved
at
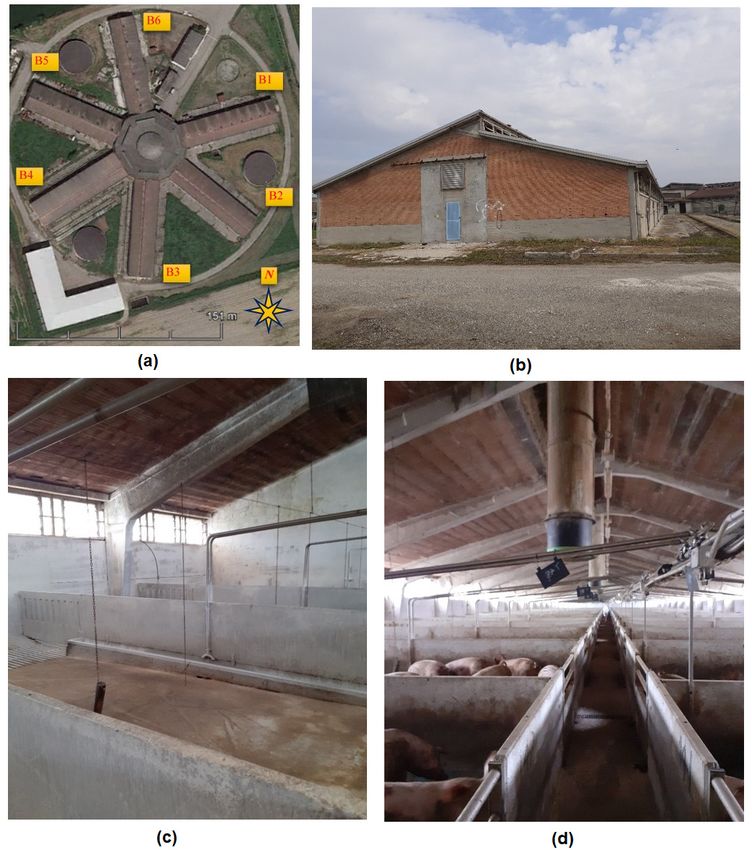
T2 and T3, in both buildings. Dog sitting was the most evidenced stereotypy overall
and T3, in both buildings. Dog sitting was the most evidenced stereotypy overall (see (see
Figure
ure 4).4).
Figure
Figure 3. 3. Observed
Observed stereotypies
stereotypies in the in
twothe two buildings
buildings attimes.
at different different
Eachtimes. Each
behavior wasbehavior
grouped was
ingrouped in (a,b)
(a,b) according to according
the observedtofrequency.
the observed frequency.Animals 2021, 11, 2338 11 of 20
Animals 2021, 11, x FOR PEER REVIEW 11 of 20
Figure4.4. Example
Figure Exampleofofdog
dogsitting stereotypic
sitting behavior
stereotypic frequently
behavior observed
frequently during
observed the behavioral
during the behav-
assessment.
ioral assessment.
Becausethe
Because theprevalence
prevalenceof ofsingle
singlestereotypies
stereotypies waswas substantially
substantially lowlow in in many
many cases,
cases,
theywere
they weresummed
summedand andconsidered
consideredtogether
togetherforforaastatistical
statisticalcomparison
comparisonbetweenbetween the the two
two
buildings.Statistical
buildings. Statisticalresults
resultsfrom
fromthe thebehavioral
behavioralanalysis
analysisare
arereported
reportedin inTable
Table4.4.
Attime
At timeT1,
T1,piglets
pigletsininthe
theMV MVbuilding
buildinghad hadaahigher
higherprevalence
prevalence of of tail
tail position,
position, as as
compared with the NV case (p < 0.0001). Pigs in MV also showed
compared with the NV case (p < 0.0001). Pigs in MV also showed higher stereotypies as higher stereotypies as
comparedtotoNV
compared NV(p(pAnimals 2021, 11, 2338 12 of 20
Table 4. Behaviors observed in the study in the two buildings.
NV MV
Behavior Measure UM Estimate p-Value
Mean SD Mean SD
T1 (40 kg)
Tail position up % 33.7 6.3 77.9 19.7 −1.0Animals 2021, 11, 2338 13 of 20
Table 5. Lesions and health measures observed in the study in the two buildings.
NV MV Estimate p-Value
LMI UM
Mean SD Mean SD
T1 (40 kg)
Ear LSI 0–200 29.6 22.9 33.9 20.3 1.0 0.5847
Front LSI 0–200 18.1 9.1 11.5 10.4 7.7 0.0749
Tail LSI 0–200 24.8 11.4 11.5 12.3 13.7 0.0096
Tear staining 0–200 1.7 3.2 60.7 21.2 −59.0decreased in the two lateral portions, close to the extremities, of the building.
At T2 the outdoor configurations had similar air velocity magnitude and similar
blowing wind direction in the two buildings. It is clear that the presence of the mechanical
ventilation system in B5 (see Figure 5(b.1)), as expected, increased the indoor air velocity
Animals 2021, 11, 2338 magnitude, while, in the natural ventilation case, the wind velocity was in general very 14 of 20
low (see Figure 5(b.2)).
Similar conditions also characterized T3 of building B3, naturally ventilated (see Fig-
ure 5(c.2)). Instead, in building B5, the ventilation system resulted in the airflow distribu-
A qualitative
tion and magnitude comparison
being veryofinhomogeneous
the results is shown
along intheFigure 5. Itlength
building is possible to observe
(see Figure
5(c.1)) compared to T1 and T2. This confirms the remarkable inhomogeneity of the internal in
that indoor airflow distribution was substantially different between the two buildings,
terms of both
ventilation airflowbetween
condition pattern the
anddifferent
air velocity
areasmagnitude.
of the B5 building.
Figure
Figure 5.5. Indoor
Indoorair
airvelocity
velocitydistribution
distribution0.5
0.5mmabove
abovethe
thepavement
pavementforfor
different observation
different days
observation days (T),
(T), for mechanically ventilated building B5 ((a.1) at T1; (b.1) at T2; (c.1) at T3) and naturally venti-
for mechanically ventilated building B5 ((a.1) at T1; (b.1) at T2; (c.1) at T3) and naturally ventilated
lated building B3 ((a.2) at T1; (b.2) at T2; (c.2) at T3).
building B3 ((a.2) at T1; (b.2) at T2; (c.2) at T3).
Further details
At T1, the twoofbuildings
the air velocity
showed magnitude are shown
very different in Table
indoor 7.
ventilation conditions. The
mechanically ventilated B5 building (see Figure 5(a.1)) presented an air velocity magnitude
Table 7. Indoor mean air velocity magnitude (V) obtained from the CFD simulations at a level of 0.50 m from the pave-
highly variable with the length, with very low air velocity close to the central body and
ment, for the pens on the left and on the right of the central corridor, for buildings W3 and W5.
progressively increasing toward the opposite extremity, with a velocity peak of 0.6 m/s.
Time dd/mm/yyyy
On the contrary, in the NV buildingV(see (m/s) 5(a.2)), results show
Figure
mean,left Vmean,right (m/s)
that, in the central
portion, the indoor B3—Natural
air velocityVentilation
ranged between 0.1 m/s and 0.2 m/s, while air velocity
T1 decreased02/04/2019
in the two lateral portions, close 0.090 0.106
to the extremities, of the building.
T2 21/05/2019 0.007 0.005
At T2 the outdoor configurations had similar air velocity magnitude and similar
T3 20/08/2019 0.059 0.083
blowing wind direction in the two buildings. It is clear that the presence of the mechanical
B5—Mechanical Ventilation
ventilation system in B5 (see Figure 5(b.1)), as expected, increased the indoor air velocity
T1 14/02/2019 0.091 0.103
T2 magnitude, while, in the natural ventilation
22/03/2019 0.124 case, the wind velocity0.122 was in general very
T3 low (see Figure 5(b.2)).
17/06/2019 0.123 0.110
Similar conditions also characterized T3 of building B3, naturally ventilated (see
Figure 5(c.2)). Instead, in building B5, the ventilation system resulted in the airflow
distribution and magnitude being very inhomogeneous along the building length (see
Figure 5(c.1)) compared to T1 and T2. This confirms the remarkable inhomogeneity of the
internal ventilation condition between the different areas of the B5 building.
Further details of the air velocity magnitude are shown in Table 7.
Table 7. Indoor mean air velocity magnitude (V) obtained from the CFD simulations at a level of 0.50
m from the pavement, for the pens on the left and on the right of the central corridor, for buildings
W3 and W5.
Time dd/mm/yyyy Vmean,left (m/s) Vmean,right (m/s)
B3—Natural Ventilation
T1 02/04/2019 0.090 0.106
T2 21/05/2019 0.007 0.005
T3 20/08/2019 0.059 0.083
B5—Mechanical Ventilation
T1 14/02/2019 0.091 0.103
T2 22/03/2019 0.124 0.122
T3 17/06/2019 0.123 0.110Animals 2021, 11, 2338 15 of 20
As the table shows, during the monitored period, the indoor velocity magnitude in
the MV building was, overall, more homogeneous than the air velocity in the NV building.
Moreover, the average value was 0.10–0.11 m/s for MV, while it was just 0.06–0.07 m/s
for NV.
4. Discussion
This study quantified and qualified the main welfare issues of pigs raised in two
different buildings of the same farm. The ventilation strategy, as assessed by the CFD
simulations, showed remarkable variability in the ventilation conditions of each building
across the three observation days.
Overall, the QBA assessment showed that animals in the mechanically ventilated
pens were in a more positive affective state, in accordance with the higher ventilation
performance of the MV building, characterized by higher indoor air velocity. The QBA also
evidenced a worsening in the affective states increasing with the age of the pigs. This last
effect might also depend on the reduction in space allowance and the increase in tempera-
ture during summer, as well as changes in pig physiology, as previously reported [37–39].
Therefore, the comparison between the two buildings was performed separately for each
observation time (i.e., T1, T2, and T3).
At T1, pigs in the MV group showed lower tail LSI compared to NV (Table 5) and
a higher proportion of pigs with tail position up (Table 4). Tail lesions are the outcome
of tail biting behavior. Tail biting is currently considered an iceberg indicator of poor
welfare, having a negative effect on the emotive state of pigs [40]. Tail biting is an abnormal
behavior, and its occurrence has been found to be strongly dependent by many managerial
and environmental factors [41]. In accordance with the result of this study, Lahrmann
et al. [27] proposed that assessing tail position would allow quickly identifying tail-bitten
pigs since these pigs would keep a low tucked tail, while pigs which show few or no tail
lesions would keep the tail curled and “up”.
In contrast, the behavioral analysis showed a higher frequency of negative social
behavior in the group in the MV building, as well as higher stereotypy frequency. Despite
that, lesion outcomes were not significantly different between the two animal groups in
the different buildings. A discrepancy between these two indicators (behavior and lesion)
was previously observed in other studies [24]. A possible explanation is that the lesions
are the consequence of negative social behavior that occurred in a range of time (days or
weeks), while the behavioral analysis in this study was a picture of the exact moment of
the assessment since they were recorded by direct observation. Moreover, a limit of the
present study was that behavioral analysis was carried out using direct observation; thus,
although the behaviors were recorded in the same range of time, the observations were not
conducted simultaneously. Pigs in the MV building showed an indeed higher score in tear
staining and dirtiness, as compared to the NV building. Tear staining is the presence of a
red stain in the left eye of a pig, as a consequence of the production of a red pigment by the
eye pituitary gland. In pigs, it has been proposed as an indicator of negative emotional
state because of a correlation with processing negative emotions [20,42]. Other studies have
hypothesized that tear staining might also be stimulated by excessive gas concentration,
dustiness, pen soiling, or other environmental conditions [24,43]. On this observation day,
the MV building group showed a higher proportion of dirty pigs. Pig soiling has been
frequently linked to higher gases in manure [44], and it might explain tear staining. The
indoor air velocity was similar in the two buildings (Table 7); however, the higher number
of pigs/pen with lower space allowance in the MV building compared to NV at T1 might
also have enhanced this mechanism.
At time T2, behavior and lesions did not show any differences, except for overall
higher stereotypies in the pigs in the MV building, mainly due to the percentage of pigs
showing ear biting behavior. Similar to tail biting, ear biting has been considered an
indicator of poor welfare so far [45]. Among the predisposing factors for ear biting, air
quality has been reported to influence its occurrence [46]. In MV building, the resultsAnimals 2021, 11, 2338 16 of 20
showed a higher concentration of CO2 as compared to NV building. CO2 is a product of
respiration, which is heavier than oxygen; therefore, it has been found to fluctuate at the
pig level. It is likely to presume that, on this observation day, the inhomogeneity of the
airflow and speed was not efficient to remove CO2 . Moreover, CO2 was found to be highly
related to the number of animals. The MV building had one more pig per pen and showed
a lower space allowance, contributing to an increase in the CO2 indoor concentration. This
result might explain the higher presence of ear biting in this group.
Behavioral analysis evidenced also a high proportion of pigs showing dog sitting
behavior on T2 and T3 observation days, in both buildings. Dog sitting has been considered
a non-aggressive stereotypic behavior and an indicator of suboptimal welfare in pigs [47,48].
According to the study by Scollo et al. [49], pigs reared in intensive conditions increased
the frequency of sitting behavior when space allowance decreased, e.g., in the fattening
phase. This has been interpreted as the lack of space to lie down [49] or the consequence of
boredom, leading to severe cognitive deprivation due to the barren environment [50,51]. A
combination of the two factors might explain the results of the present study. Heavy pigs
have a very restricted area available at the end of the cycle (because the current legislation
states that pigs above 110 kg require min 1.00 m2 , and, in heavy pig production, pigs can
reach up to 180 kg at the end of the rearing period). Moreover, the behavioral analysis
showed that the enrichment devices available to the pigs (metal chain and a metal chain
with wood) were of marginal interest since pigs spent most of their time exploring the pen
and very little time on the enrichment devices. Exploring the pen (over-exploring) has been
considered another sign of boredom and poor welfare in intensive pig farms since the pens
are usually in barren environments that do not provide cognitive stimuli to the pigs [52].
When considering T3, behavioral analysis evidenced a higher frequency of low tail
position and negative social behavior in MV compared to NV. A low tail position has been
previously associated with tail lesions; however, at this assessment, no differences were
observed for tail LSI. It is important to consider that, at T3, the two buildings raised the
maximum score in dirtiness, corresponding to almost all pigs in each pen having manure
on >50% of the body surface; therefore, this condition might have biased the results from
the lesion assessment. Pig soiling is considered the outcome of abnormal eliminative
behavior in pigs [44]. Normally, pigs on a partially slatted floor tend to release urine
and/or feces on the slatted floor and rest on the full floor. When certain predisposing
factors occur (see later), pigs can develop abnormal behavior, which leads to pen and pig
soiling. One of the main identified factors is thermal discomfort [53]; in fact, with high
temperature, pigs raised indoor tend to rest on the slatted floor and release urine and/or
feces on the full floor [54]. In very severe heat stress conditions, pigs tend to release urine
and/or feces, as well as rest, on the full floor with the purpose of heat loss [37]. This latter
condition has been considered an indicator of poor welfare since, in normal conditions,
pigs prefer to avoid contact with their excreta [44]. The optimal temperature range for
heavy pigs (140–180 kg of live weight) is estimated to be 18–20 ◦ C. Therefore, at T3, the
temperatures in the two buildings were very challenging for the pigs (29–30 ◦ C on average),
and neither type of ventilation was able to significantly reduce this temperature. The indoor
ventilation was consistently different at T3. The MV building showed high air velocity
in the extremities, compared to the central zone. On the other hand, the NV building
showed homogeneous low air velocity throughout the building length. This difference
could have affected CO2 concentration measured, which was significantly higher in the NV
building as compared to MV. Accordingly, in the NV pens, higher frequencies of polydipsia
were observed. Polydipsia is a stereotypy that can occur when pigs are submitted to heat
stress, in an attempt to cope with hot temperatures [55]. Moreover, behavioral analysis
observed also significantly lower inactive behavior in NV pens compared to MV ones.
Housing conditions also revealed that temperature, light, CO2 , and number of pigs per pen
were higher in the NV case compared to MV. Those factors might have influenced the pigs’
behavior. Some studies have observed an increase in activity and aggression in the presence
of high temperatures, due to heat stress and difficulty in finding a comfortable place toAnimals 2021, 11, 2338 17 of 20
rest for pigs kept under intensive conditions [14,44]. In the present study, negative social
behavior did not differ at T3, while a trend of more front LSI in NV pens was observed.
Other studies, in contrast, observed an increase in lying behavior at high temperatures [37].
The difficulty in finding a lying place could be exacerbated when the number of pigs per
pen increases, as in the NV pen group. Similarly, some studies reported that increasing
illumination in the pig farms can lead to an increase in activity, which does not impair
pig welfare [56]. In accord with the results, CO2 concentration was found to be directly
proportional to pig activity by Zong et al. [57].
When the temperatures in the two building buildings were challenging, the higher
air velocity in MV pens, even if not able to decrease the indoor temperature, could have
contributed to a reduction in the heat perception at the pig level, as well as to a reduction
in CO2 concentration, thereby influencing pig behavior and contributing to improving
their welfare [10]. One limitation of the study was that the measurements could not be
performed on the same day in both buildings, due to the farm flow chart, according to
commercial agreements between farmers and buyers. However, this is the first study
aimed at integrating ABM assessments and environmental measures provided by CFD
simulations in heavy pigs. These preliminary results pose new questions regarding the
effect of the interplay between outdoor and indoor conditions and ventilation systems on
pig welfare, which will be further investigated.
5. Conclusions
This study pointed out that the indoor environment might influence animal behavior
and overall animal welfare, and a detailed dynamic analysis of the indoor ventilation and
outdoor wind and exposition is very important to improve the conditions in which the
animals live and to identify the main risk factors that might impact animal health and
welfare. Especially in the presence of hot temperatures, the high occurrence of pig soiling
indicates severe heat stress in pigs and consequent welfare impairment. The high number
of pigs showing dog sitting behavior also suggested welfare deterioration for the pigs,
especially in the later phases of fattening, probably due to the combination of an absence
of stimuli and heat stress. According to the results reported in this study, in hot climates,
mechanical ventilation systems may not be sufficient to mitigate heat stress in pigs, and
other solutions (e.g., cooling systems or water sprinklers) should be proposed to avoid
welfare consequences for pigs.
Supplementary Materials: The following are available online at https://www.mdpi.com/article/
10.3390/ani11082338/s1: File S1. Farm questionnaire; File S2. Dataset; Figure S1. The geometrical
model used in the CFD simulations; Figure S2. Validation of the numerical model used for the
CFD simulations.
Author Contributions: Conceptualization, M.V. and P.T. (Paolo Trevisi); methodology, M.V. and
M.B.; software, M.V. and E.S.; validation, M.V. and M.B.; formal analysis, M.V. and E.S.; investigation,
M.V. and M.B.; resources, P.T. (Paolo Trevisi); data curation, M.V. and E.S.; writing—original draft
preparation, M.V. and M.B.; writing—review and editing, P.T. (Paolo Trevisi) and D.T.; visualization,
M.V. and E.S.; supervision, P.T. (Paolo Trevisi) and P.T. (Patrizia Tassinari); project administration, P.T.
(Paolo Trevisi); funding acquisition, P.T. (Paolo Trevisi). All authors read and agreed to the published
version of the manuscript.
Funding: The present study was funded by Progetto Filiera F61-Reg. (UE) 1305/2013-PSR 2014/2020
DGR Emilia-Romagna n. 227/2017 e s.m.i.-FOCUS AREA 3A-Operazione 16.2.01 capofila “Fontane
del Duca s.r.l” and by the project WELLDONEPIG R.E.R.* 16.1.01-FA 3◦ (ID application 5112552,
determinazione N 17611 of 30/09/2019) CUP J34D19000030006 granted by the Rural Development
Plan (PSR) of the Emilia Romagna Region.Animals 2021, 11, 2338 18 of 20
Institutional Review Board Statement: The experimental procedures, during the monitored period,
involved fattening pigs subjected to conventional intensive rearing conditions, according to the Dir
120/2008 EC, laying down minimum standards for the protection of pigs. Before the start of the study,
the procedure was explained to the farmers, and written informed consent was obtained. No tissues
or any other samples were collected; therefore, the study did not require approval by the Italian
Health Ministry, in agreement with the EU legislation, Dir 2010/63/EU of the European Parliament
and of the Council of 22 September 2010 on the Protection of Animals Used for Scientific Purposes.
Informed Consent Statement: Not applicable.
Data Availability Statement: All the data are provided within the manuscript and supplemen-
tary files.
Acknowledgments: The authors are very grateful to the farmer and technicians for their cooperation
and trust during all trials. We also want to acknowledge our colleague Elena Santacroce and
student Filippo Boni from the University of Bologna for their valuable support in data recording
and transcription.
Conflicts of Interest: The authors declare no conflict of interest.
References
1. EFSA Panel on Animal Health and Welfare. Statement on the use of animal-based measures to assess the welfare of animals.
EFSA J. 2012, 10, 2767. [CrossRef]
2. Carroll, J.A.; Burdick, N.C.; Chase, C.C.; Coleman, S.W.; Spiers, D.E. Influence of environmental temperature on the physiological,
endocrine, and immune responses in livestock exposed to a provocative immune challenge. Domest. Anim. Endocrinol. 2012, 43,
146–153. [CrossRef]
3. Ye, Z.; Zhu, S.; Kai, P.; Li, B.; Blanes-Vidal, V.; Pan, J.; Wang, C.; Zhang, G. Key factors driving ammonia emissions from a pig
house slurry pit. Biosyst. Eng. 2011, 108, 195–203. [CrossRef]
4. Rong, L.; Aarnink, A.J.A. Development of ammonia mass transfer coefficient models for the atmosphere above two types of the
slatted floors in a pig house using computational fluid dynamics. Biosyst. Eng. 2019, 183, 13–25. [CrossRef]
5. Tabase, R.K.; Van linden, V.; Bagci, O.; De Paepe, M.; Aarnink, A.J.A.; Demeyer, P. CFD Simulation of Airflows and Ammonia
Emissions in a Pig Compartment with Underfloor Air Distribution System: Model Validation at Different Ventilation Rates.
Comput. Electron. Agric. 2020, 171, 105297. [CrossRef]
6. Bjerg, B.; Marucci, A.; Cascone, G.; Zhang, G.; Lee, I.-B.; Liberati, P.; Banhazi, T.; Bartzanas, T.; Norton, T. Modelling of ammonia
emissions from naturally ventilated livestock buildings: Part 2, air change modelling. Biosyst. Eng. 2013, 116, 246–258. [CrossRef]
7. Chantziaras, I.; De Meyer, D.; Vrielinck, L.; Van Limbergen, T.; Pineiro, C.; Dewulf, J.; Kyriazakis, I.; Maes, D. Environment-,
health-, performance- and welfare-related parameters in pig barns with natural and mechanical ventilation. Prev. Vet. Med. 2020,
183, 105150. [CrossRef]
8. Kim, K.Y.; Jong Ko, H.; Tae Kim, H.; Shin Kim, Y.; Man Roh, Y.; Min Lee, C.; Nyon Kim, C. Quantification of ammonia and
hydrogen sulfide emitted from pig buildings in Korea. J. Environ. Manage. 2008, 88, 195–202. [CrossRef]
9. Yeo, U.H.; Lee, I.B.; Kim, R.W.; Lee, S.Y.; Kim, J.G. Computational fluid dynamics evaluation of pig house ventilation systems for
improving the internal rearing environment. Biosyst. Eng. 2019, 186, 259–278. [CrossRef]
10. EFSA. Opinion of the Scientific Panel on Animal Health and Welfare on a request from the Commission related to animal health
and welfare in fattening pigs in relation to housing and husbandry. EFSA J. 2007, 5, 564. [CrossRef]
11. Choi, H.L.; Han, S.H.; Albright, L.D.; Chang, W.K. The Correlation between Thermal and Noxious Gas Environments, Pig
Productivity and Behavioral Responses of Growing Pigs. Int. J. Environ. Res. Public Health 2011, 8, 3514–3527. [CrossRef]
12. Banhazi, T.M.; Stott, P.; Rutley, D.; Blanes-Vidal, V.; Pitchford, W. Air exchanges and indoor carbon dioxide concentration in
Australian pig buildings: Effect of housing and management factors. Biosyst. Eng. 2011, 110, 272–279. [CrossRef]
13. Merialdi, G.; Dottori, M.; Bonilauri, P.; Luppi, A.; Gozio, S.; Pozzi, P.; Spaggiari, B.; Martelli, P. Survey of pleuritis and pulmonary
lesions in pigs at abattoir with a focus on the extent of the condition and herd risk factors. Vet. J. 2012, 193, 234–239. [CrossRef]
14. Morrow-Tesch, J.L.; McGlone, J.J.; Salak-Johnson, J.L. Heat and social stress effects on pig immune measures. J. Anim. Sci. 1994,
72, 2599–2609. [CrossRef]
15. Hunter, E.J.; Jones, T.A.; Guise, H.J.; Penny, R.H.C.; Hoste, S. The Relationship between Tail Biting in Pigs, Docking Procedure
and Other Management Practices. Vet. J. 2001, 161, 72–79. [CrossRef]
16. Scollo, A.; Contiero, B.; Gottardo, F. Frequency of tail lesions and risk factors for tail biting in heavy pig production from weaning
to 170 kg live weight. Vet. J. 2016, 207, 92–98. [CrossRef]
17. Mellor, D.J.; Beausoleil, N.J. Extending the “Five Domains” model for animal welfare assessment to incorporate positive welfare
states. Anim. Welf. 2015, 24, 241–253. [CrossRef]
18. Rutherford, K.M.D.; Donald, R.D.; Lawrence, A.B.; Wemelsfelder, F. Qualitative Behavioural Assessment of emotionality in pigs.
Appl. Anim. Behav. Sci. 2012, 139, 218–224. [CrossRef]You can also read