Brainwave Detection Model for Panic Attacks Based on Event-related Potential
←
→
Page content transcription
If your browser does not render page correctly, please read the page content below

Journal of University of Babylon for Pure and Applied Sciences, Vol.(27), No.(1): 2019

 Brainwave Detection Model for Panic Attacks
 Based on Event-related Potential
 Puwadol Sirikongtham1, Worapat Paireekreng2 and Suwannit Chareen Chit3
 1,2
 Dhurakij Pundit University, Thailand
 3
 Universiti Utara Malaysia, Malaysia
 1
 puwadol.sirikongtham@dpu.ac.th; 2worapat.png@dpu.ac.th;
 3
 chareen@uum.edu.my

Abstract
 Panic attacks could adversely affect a patient’s daily life and can pose risks to others. The
symptoms of panic attacks can be timely observed by detecting the brainwave. This research presents a
model that can evaluate the level of panic attack symptoms using the brainwaves detection during (or
before) the symptom occurs. It helps monitor the patient’s brainwave based on Event-related potential
(ERP). The model is derived from the simulation with horror pictures and frightening sound on the
experimental group of 30 people. The survey related to symptoms which has been used regarding to
the criteria of the Beck Anxiety Inventory (BAI). The results showed that there is a consistent change
of Electroencephalography (EEG) in each change of brainwaves where its quantitative analysis found
that the changes of Beta, Gamma, and Alpha directly affect the model of Brainwaves Panic Attacks
Measurement (BPAM) which is associated with panic attacks. 1 out of 30 cases scored higher than the
average of the BPAM at 220 The Model BPAM can detect the risk to be Panic Attack compared to the
use of tests Beck Anxiety Inventory (BAI) were found to be consistent. The test value BAI Score 19-
63 was BPAM Score 401-1000. In addition, the results found that at P300 the brainwave pattern of
EEG in meditation had decreased significantly whereas the brainwave related to attention had
increased considerably for which human brain can potentially respond to stimulated external events.

Keywords: Beck Anxiety Inventory (BAI), brainwave patterns, event-related potential, panic attacks.

Introduction
 Brainwaves have been a medical topic of interest for a long time. Studies have
been conducted to determine the cause and prevent diseases related to the brain.
Recent
advancement in information and communication technology have paved ways for
biomedical signal processing, making it possible to analyses signals from human
bodies and study brainwaves. This has led to the development of brainwaves detection
and analysis, and has gained tremendous research attention in the recent years [1].
 Information and communication technology presents novel methods for
detecting brainwaves. Doctors can now communicate with speech impaired patients
using the electroencephalogram (EEG) by analyzing the characteristics of brain
electric wave signals [2]. Some studies also suggest the use of brainwaves for patients
suffering from muscle weakness disease, such as muscular dystrophy and
inflammatory myopathy. The Necomimi [3] cat ears are the example to show emotion

© Journal of University of Babylon for Pure and Applied Sciences (JUBPAS) by University of Babylon is licensed under
a Creative Commons Attribution 4.0 International License, 2019.

 333
Journal of University of Babylon for Pure and Applied Sciences, Vol.(27), No.(1): 2019

based on brainwaves detection which move the ears to represent the feelings of the
wearer at that time. Puzzlebox Orbit helicopter can use the brainwaves to control the
direction by moving up and down [4].

 Human-machine communication using brainwaves (Brain Computer Interface:
BCI) [5] can be applied to help people with disability (PWD). PWD can operate and
control computer equipment or appliances through brainwaves detection. This
technology also can be applied to facilitate people by analyzing electrical signals
generated from movement of the muscles. The brainwaves signal is derived from
brain neurons electromagnetic signals in the body. This signal is analyzed and
transformed into digital form. Computers can understand the meaning of these signals
and use it to interact with humans. There are various areas of BCI usage such as
medical, industrial, or entertainment [6].
 Humans normally respond to events through the autonomic nervous system
which balances the homeostasis. Humans cannot control factors such as heartbeat,
perspiration, or breathing. In contrast, the body system will run automatically when
the external environment changes [7]. This results in increased heart-rate, heavy
breathing, perspiration, and other responses to react to the situation which can be
either good, or bad. The body will react to a stimulation. However, if there is too
much system response towards stimuli, it automatically becomes panic attacks where
signals are transmitted from the brain to organs to respond to the stimuli. Succession
of panic attacks may result in a change or imbalance of neurotransmitters in the brain
of patients. In addition, if panic attacks relapse often with the continuous fear, it will
cause crucial impact in the patient’s daily life [8].
 Panic Attack symptoms may occur at any time due to stress. People living
under a stressful life over a long period of time may contract diseases such as
depression, anxiety, high blood pressure, cardiac abnormalities, diabetes, and much
more. In some cases, panic attack due to high stress level while performing other
activities such as driving, which can be harmful to other people. Stringent medical
examination must be carried out each time a patient displays symptoms of panic
attack. However, the cost for such examination high usually high and there is
currently no way to diagnose the symptom except via external observation only.
Therefore, it is necessary to detect and evaluate the symptoms of panic attacks via
other means. A possible approach is to detect and handle changes in brainwaves
during the symptoms occurred with an effective method to examine the patient. This
can help people suffering from stress significantly [9].
 This research proposes a model for detecting and determining brainwaves
patterns associated with Panic Attacks .The research conducts the experiment on the
simulation with picture and sound which users test the experience whether there is
Panic Attacks or not. They are tested about fear or shocking that is more than usual.
The users will be captured the brainwaves signal during the experiment to find the
Panic Attacks brainwaves.

Background
Brainwaves Detection
 The study in electric brainwave began in 1875 by Richard Carton. The research
focused on the characteristics of electric brainwave which affected to brain function in
animals. It used a single electrode polarity on the cortex of the brain (cerebral cortex)
and skull. Then, the potential of the electric brainwave occurred is measured using a
 334
Journal of University of Babylon for Pure and Applied Sciences, Vol.(27), No.(1): 2019

galvanometer. In addition, the research found that the potential of the electric is
increased while the animals sleep. It decreased and disappeared after the animals died.
Another study was conducted by a physiologist named Adolf Beck in 1890 by
measuring the electric potential of the cerebral cortex in dogs and rabbits. Several
other scientists have tried to apply such tools used in the study of electric brainwaves.
In 1914, Napoleon Cybulski and Jalenska Macieszyna recorded electric brainwaves of
a dog. They then developed an amplifier to detect to detect brainwaves in human. It
was applied first to humans in the 1920s by German neurologist Hans Berger [10].
EEG is a non-expensive, non-invasive and completely passive recording technique
used in brainwave studies. Berger also discovered alpha waves where the results of
this study has become the basis of detection and interpretation of electric brainwaves.
Today, advanced brainwave recorder has been developed. This includes applications
for detecting and analyzing electric brainwaves with higher accuracy and precision
than in the past. However, advances in brainwave interpretation has been slow and
needs a further research [11].

Electroencephalogram (EEG)
 Brainwave signals can be divided into different types. Generally, brainwaves
can be characterized by each signal’s characteristics and method of recording. EEG is
a measure of the electrical signal from the scalp or brain surface within the skull. The
measured EEG signal is related to the brain or nerves in the sensing area. The EEG
signal at certain frequencies reflects the mind and brainwaves as well as the measured
signal at the facial muscles. The brain has a neuron, which can be contacted by
transporting electrical particles through the cell in membrane. When a neuron is
stimulated, it releases charged particles that travel along the nerve fibers which
connected neurons. The next step is to stimulate the next nerve to release the charge.
This electrical signal is known as a brainwave and can be recorded as electrical
signals. The brainwaves’ characteristic moves up and down to the general wave by
using measurement of round per minute. There are several reasons why EEG is an
exceptional tool for studying the neurocognitive processes underlying human
behavior [12].
 EEG has very high time resolution and captures cognitive processes in the time
frame in which cognition occurs. EEG directly measures neural activity. EEG is
inexpensive, lightweight, and portable. EEG monitors cognitive-affective processing
in absence of behavioral responses show in Table I.

 Table I. Types of brainwaves signals divided by frequency.
 EEG Frequency The relationship with the activity of the brain.
 bands (Hertz)
 Gamma > 30 The distinguished mind, fear, solving problems, learning

 Beta 13-30 The body up or is triggered by various stimuli, the anxiety
 Alpha 8-12 Relax (but not sleepy), calm, concentrate in attentive
 things
 Theta 4-7 In the imagine, concentrated mind, during REM sleep,
 dream
 Delta 1-3 In the deep sleep, no dream

 335
Journal of University of Babylon for Pure and Applied Sciences, Vol.(27), No.(1): 2019

Panic Attacks
 Panic attacks can be severe or present uncomfortable experience to the
sufferer within minutes. Often, patients of panic attacks are concerned about
recurring attacks and the subsequent effects in public places. The fear of recurring
attacks resulted in patients avoiding performing certain activities or going to public
places, thus affecting one’s daily life. For example, the patient may avoid exercising
to keep the heart rate low in order to control the Panic Attacks symptoms. Panic
attacks are generally intense for up to 10 minutes or less, and begin to decline. The
severity of the condition can be heart disease, thyroid problems, respiratory distress
and other illnesses. The Diagnostic and Statistical Manual of Mental Disorders,
(DSM-IV-TR) [13] is a diagnostic criterion for mental disorders used in the United
States Made by the United States Psychiatric Association. It provides diagnostic
criteria which is characterized by at least 4 symptoms [14].

Event-related potential (ERP)
 ERP is a small voltage that occurs in the brain structure in response to specific
events or stimuli. The average of the electrical potential of the brain can be recorded
from changes due to external or internal events that are triggered over the period of
time [15]. ERP is studied to provide answers of the key questions in cognitive science
[16]. The study found that there is the pattern of the sequence of stimulus. The brain
electrical measurements are recorded as EEG. After that, each latency was brought to
find the highest amplitude after stimulation. For example, the positive wave with the
highest amplitude occurs at the time after stimulation about 100 milliseconds which is
called P100, and if latency is about 200 or 300 milliseconds it was called P200, P300
[17].
 P3 or P300 waves were discovered by [18] It is the brainwaves with highest
amplitude occurring about 250 - 400 milliseconds after stimulation such as light,
sound, or images of the Event-Related Potentials (ERP). This occurred at about 300-
650 milliseconds after the voltage level stimulation. It is compared with the next
phases with P3 bandwidth in order to see the information of stimulation. There are
several methods to retrieve P3 wave. One of the most common techniques used to
detect P300 is oddball. This technique presents the sequences of repetitive stimuli
which is infrequently interrupted by a different stimulus. The reaction of the
participant to this oddball stimulus is recorded [19].

Brainwave Detection Model for Panic Attacks
 This section presents the proposed model of brainwave detection for Panic
Attacks based on event-related potential.

Electroencephalogram (EEG) Detection
 The detection of brainwaves that comes through the signal capture device for
brainwaves can capture the brainwave at the frequency from 1 to 80 Hz. The
frequency of EEG is shown in Table II.

 336
Journal of University of Babylon for Pure and Applied Sciences, Vol.(27), No.(1): 2019

 Table II. The frequency of the wave
 Raw Data Returns raw EEG, sampling rate at
 1HZ
 Delta 1-3 Hz
 Theta 4-7 Hz
 (Alpha1 (Low Alpha 8-9 Hz
 (Alpha2 (High Alpha 10-12 Hz
 (Beta1 (Low Beta 13-17 Hz
 (Beta2 (High Beta 18-30 Hz
 (Gamma1 (Low Gamma 31-40 Hz
 (Gamma2 (High Gamma 41-80 Hz
 Attention integer value, between 0 and 100
 Meditation integer value, between 0 and 100

 However, the derived value of signal should be adjusted into the 1000 range
form in order to obtained optimized range of signal. It is convenience to separate the
signal value into specific type of signal. The adjusted formulas of each signal type are
shown in Equation (1) below.
 θ
 θ = 1000
 α α ℎ
 ( )+( )
 α= 100
 2
 100
 (1)
 δ
 δ= 1000
 ℎ
 ( )+( )
 = 100
 2
 100

 γ γ ℎ
 ( )+( )
 γ = 100
 2
 100

 After the brainwaves has been collected, the waveform of HighBeta, LowBeta,
HighGamma, LowGamma, with stimuli Event-related potential (ERP) has changed at
P300. Wherein γ_Avg is average of Gamma, β_Avg is is average of Beta, α_Avg is
average of Alpha. The detected brainwave signals will change immediately and the
visual attention was change with the highest frequency component of Gamma.
According to the average value of Gamma signals, the Gamma have proportional
constant, the study selects between 0.7 Gamma, beta and 0.3 Alpha were selected as
calculating the value of the vision Panic, because the Gamma and beta is the highest
mental tension value while Alpha mental tension state as a starting point. Shown in
Equation (2).

 Brainwaves Panic Attacks Measurement (BPAM)

 (0.7×( × 2 + × 2 )+(0.3× α ×α2 ) (2)
 =√ 2 + 2 + α 2

 337
Journal of University of Babylon for Pure and Applied Sciences, Vol.(27), No.(1): 2019

 When the signal detects through the brainwaves detection device, the pattern
of Panic Attacks based on the brainwaves Panic Attacks equation will be used. The
signal of alpha, beta and gamma will be evaluated. If the value of brainwaves Panic
Attacks measurement is greater than 200, attention value is greater than 80, and
meditation is less than 20, then the Panic Attacks alerts. Figure 1 represents the
algorithm of brainwaves Panic Attacks measurement.

 Figure 1. The algorithm of Brainwaves Panic Attacks Measurement Based on
 Event-related potential
Research Methodology
The Experimental Design
 This research by proposed the model of brainwaves detection on Panic
Attacks. The experiment was conducted the users in the simulation on thriller movie.
The simulation implemented visual and audio stimuli in 30 users. The application of
brainwaves detection has been developed and collected the data of users’ brainwaves.
During the experiment, the value of time, Delta, Theta, Alpha, HighBeta, LowBeta,
HighGamma, LowGamma were recorded. Next, High and Low values are combined.
Hence, the value to be used in the model will be Delta, Theta, Alpha, Beta, and
Gamma.
 The experimental group is 30 students aged from 19 to 21 with none or little
experience with the device, and is balanced in terms of gender composition. The
simulation used the video as media with storytelling in the initial stage in order to
adjust the users’ brainwaves. There will be frightening scene appearing at almost the
end of the video.

 338
Journal of University of Babylon for Pure and Applied Sciences, Vol.(27), No.(1): 2019

 As shown is Figure 2, a zombie appears at the end of the video with sound
effects. This will terrify users and cause the changes in EEG during Event-related
potential environment. The framework is shown in Figure 3.

 Figure 2. Video used to test for brainwaves patterns during Panic Attacks

 Figure 3. Framework Model Panic Attacks Based on Event-related Potential

Panic Attacks Measurement Analysis
 After the experiment, the recorded EEG data of each user will be compared
with user’s questionnaire to consider the consistency of the measurement. The BAI
questionnaire used in this experiment consisted of 21 multiple-choice questions. This
can be used to measure the severity of anxiety in children and adults. Users need to
answer about common symptoms of anxiety such as sweating without heat or fear of
something happened. The answer will be calculated to determine the score which is
based on a scale of value 0-9 is minimal anxiety. 10-18 is mild anxiety. 19-29 is
moderate anxiety. 30-63 is severe anxiety. Score 19-63 is mild anxiety and moderate
anxiety has been suggested to detect clinically significant symptoms [20]. If the
comparison between EEG data and questionnaire results are the same, it can be
referred as the Panic Attacks symptoms.
Experimental Results
 The results of human brainwaves detection while frightened by associated
stimulation based on Event-related potential are shown in Figure 4. There are 30
participants in the experiment. The average value of participants’ Brainwaves Panic
Attacks measurement (BPAM) is at around 220 when a stimuli is presented.
However, the results found that there is one case that the brainwaves are different
 339
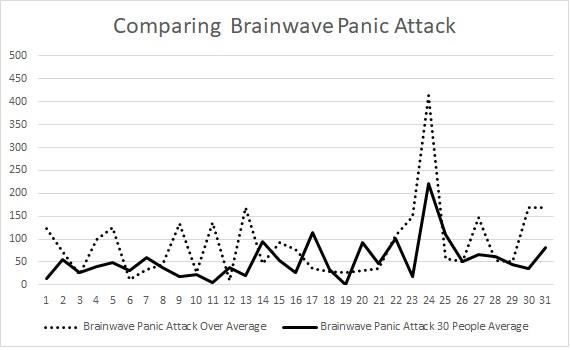
Journal of University of Babylon for Pure and Applied Sciences, Vol.(27), No.(1): 2019

from others. This leads to Panic Attacks symptoms for these participants. The steep
graph during 23-26 time unit in the experiment represents those of Case 1. It can be
seen in Figure 5. In addition, the Brainwaves Panic Attacks Measurement (BPAM)
for these cases are the highest at around 420.

 Average of brainwave Panic Attack
 500
 450
 400
 350
 Intensity

 300
 250
 200
 150
 100
 50
 0
 1 3 5 7 9 11 13 15 17 19 21 23 25 27 29 31
 Time (S)

 Figure 4. The average of brainwaves Panic Attacks of 30 participants after being
 Stimulated by Event – related potential (ERP).

 It can be seen that the fluctuation of BPAM are sideway trend. Nevertheless,
Event-Related Potential (ERP) are added and there is a change of BPAM significantly
with stimulation on pictures and sound. In addition, the BPAM values with ERP
have risen up immediately. Compared to the Beck Anxiety Inventory (BAI)
score, if the BPAM score is up to 420, it is considered as moderate anxiety.
 Brainwave Panic Attack Over Average
 500
 450
 400
 350
 Intensity

 300
 250
 200
 150
 100
 50
 0
 1 3 5 7 9 11 13 15 17 19 21 23 25 27 29 31
 Time (S)

 Figure 5. Brainwave Panic Attack of the person who made the BAI questionnaire and
 Scored 10-29 after passing the simulation Event-related potential

 The graph in Figure 6 shows the comparison between normal cases and different
cases of average BPAM. It appeared that there is significant difference in BPAM
which is derived from recorded EEG. To consider the risk of Panic Attacks in
participants, the attention value is also included in the experiment for this case. Figure
7 shows the attention value for suspected cases found in the experiment. The value of
the attention of these cases are significantly higher than the normal cases. This leads
to unable to control their mind as usual and which can be seen from the body effects.
 340
Journal of University of Babylon for Pure and Applied Sciences, Vol.(27), No.(1): 2019

Table 3 shows BPAM and BAI score from the participants. The BPAM score for
normal cases are from 80 to 400 and BAI score of this group is between 0 and 18. The
suspected to be Panic Attacks 1 cases have a BAI score more over 19 moderate to
severe anxiety which BAI score 19-63 and BPAM from 401 to 1000 and BAI score at
the third level group has been suggested to detect clinically significant symptoms.

 Figure 6..Comparison of Brainwave Panic Attacks Between Normal Cases
 and Different Cases

 Figure 7. The visual state for brainwave signals from Panic Attack
 Table III.
 The Comparison of BAI Measurement With Brainwave Panic Attacks
 BAI Score Total Student BPAM Score

 0-9 normal to minimal anxiety 22 80-200
 10-18 mild to moderate 7 201-400
 anxiety
 19-29 moderate to severe 1 401-600
 anxiety
 30-63 severe anxiety - 601-1000

 341
Journal of University of Babylon for Pure and Applied Sciences, Vol.(27), No.(1): 2019

Conclusion
 The symptoms of panic attack impact daily lives and it can also increase the
risk to other consequences. Basically, panic attacks can come from external
observation only. A questionnaire by psychiatric tests is used to observe the symptom.
This research proposed the model of brainwaves detection for panic attacks and
evaluation of the level of the symptoms based on Event-related potential (ERP). The
model can measure the level of symptoms Panic Attack using the changes in
brainwaves occurred during the simulation with pictures and sound on the
experimental group of 30 people. The survey related to symptoms has been used
regarding to the criteria of The Beck Anxiety Inventory (BAI).
 The research is measured by the EEG brainwaves from studying brainwaves
during Panic Attacks, when human’s panic and fear arise. Those are considered as the
Panic Attacks. In the experiment, the panic may be more shocked than usual, and it is
measured as a level of The Beck Anxiety Inventory (BAI) based on the criteria. The
level is from 1 to 4. The level 1 is minimal anxiety. The second level is mild anxiety.
The third level is considered as moderate anxiety and level 4 is severe anxiety. This
research can also detect and measure the brainwaves with Event-related potential
directly in order to create the Panic Attacks brainwave model. There are 22 out of 30
people in the experiment showed the brainwaves based on Gamma and Beta
wavelength using BPAM score between 80 and 200. It is considered as minimal
anxiety, whereas 7 people showed the BPAM score during 201 to 400. There is only
one person that the BPAM score was more than 400. This is moderate anxiety. The
level of severe anxiety is not found in the experiment group. Therefore, those 1 people
can be considered having Panic Attacks symptoms has been suggested to detect
clinically significant symptoms
 The research also presents that there are changes of the Beta and Gamma wave
length significantly. For the further analysis, it found that the brainwave pattern for
the
meditation had decreased but the attention had increased. The change occurred in
wave P300 which associated to external stimuli by relationship with Event-related
potential (ERP).
 For future works, the source and various types of content could have included
in the experiment to detect on the Panic Attack brainwaves. This is to find the
different situation with regards to different of brainwaves pattern on the Panic Attack
brainwaves detection. The future experiment may implement virtual reality
technology for more realistic situations. The medical records and pre-test of Panic
Attacks can be included in the primary stage of the next experiment to filter the
specific types of panic and fear. This can help more to increase accuracy in the level
of brainwaves related to Panic Attacks.

Conflict of Interests.
There are non-conflicts of interest.

References
[1] S. K. Raman, J. K. Jayaram, S. Murugan, A. Saha, and R. K. Kavitha, “Design of
 a robust method to acquire EOG signals using Bio-medical signal processing,” in
 2016 Online International Conference on Green Engineering and Technologies
 (IC-GET), 2016, pp. 1–4.
 342
Journal of University of Babylon for Pure and Applied Sciences, Vol.(27), No.(1): 2019

[2] A. Yildirim, “Analysis and classification of spelling paradigm EEG data and an
 attempt for optimization of channels used,” Ph.D. dissertation, Middle East
 Technical University, 2010.

[3] L. Grossman. “The Invention Issue Best Inventions”, TIME MAGAZINE, vol.178,
 no.21, 2011. [Online]. Available:
 http://content.time.com/time/covers/0,16641,20111128,00.html.

[4] H. Zhang, and J. Horsman. “Puzzlebox Bloom Premiere at CES 2015,” 2015
 International CES. 2015. [Online]. Available:
 https://puzzlebox.io/post/puzzlebox-bloom-premiere-ces-2015/.

[5] P. S. Kanagasabai, R. Gautam, and G. N. Rathna, “Brain-computer interface
 learning system for Quadriplegics,” in 2016 IEEE 4th International Conference
 on MOOCs, Innovation and Technology in Education (MITE), 2016, pp. 258–262.

[6] A. Kubacki, A. Jakubowski, and D. Rybarczyk, “Research on possibilities of
 transporter movement using brain-computer interface based on Steady-State
 Visually Evoked Potential (SSVEP),” in 2017 22nd International Conference on
 Methods and Models in Automation and Robotics (MMAR), 2017, pp. 218–221.

[8] Y. Hao, Z. Xu, J. Wang, Y. Liu, and J. Fan, “An approach to detect crowd panic
 behavior using flow-based feature,” in 2016 22nd International Conference on
 Automation and Computing (ICAC), 2016, pp. 462–466.

[9] M. Laytrakul & P. Suksanit, “Panic disorder”, Ramathibodi Hospital, Mahidol
 University, 2011. Retrieved January 21, 2018, from
 https://med.mahidol.ac.th/ramamental/generaldoctor/panic-disorder-2/.

[10] Jung, & Berger, “Fiftieth anniversary of Hans Berger’s publication of the
 electroencephalogram His first records in 1924–1931,” Journal of Psychiatry and
 Nervous Diseases, vol.227, 279–300, 1979.

[11] S. Finger, Origins of neuroscience: a history of explorations into brain function.
 Oxford University Press, USA, 2001.

[12] M. X. Cohen, “It’s about time,” Front. Hum. Neurosci., vol. 5, p. 2, 2011.
 Available:
https://www.ncbi.nlm.nih.gov/pmc/articles/PMC3025647/ [Accessed: January 21,
 2018].

[13] G. R. Norton, B. Harrison, J. Hauch, and L. Rhodes, “Characteristics of people
 with infrequent panic attacks.,” J. Abnorm. Psychol., vol. 94, no. 2, p. 216, 1985.

[14] M. Smith, M.A., L. Robinson, and J. Segal, “Panic Attacks and Panic Disorder,”
 2018. Available: https://www.helpguide.org/articles/anxiety/panic-attacks-and-
 panic-disorders.html [Accessed: January 21, 2018].

[15] D. H. R. Blackwood and W. J. Muir, “Cognitive brain potentials and their
 application,” Br. J. Psychiatry, vol. 157, no. S9, pp. 96–101, 1990.
 343
Journal of University of Babylon for Pure and Applied Sciences, Vol.(27), No.(1): 2019

[16] E. K. Vogel and S. J. Luck, “The visual N1 component as an index of a
 discrimination process,” Psychophysiology, vol. 37, no. 2, pp. 190–203, 2000.

[17] S. J. Luck. An Introduction to the Event-Related Potential Technique.
 Cambridge: The MIT Press. ISBN 0-262-12277-4. 2005.

[18] S. Sutton, M. Braren, J. Zubin, and E. R. John, “Evoked-potential correlates of
 stimulus uncertainty,” Science (80-. )., vol. 150, no. 3700, pp. 1187–1188, 1965.

[19] R. van Dinteren, M. Arns, M. L. A. Jongsma, and R. P. C. Kessels, “P300
 development across the lifespan: a systematic review and meta-analysis,” PLoS
 One, vol. 9, no. 2, p. e87347, 2014.

[20] L. J. Julian, “Measures of anxiety: state‐trait anxiety inventory (STAI), Beck
 anxiety inventory (BAI), and Hospital anxiety and Depression scale‐anxiety
 (HADS‐A),” Arthritis Care Res. (Hoboken), vol. 63, no. S11, pp. S467–S472,
 2011.

 344
You can also read