Two dominant patterns of low anterior resection syndrome and their effects on patients' quality of life - Nature
←
→
Page content transcription
If your browser does not render page correctly, please read the page content below
www.nature.com/scientificreports
OPEN Two dominant patterns of low
anterior resection syndrome
and their effects on patients’
quality of life
Min Jung Kim1,2, Ji Won Park1,2*, Mi Ae Lee1, Han‑Ki Lim1, Yoon‑Hye Kwon1,
Seung‑Bum Ryoo1, Kyu Joo Park1 & Seung‑Yong Jeong1,2
To identify low anterior resection syndrome (LARS) patterns and their associations with risk factors
and quality of life (QOL). This cross-sectional study analyzed patients who underwent restorative
anterior resection for left-sided colorectal cancer at Seoul National University Hospital, Seoul,
Republic of Korea. We administered LARS questionnaires to assess bowel dysfunction and quality of
life between April 2017 and November 2019. LARS patterns were classified based on factor analyses.
Variable effects on LARS patterns were estimated using logistic regression analysis. The risk factors
and quality of life associated with dominant LARS patterns were analyzed. Data of 283 patients with
a median follow-up duration of 24 months were analyzed. Major LARS was observed in 123 (43.3%)
patients. Radiotherapy (odds ratio [OR]: 2.851, 95% confidence interval [95% CI]: 2.504–43.958,
p = 0.002), low anastomosis (OR: 10.492, 95% CI: 2.504–43.958, p = 0.001), and complications (OR:
2.163, 95% CI: 1.100–4.255, p = 0.025) were independently associated with major LARS. LARS was
classified into incontinence- or frequency-dominant types. Risk factors for incontinence-dominant
LARS were radiotherapy and complications, whereas those for frequency-dominant LARS included
low tumor location. Patients with incontinence-dominant patterns showed lower emotional function,
whereas those with frequency-dominant patterns showed lower global health QOL, lower emotional,
cognitive, and social functions, and higher incidence of pain and diarrhea. Frequency-dominant LARS
had a greater negative effect on QOL than incontinence-dominant LARS. These patterns could be used
for preoperative prediction and postoperative treatment of LARS.
Rectal cancer survival rates have markedly improved as a result of advances in surveillance, surgery, and chemo-
radiotherapy. However, the functional consequences of treatment and quality of life (QOL) in survivors are often
overlooked since post-treatment surveillance has mainly focused on recurrence. The use of stapling devices and
neoadjuvant chemoradiotherapy has resulted in up to 80% of patients with rectal cancer to undergo sphincter-
preserving surgeries (SPSs), and approximately 90% of these patients experienced bowel dysfunction following
SPS1.
Common symptoms of bowel dysfunction following SPS include urgency, clustering, evacuation difficulty
or incomplete emptying, and flatus or fecal incontinence. Over 40% of patients have been reported to become
“toilet dependent,” which can have devastating consequences on a patients’ physical, social, occupational, and
psychological functioning and significantly decreases their Q OL2,3. The effects of bowel dysfunction that occur
following surgeries for rectal cancer can persist even after long-term follow-up4.
Low anterior resection (LAR) syndrome (LARS) specifically refers to the bowel dysfunction following rectal
cancer resection5. The evaluation of LARS varies considerably between studies, and the majority of previous
studies focused on incontinence, rather than on other symptoms, such as frequency, clustering, incomplete
emptying, and QOL. To overcome these limitations, the following two questionnaires were specifically developed
to assess LARS symptoms: Memorial Sloan Kettering Cancer Center Bowel Function Instrument (MSKCC BFI)
and LARS s core6,7. The LARS questionnaire is shorter than the MSKCC BFI, and provides higher clinical utility
1
Department of Surgery, Seoul National University College of Medicine, 101, Daehak‑ro Jongno‑gu, Seoul 03080,
Republic of Korea. 2Cancer Research Institute, Seoul National University, Seoul, Korea. *email: sowisdom@
snu.ac.kr
Scientific Reports | (2021) 11:3538 | https://doi.org/10.1038/s41598-021-82149-9 1
Vol.:(0123456789)www.nature.com/scientificreports/
by allowing rapid stratification of patients into no, minor, and major LARS groups. The LARS questionnaire was
published in 2012, and translated versions have been validated i nternationally8,9.
Identifying patients at a high risk of major LARS is crucial when deciding between abdominoperineal resec-
tion (APR) with permanent colostomy and SPS procedures. Furthermore, classifying major patterns associated
with LARS would be helpful in symptom management. However, even rectal cancer specialists may not be fully
aware of LARS symptoms that patients consider to be the most bothersome; thus, they have difficulty identify-
ARS10. This study aimed to evaluate LARS risk factors using data gathered from
ing patients at risk for major L
patients undergoing long-term follow-up after rectal cancer surgery, and to identify patterns associated with
LARS based on the major symptoms and their subsequent effects on QOL.
Materials and methods
Study design. This cross-sectional study was performed at the Seoul National University Hospital, Seoul,
Republic of Korea and approved by the Institutional Review Board of this institution (IRB protocol number:
2007-012-1138). All research was performed in accordance with relevant guidelines/regulations. The require-
ment for obtaining patients’ informed consent was waived by the Institutional Review Board of this institution
because the risk of this study on patients was minimal, and the information was collected for clinical use.
Patients. Between April 2017 and November 2019, the LARS questionnaire was administered to patients
in an outpatient clinic who underwent surgeries for restorative anterior resection (AR) for left-sided colorectal
cancer. The inclusion criteria were those who underwent AR, LAR, and intersphincteric resections via open,
laparoscopic, and robotic approaches. Patients who underwent trans-anal excision and total or subtotal colec-
tomy were excluded.
LARS questionnaire. Bowel function impairment was assessed using the LARS questionnaire, which
assesses the following five items: incontinence for flatus, incontinence for liquid stools, frequency, clustering,
and urgency. Each item carries three options with predefined scores used for evaluating severity. According to
the total scores, patients were classified into the no (0–20), minor (21–29), and major (30–42) LARS groups. We
used the validated Korean version of the q uestionnaire11. Correlations between the fecal incontinence severity
index (FISI) and LARS groups were analyzed to validate the utility of the LARS questionnaire score.
Patient demographic, perioperative, and pathological data were obtained from the prospectively maintained
database and compared among the no, minor, and major LARS groups. Variables demonstrating significant dif-
ferences among the groups were used in the multivariable analysis to identify independent risk factors associated
with major LARS.
QOL questionnaires. The Korean versions of the European Organization for Research and Treatment of
Cancer Quality of Life Questionnaire-C30 (EORTC QLQ-C30), European Organization for Research and Treat-
ment of Cancer Questionnaire Module for Colorectal Cancer (EORTC QLQ-CR29), FISI, and Fecal Inconti-
nence Quality of Life (FIQL) were used to evaluate the effects of LARS symptoms on postoperative QOL, and
findings were compared among the three LARS groups.
LARS pattern assessment. Patterns associated with LARS were determined using an exploratory
approach with principal axis factoring analyses that were performed on the five LARS questionnaire items in
the minor and major LARS groups. Extraction of the principal components was followed by varimax rotation
to achieve a structure with independent factors and greater potential for interpretability. We used the minimum
eigen values of 1.0, screen plot, and interpretability of the factors to determine which factors should be retained
with regard to the LARS patterns. A factor score was calculated for each LARS pattern, and the score of each pat-
tern was categorized into two quantiles, designated as low or high patterns. To identify the risk factors of minor
and major LARS based on the observed patterns, the multivariable analysis was adjusted for potential risk factors
found in the highest quintile of each LARS pattern.
Statistical analysis. Continuous variables are presented as mean with standard deviations or median
(minimum–maximum range) based on the normality of distributions, whereas categorical variables are pre-
sented as frequency (percentage). Continuous variables were compared using one-way analysis of variance or
Kruskal–Wallis test, and categorical variables were compared using the chi-squared or Fisher’s exact tests.
Univariable and multivariable analyses were used to investigate the effects of each factor on major LARS,
compared with no or minor LARS. The risk factors were estimated using odds ratios (ORs) calculated with
logistic regression analyses. A backward selection model was used to select the variables for the multivariable
model. All results with two-tailed p-values < 0.05 were considered to be statistically significant. The statistical
analyses were performed using SPSS version 25 (IBM Inc., Armonk, NY, USA).
Results
Baseline demographics and tumor characteristics. Altogether, 283 patients were analyzed. There
were 101 (35.7%), 60 (21.2%), and 123 (43.5%) patients in the no, minor, and major LARS groups, respec-
tively, with median LARS scores of 13 (0–20), 26 (21–29), and 37 (30–41), respectively. The overall median time
between surgery and questionnaire administration was 24 (range: 0–181) months. The stratified median time to
questionnaire administration was 23 (range: 0–181), 20 (range: 0–120), and 28 (range: 0–115) months in the no,
minor, and major LARS groups, respectively (p = 0.855).
Scientific Reports | (2021) 11:3538 | https://doi.org/10.1038/s41598-021-82149-9 2
Vol:.(1234567890)www.nature.com/scientificreports/
No LARS (n = 101) Minor LARS (n = 60) Major LARS (n = 123) p
Age, years (%)
Mean (SD) 61.7 (9.0) 58.4 (10.2) 58.9 (11.0) 0.067
≤ 60 51 (33.8) 32 (21.2) 68 (45.0) 0.774
> 60 50 (37.6) 28 (21.1) 55 (41.4)
Sex (%) 0.961
Male 72 (35.8) 43 (21.4) 86 (42.8)
Female 29 (34.9) 17 (20.5) 37 (44.6)
Mean BMI, kg/m2 (SD) 23.9 (2.9) 23.9 (3.3) 23.9 (3.2) 0.987
ASA class (%) 0.918
1 33 (35.1) 21 (22.3) 40 (42.6)
2 64 (35.6) 38 (21.1) 78 (43.3)
3 4 (44.4) 1 (11.1) 4 (44.4)
4 0 (0) 0 (0) 1 (100)
Diabetes (%) 0.778
No 82 (34.9) 49 (20.9) 104 (44.3)
Yes 19 (38.8) 11 (22.4) 19 (38.8)
Hypertension (%) 0.318
No 60 (32.6) 39 (21.2) 85 (46.20
Yes 41 (41.0) 21 (21.0) 38 (38.0)
Heart disease (%) 0.716
No 95 (35.4) 57 (21.3) 116 (43.3)
Ischemic heart disease 3 (30.0) 3 (30.0) 4 (40.0)
Arrhythmia 3 (60.0) 0 (0) 2 (40.0)
Both 0 (0) 0 (0) 1 (100.0)
Pulmonary disease (%) 0.837
No 94 (35.9) 57 (21.8) 111 (42.4)
Obstructive lung disease 1 (33.3) 1 (33.3) 1 (33.3)
Tuberculosis 6 (35.3) 2 (11.8) 9 (52.9)
Others 0 (0) 0 (0) 1 (100.0)
Liver disease (%) 0.933
No 97 (35.3) 59 (21.5) 119 (43.3)
Liver cirrhosis 3 (42.9) 1 (14.3) 3 (42.9)
HBV hepatitis 1 (50.0) 0 (0) 1 (50.0)
Smoking (%) 0.131
No 74 (36.8) 38 (18.9) 89 (44.3)
Ex-smoker 11 (47.8) 7 (30.4) 5 (21.7)
Current smoker 16 (26.7) 15 (25.0) 29 (48.3)
Alcohol (%) 0.899
No 57 (35.0) 34 (20.9) 72 (44.2)
Ex drinker 5 (50.0) 2 (20.0) 3 (30.0)
Current drinker 39 (35.1) 24 (21.6) 48 (43.2)
Table 1. Baseline characteristics. LARS low anterior resection syndrome, SD standard deviation, BMI body
mass index, ASA American Society of Anesthesiology, HBV hepatitis B virus.
Baseline demographic data were not significantly different among the three groups (Table 1). The tumors
were located lower in the major LARS group than in the no and minor LARS groups (Table 2). Preoperative
radiotherapy was administered more frequently in the major LARS group than in the other groups [14 (17.3%) no
LARS, 13 (16.0%) minor LARS, and 54 (66.7%) major LARS group; p < 0.0001]. Major LARS was observed in 10
(15.2%), 82 (48.5%), and 31 (63.3%) patients who underwent AR, LAR, and ultralow anterior resection (ULAR),
respectively (p < 0.0001). Diverting stoma formation was more frequently performed in the major LARS group
[24 (24.2%) no LARS, 14 (14.1%) minor LARS, 61 (61.6%) major LARS; p < 0.0001). The anastomosis technique
was not related to LARS occurrence (p = 0.165). The major LARS group had more postoperative complications
than the other groups (p = 0.021). The mean time from surgery to stoma repair was not significantly different
among the groups.
LARS questionnaire. Except for the frequency subscale (p = 0.498), all other subscales were significant dif-
ferent among the three LARS groups (all p < 0.0167; see Table, Supplemental Digital Content 1, which displays
Scientific Reports | (2021) 11:3538 | https://doi.org/10.1038/s41598-021-82149-9 3
Vol.:(0123456789)www.nature.com/scientificreports/
No LARS (n = 101) Minor LARS (n = 60) Major LARS (n = 123) p
Median pretreatment CEA (range) 1.9 (0.4–185.6) 2.0 (0.4–181.0) 1.8 (0.4–125.4) 0.549
Location of tumor (%) < 0.001
Sigmoid colon 37 (59.7) 13 (21.0) 12 (19.4)
Rectosigmoid colon 15 (34.1) 15 (34.1) 14 (31.8)
Rectum 49 (27.5) 32 (18.0) 97 (54.5)
Tumor location from the anal verge, cm (%)a < 0.001
15–20 36 (59.0) 15 (24.6) 10 (16.4)
11–15 18 (31.0) 18 (31.0) 22 (37.9)
6–10 33 (32.0) 15 (14.6) 55 (53.4)
0–5 11 (19.6) 11 (19.6) 34 (60.7)
AJCC stage of tumor (%) 0.206
0 1 (6.3) 3 (18.8) 12 (75.0)
1 36 (37.9) 21 (22.1) 38 (40.0)
2 27 (35.1) 17 (22.1) 33 (42.9)
3 37 (38.5) 19 (19.8) 40 (41.7)
Tumor classification (%) 0.169
T0 1 (8.3) 3 (25.0) 8 (66.7)
Tis 0 (0) 0 (0) 5 (100.0)
T1 25 (39.7) 13 (20.6) 25 (39.7)
T2 18 (32.7) 10 (18.2) 27 (49.1)
T3 50 (37.0) 31 (23.0) 54 (40.0)
T4 7 (50.0) 3 (21.4) 4 (28.6)
Nodal classification (%) 0.694
N0 64 (34.0) 41 (21.8) 83 (44.1)
N1 32 (41.6) 14 (18.2) 31 (40.3)
N2 5 (26.3) 5 (26.3) 9 (47.4)
Preoperative radiotherapy (%) 14 (17.3) 13 (16.0) 54 (66.7) < 0.001
Operative name (%) < 0.001
Anterior resection 42 (63.6) 14 (21.2) 10 (15.2)
Low anterior resection 48 (28.4) 39 (23.1) 82 (48.5)
Ultralow anterior resection 11 (22.4) 7 (14.3) 31 (63.3)
Combined operation (%) 31 (30.7) 21 (35.0) 60 (48.8) 0.016
No 70 (40.7) 39 (22.7) 63 (36.6)
Pelvic organ resection/lateral lymph node dissection 5 (17.9) 8 (28.6) 15 (53.6)
Others 26 (31.0) 13 (15.5) 45 (53.6)
Operative approach (%) 0.147
Open 31 (30.4) 19 (18.6) 52 (51.0)
Minimally invasive surgery 70 (38.5) 41 (22.5) 71 (39.0)
Median operative time, min (range) 155.0 (63.0–390.0) 164.5 (60.0–396.0) 175.0 (56.0–528.0) 0.063
Diversion (%) 24 (24.2) 14 (14.1) 61 (61.6) < 0.001
Anastomosis (%) 0.165
End-to-end double stapling 81 (38.4) 44 (20.9) 86 (40.8)
Side-to-end double stapling 7 (21.9) 5 (15.6) 20 (62.5)
End-to-end hand sewn 13 (31.7) 11 (26.8) 17 (41.5)
Mean postoperative hospital stay, days (SD) 7 (4–30) 7 (4–14) 7 (4–30) 0.224
Postoperative complication (%) 13 (25.5) 7 (13.7) 31 (60.8) 0.021
Wound problem 3 (23.1) 1 (7.7) 9 (69.2) 0.144
Ileus 6 (35.3) 2 (11.8) 9 (52.9) 0.566
Deep organ infection 0 (0) 1 (20.0) 4 (80.0) 0.183
Anastomosis leak 0 (0) 0 (0) 4 (100.0) 0.070
Pulmonary problem 0 (0) 2 (25.0) 6 (75.0) 0.087
Urinary problem 1 (11.1) 2 (22.2) 6 (66.7) 0.254
Chyle ascites 1 (33.3) 1 (33.3) 1 (33.3) 0.866
Thrombocytosis 1 (100.0) 0 (0) 0 (0) 0.403
Stoma-related problem 1 (100.0) 0 (0) 0 (0) 0.403
Nerve injury 0 (0) 0 (0) 1 (100.0) 0.403
Continued
Scientific Reports | (2021) 11:3538 | https://doi.org/10.1038/s41598-021-82149-9 4
Vol:.(1234567890)www.nature.com/scientificreports/
No LARS (n = 101) Minor LARS (n = 60) Major LARS (n = 123) p
Renal problem 0 (0) 0 (0) 1 (100.0) 0.403
Mean time from surgery to stoma repair, days (SD) 182.3 (70.1) 170.1 (59.4) 210.3 (83.3) 0.119
Table 2. Tumor characteristics and perioperative data. LARS low anterior resection syndrome,
CEA carcinoembryonic antigen, AJCC American Joint Committee on Cancer, SD standard deviation. a 278
patients.
Figure 1. Fecal incontinence severity index according to the severity of low anterior resection syndrome.
LARS, low anterior resection syndrome. Figure was generated using GraphPad Prism version 8.4.2 for macOS,
GraphPad Software, San Diego, California USA, https://www.graphpad.com.
Variables OR 95% CI p
Preoperative radiotherapy
No 1
Yes 2.660 1.404–5.040 0.003
Operative name
Anterior resection 1
Low anterior resection 4.511 1.972–10.323 < 0.001
Ultralow anterior resection 5.293 1.825–15.348 0.002
Complication
No 1
Yes 2.156 1.103–4.214 0.025
Table 3. Multivariable analysis for risk factors of major low anterior resection syndrome. OR odds ratio,
CI confidence interval.
all five subscales of the LARS questionnaire correlated with no, minor, and major LARS). The major LARS group
had significantly higher FISI scores than the other groups (p = 0.0014 for no versus major LARS; and p = 0.0398
for minor versus major LARS, Fig. 1).
Risk factors for LARS. In the multivariable analysis, preoperative radiotherapy (OR: 2.660, 95% confidence
interval [CI]: 1.404–5.040, p = 0.003), LAR with low anastomosis (OR: 5.293, 95% CI: 1.825–15.348, p = 0.002),
and postoperative complications (OR: 2.156, 95% CI: 1.103–4.214, p = 0.025) were independently associated
with major LARS (Table 3).
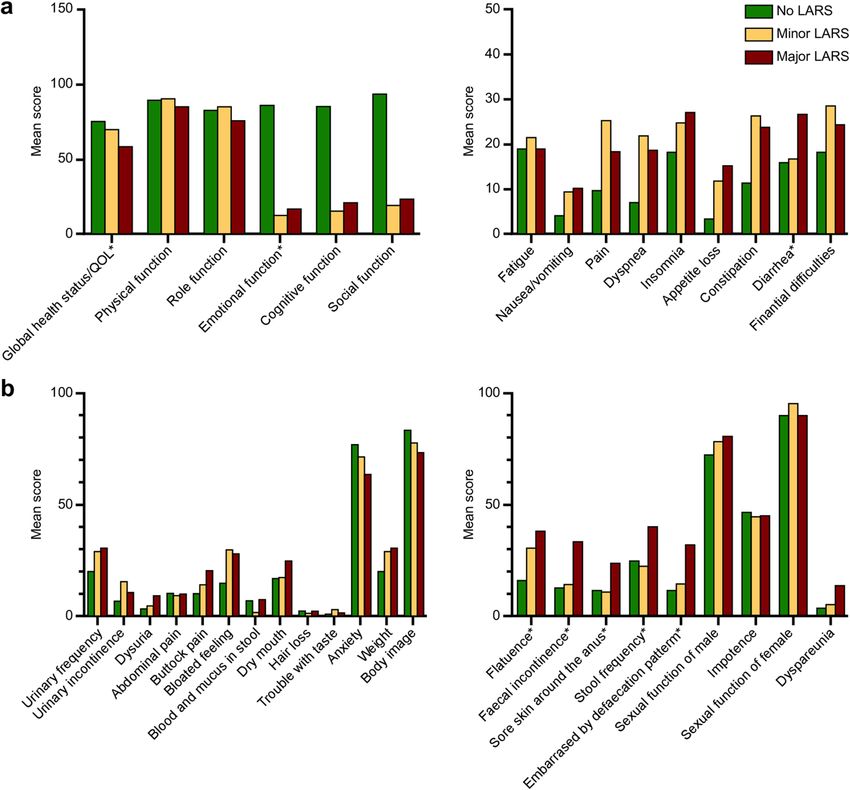
QOL and LARS. In the QOL analysis of 105 patients, the LARS groups with higher scores showed a lower
global health status or QOL (p = 0.002), lower emotional function (p = 0.023), and a higher incidence of diar-
rhea (p = 0.028) in the EORTC QLQ-C30 than groups with lower scores (Fig. 2a). In the EORTC QLQ-CR29,
defecation-related symptoms, including flatulence (p = 0.001), fecal incontinence (p < 0.001), sore skin around
Scientific Reports | (2021) 11:3538 | https://doi.org/10.1038/s41598-021-82149-9 5
Vol.:(0123456789)www.nature.com/scientificreports/
Figure 2. Quality of life according to no, minor, and major low anterior resection syndrome. (a) EORTC QLQ-
C30 according to no, minor, and major low anterior resection syndrome. (b) EORTC QLQ-CR29 according to
no, minor, and major low anterior resection syndrome. Asterisk: Overall p < 0.05. EORTC QLQ-C30, European
Organization for Research and Treatment of Cancer Quality of Life Questionnaire; EORTC QLQ-CR29,
European Organization for Research and Treatment of Cancer Questionnaire Module for Colorectal Cancer;
LARS, low anterior resection syndrome; QOL, quality of life.
the anus (p = 0.015), stool frequency (p < 0.001), and embarrassed by defecation pattern (p < 0.001), were signifi-
cantly higher in the major LARS group than in the no and minor LARS groups (Fig. 2b).
In the FIQL analysis, the major LARS group had worse QOL-related fecal incontinence in all four factors,
including lifestyle, coping behavior, depression/self-perception, and embarrassment, compared to the no LARS
group (all p < 0.05), and worse coping behavior (p = 0.0386) and embarrassment (p = 0.0221), compared to the
minor LARS group (Fig. 3). No statistically significant differences in the four factors were observed between the
no and minor LARS groups.
LARS patterns. In patients with minor or major LARS, two dominant patterns were derived from the
exploratory factor analysis and factor loading matrix using a rotated component matrix (See table, Supplemental
Digital Content 2, which includes the factor loading matrix using a rotated component matrix for the two domi-
nant patterns identified by factor analysis). The factors were interpreted as LARS patterns and named based on
the LARS groups with high factor loading (Supplemental Digital Content 3). Pattern 1 was termed the inconti-
nence-dominant pattern since it demonstrated high loading of incontinence LARS subscales, including inconti-
Scientific Reports | (2021) 11:3538 | https://doi.org/10.1038/s41598-021-82149-9 6
Vol:.(1234567890)www.nature.com/scientificreports/
Figure 3. Fecal incontinence quality of life according to no, minor, and major low anterior resection syndrome.
LARS, low anterior resection syndrome. Figure was generated using GraphPad Prism version 8.4.2 for macOS,
GraphPad Software, San Diego, California USA, https://www.graphpad.com.
Variables OR 95% CI p
Pattern 1: incontinence dominant LARS
Preoperative radiotherapy
No 1
Yes 3.334 1.745–6.369 < 0.0001
Complication
No 1
Yes 2.194 1.012–4.757 0.047
Pattern 2: frequency dominant LARS
Tumor location from the anal verge, cm (%)
15–20 1
11–15 2.528 0.719–8.888 0.148
6–10 9.450 2.916–30.622 < 0.0001
0–5 8.647 2.534–29.506 0.001
Table 4. Multivariable analysis for risk factors of minor or major LARS according to LARS patterns. LARS low
anterior resection syndrome, CI confidence interval, OR odds ratio.
nence for flatus and liquid stools. Pattern 2 was termed the frequency-dominant pattern because it demonstrated
high loading for symptoms related to frequency, including subscales of frequency, urgency, and clustering.
Risk factors associated with LARS patterns. After dividing the patients into the low- or high-score
groups based on each LARS pattern, ORs (95% CI) were obtained to explain the risk factors associated with each
LARS pattern after adjusting for potential cofounders (Table 4). The adjusted variables entered in the analysis
were age, sex, ASA class, tumor location from the anal verge, type of surgery, combined surgeries, diversion,
postoperative complications, AJCC tumor stage, and surgical approach. Preoperative radiotherapy and postop-
erative complications were associated with incontinence-dominant LARS, whereas tumor location from the anal
verge were associated with frequency-dominant LARS.
QOL and LARS patterns. To analyze the effects of each LARS pattern on a patient’s QOL, the EORTC
QLQ-C30 scores were compared between the low- and high-score groups (n = 76, Fig. 4). Only emotional func-
tion was associated with the incontinence-dominant LARS pattern, whereas global health status/QOL, emo-
tional and social functions, pain, and diarrhea were associated with the frequency-dominant LARS pattern.
Discussion
Our study found that preoperative radiotherapy, low rectal cancer, and postoperative complications were inde-
pendent risk factors for major LARS. LARS was classified into incontinence- and frequency-dominant pat-
terns, with each pattern being related to different risk factors. The incontinence-dominant pattern was related
to preoperative radiotherapy and postoperative complications, whereas the frequency-dominant pattern was
Scientific Reports | (2021) 11:3538 | https://doi.org/10.1038/s41598-021-82149-9 7
Vol.:(0123456789)www.nature.com/scientificreports/
Figure 4. EORTC QLQ-C30 according to low anterior resection syndrome patterns. (a) EORTC QLQ-C30
according to low and high incontinence-dominant low anterior resection syndrome. (b) EORTC QLQ-C30
according to low and high frequency dominant low anterior resection syndrome. Asterisk: Overall p < 0.05.
EORTC QLQ-C30, European Organization for Research and Treatment of Cancer Quality of Life Questionnaire;
EORTC QLQ-CR29, European Organization for Research and Treatment of Cancer Questionnaire Module for
Colorectal Cancer; SD, standard deviation.
related to a low tumor location from the anal verge. Overall, major LARS was associated with a worse QOL, and
frequency-dominant LARS had more profound effects on postoperative QOL.
LARS attenuates the relative SPS benefits achieved by preserving the anus when compared to APR. SPS
restores bowel continuity, yet there is no clear evidence available with regard to the differences in QOL between
patients who underwent SPS and those who underwent APR 3,12,13. The similarities in patient-reported QOL may
be partly attributed to postoperative bowel dysfunction, since 50%–90% of patients who undergo SPS for low
rectal cancers with anastomosis close to the anus experience some degrees of postoperative bowel dysfunction.
Preoperative radiotherapy is frequently performed in patients with mid-to-low rectal cancers, and postopera-
tive complications, such as anastomosis leakage, are more common in low-lying tumors following radiotherapy,
which exacerbates postoperative bowel dysfunction.
In general, LARS improves over time, especially within 6 months postoperatively. However, afterwards, LARS
symptoms and the impact on patients’ QOL persist over time 4. Pieniowski et al. measured LARS and QOL ques-
tionnaires at 2 time points and found that there was no significant difference. In Denmark study, the time since
surgery showed no association with major LARS (OR = 0.78, 95CI = 0.59–1.04)14. A review on LARS commented
eriod1.
that LARS results in permanent changes rather than short-lived neorectal irritability in the postoperative p
Although we did not measure LARS score twice in the same patients, the prevalence of major LARS score were
not significantly different over time.
Low anastomosis and preoperative radiotherapy are the two main factors for postoperative bowel dysfunction
and have been previously reported as independent risk factors6,13–17. In a cross-sectional study by Trenti et al.,
neoadjuvant radiotherapy (OR: 2.38, p = 0.048) and coloanal anastomosis (versus colorectal anastomosis, OR:
ARS13. Sun et al. reported that long-term
3.82, p = 0.005) were identified as significant risk factors for major L
preoperative radiotherapy (OR: 2.20, p = 0.007) and anastomosis height (OR: 0.74, p < 0.001) were also independ-
ARS18. A cross-sectional multi-center cohort study identified major LARS in 60% of
ent risk factors for major L
patients with low rectal cancer treated with preoperative radiotherapy compared to only 33% of patients with
middle or upper rectal cancers without preoperative radiotherapy15. In a meta-analysis that analyzed 11 studies
between 2005 and 2017, radiotherapy in either preoperative or postoperative regimens were the most significant
Scientific Reports | (2021) 11:3538 | https://doi.org/10.1038/s41598-021-82149-9 8
Vol:.(1234567890)www.nature.com/scientificreports/
risk factor for major LARS in eight studies, and tumor height (anastomosis level) was the second most significant
risk factor of major LARS in six s tudies16.
Identification of LARS risk factors allows for the prediction of the degree of postoperative bowel dysfunction
and QOL impairment, which can help preoperatively counsel patients regarding the decision of preserving the
sphincter. In our study, 65.9% and 46.7% of patients with rectal cancer located within 5 cm of the anal verge
with and without preoperative radiotherapy, respectively, developed major LARS, whereas 26.7% and 16.4%
of patients with rectal cancer located > 10 cm from the anal verge with and without preoperative radiotherapy,
respectively, developed major LARS. The pre-operative LARS score (POLARS) nomogram was developed by the
United Kingdom and Danish LARS study group to predict the risk for LARS occurrence. Predictive factors used
in the POLARS are age, tumor height, total mesorectal excision versus partial mesorectal excision, stoma, and
preoperative radiotherapy, with tumor height and preoperative radiotherapy having the greatest contribution
to a high expected LARS s core19. Only preoperative factors were used in POLARS, because it was developed for
efficient preoperative prediction of LARS; thus, the postoperative complications that were found to be significant
risk factors for LARS in our study were not considered in the design of POLARS. A stoma was believed to be
related to disuse colitis, which might result in bowel dysfunction following stoma repair20; however, stoma was
not a significant risk factor in our multivariable analysis, and the time interval from SPS and stoma repair was
not related to a higher prevalence of major LARS. Stoma may be a confounding factor with low anastomosis
and preoperative radiotherapy, and stoma-related bowel dysfunction may be transient following stoma repair.
In the original study that developed and validated LARS questionnaire, there was a significant difference in
QOL between no, minor, and major LARS g roup7. But, in this study, a simple question, “On overall, how much
is your QoL influenced by your bowel dysfunction?”, was used to assess the impact of LARS on QOL. In a sub-
sequent study involving 5 centers in 4 European countries, EORTC QLQ-C30 was used, and from analysis of
796 patients, patients with major LARS showed worse QOL in all subscales except c onstipation2. Although a few
scales showed significant differences between no and minor LARS, the differences were too small to be considered
clinically relevant, and therefore, the authors commented that no and minor LARS groups could be regarded
comparable, and major LARS are the ones who need attention. These findings were in line with our results.
The challenges of LARS treatment may be due to the poor understanding of the underlying mechanisms and
consequent variety of associated symptoms. In 2019, McKenna suggested that the treatment choice for LARS
should be based on the predominant symptoms, and minor LARS cases were classified into diarrhea-dominant,
incontinence-dominant, and urgency-dominant groups21. In this treatment algorithm, diarrhea-predominant
minor LARS can be treated with anti-diarrheal and bulking agents, and incontinence- and urgency-predominant
minor LARS can be treated with serotonin-3 receptor antagonists. Major LARS was not classified in that study,
and suggested treatments included transanal irrigation, sacral nerve stimulation, and transition to a permanent
stoma. However, this classification was not based on patient data and mainly focused on currently available
treatment options, rather than on symptoms with major effects on QOL. A previous review article provided two
pragmatic definitions of LARS symptoms, including urgency or fecal incontinence and evacuatory dysfunction1.
It suggested that urgency or fecal incontinence might be related to anal sphincter damage and preoperative
radiotherapy; both symptoms corresponded to our incontinence-dominant LARS. The other main symptom,
evacuatory dysfunction, is a possible consequence of impairments in the autonomic nerve supply to the rectum,
resulting in a loss of rectal coordination and paradoxical anal contraction. Patients with LARS often have fre-
quent bowel movements because of tenesmus caused by incomplete emptying, and these symptoms also relate to
clustering, defined as the bowel evacuation within an hour of the previous evacuation, leading to the complaint
of frequent bowel movements. Therefore, the second classification using evacuatory dysfunction corresponds to
our frequency-dominant LARS classification. Although evacuatory dysfunction has not been as well studied as
the previously mentioned incontinence pattern, the symptoms of frequency and clustering had more negative
effects on patient QOL than symptoms of incontinence symptoms in our study. Therefore, future studies should
focus on these symptoms and associated treatments.
Our study has several strengths. It is the first study to classify the minor and major LARS types based on
patient data. It also demonstrates that the different patterns are related to varying risk factors with diverse effects
on QOL. Follow-up studies are warranted to validate our findings in other datasets to allow for patient care to
be focused on observed LARS patterns. Second, many risk factors that could be associated with major LARS
were comprehensively analyzed. From our prospective database, we extracted as many variables as possible for
analysis as possible risk factors.
This study also has several limitations, including the lack of baseline data available on patient LARS status and
QOL measures. A recent report on normative LARS data found that even patients who did not undergo surgery
could present with LARS symptoms22. Therefore, future studies should collect baseline data to better distinguish
the effects of surgery on bowel dysfunction. Second, the medication information about antidiarrheal medica-
tions were not collected in this study. Antidiarrheal medications such as loperamide were frequently prescribed
in LARS patients and could affect the frequency score in LARS questionnaire. Patients are often prescribed not
only in our hospital, but also in other clinics, and take the drug by adjusting its dose according to their symp-
toms. Therefore, to collect accurate data on LARS medications, data should be collected prospectively or from
nationwide prescription database.
In conclusion, we demonstrated that the risk factors associated with major LARS include preoperative radio-
therapy, sphincter-saving surgery with low anastomosis, and postoperative complications. We classified LARS
into either incontinence-dominant or frequency-dominant patterns based on symptoms. The incontinence-dom-
inant pattern was related to preoperative radiotherapy and postoperative complications, whereas the frequency-
dominant pattern was related to low tumor location. Frequency-dominant LARS had more profound associations
with poor QOL. Ultimately, using these new LARS classifications could be useful in LARS management.
Scientific Reports | (2021) 11:3538 | https://doi.org/10.1038/s41598-021-82149-9 9
Vol.:(0123456789)www.nature.com/scientificreports/
Received: 14 September 2020; Accepted: 14 January 2021
References
1. Bryant, C. L. C. et al. Anterior resection syndrome. Lancet Oncol. 13, e403-408 (2012).
2. Juul, T. et al. Low anterior resection syndrome and quality of life: An international multicenter study. Dis. Colon Rectum. 57,
585–591 (2014).
3. Pachler J, Wille-Jorgensen P. Quality of life after rectal resection for cancer, with or without permanent colostomy. Cochrane
Database Syst. Rev. CD004323 (2004).
4. Pieniowski, E. H. A. et al. Low anterior resection syndrome and quality of life after sphincter-sparing rectal cancer surgery: A
long-term longitudinal follow-up. Dis. Colon Rectum. 62, 14–20 (2019).
5. Keane, C. et al. Defining low anterior resection syndrome: A systematic review of the literature. Colorectal Dis. 19, 713–722 (2017).
6. Stephens, R. J. et al. Impact of short-course preoperative radiotherapy for rectal cancer on patients’ quality of life: data from the
Medical Research Council CR07/National Cancer Institute of Canada Clinical Trials Group C016 randomized clinical trial. J. Clin.
Oncol. 28, 4233–4239 (2010).
7. Emmertsen, K. J. & Laurberg, S. Low anterior resection syndrome score: Development and validation of a symptom-based scoring
system for bowel dysfunction after low anterior resection for rectal cancer. Ann. Surg. 255, 922–928 (2012).
8. Juul, T. et al. International validation of the low anterior resection syndrome score. Ann. Surg. 259, 728–734 (2014).
9. Juul, T. et al. Validation of the English translation of the low anterior resection syndrome score. Colorectal Dis. 17, 908–916 (2015).
10. Chen, T. Y. T., Emmertsen, K. J. & Laurberg, S. Bowel dysfunction after rectal cancer treatment: A study comparing the specialist’s
versus patient’s perspective. BMJ Open. 4, e003374 (2014).
11. Kim, C. W. et al. Validation of the Korean version of the low anterior resection syndrome score questionnaire. Ann. Coloproctol.
36, 83–87 (2020).
12. Cornish, J. A. et al. A meta-analysis of quality of life for abdominoperineal excision of rectum versus anterior resection for rectal
cancer. Ann. Surg. Oncol. 14, 2056–2068 (2017).
13. Trenti, L. et al. Quality of life and anterior resection syndrome after surgery for mid to low rectal cancer: A cross-sectional study.
Eur. J. Surg. Oncol. 44, 1031–1039 (2018).
14. Bregendahl, S. et al. Bowel dysfunction after low anterior resection with and without neoadjuvant therapy for rectal cancer: A
population-based cross-sectional study. Colorectal Dis. 15, 1130–1139 (2013).
15. Battersby, N. J. et al. Predicting the risk of bowel-related quality-of-life impairment after restorative resection for rectal cancer: A
multicenter cross-sectional study. Dis. Colon Rectum. 59, 270–280 (2016).
16. Croese, A. D. et al. A meta-analysis of the prevalence of low anterior resection syndrome and systematic review of risk factors. Int.
J. Surg. 56, 234–241 (2018).
17. Bondeven, P. et al. Neoadjuvant therapy abolishes the functional benefits of a larger rectal remnant, as measured by magnetic
resonance imaging after restorative rectal cancer surgery. Eur. J. Surg. Oncol. 41, 1493–1499 (2015).
18. Sun, W. et al. Impact of long-course neoadjuvant radiation on postoperative low anterior resection syndrome and quality of life
in rectal cancer: Post hoc analysis of a randomized controlled trial. Ann. Surg. Oncol. 26, 746–755 (2019).
19. Battersby, N. J. et al. Development and external validation of a nomogram and online tool to predict bowel dysfunction following
restorative rectal cancer resection: The POLARS score. Gut 67, 688–696 (2018).
20. Roe, A. M. et al. Diversion colitis and involution of the defunctioned anorectum. Gut 34, 382–385 (1993).
21. McKenna, N. P. Low anterior resection syndrome. Dis. Colon Rectum. 62, 1420–1422 (2019).
22. Juul, T. et al. Normative data for the low anterior resection syndrome score (LARS Score). Ann. Surg. 269, 1124–1128 (2019).
Author contributions
Concept and design: S.-Y.J., S.-B.R., J.W.P., Y.-H.K., and H.-K.L. Acquisition, analysis, or interpretation of data:
all authors. Drafting of the manuscript: S.-Y.J., J.W.P., M.J.K., and H.-K.L. Critical revision of the manuscript for
important intellectual content: S.-Y.J., S.-B.R., J.W.P., and M.J.K. Statistical analysis: M.J.K. and M.A.L. Obtained
funding: S.-Y.J., J.W.P., and M.J.K. Administrative, technical, or material support: K.J.P., S.-Y.J., S.-B.R., J.W.P.,
and M.A.L. Supervision: S.-Y.J., J.W.P., and H.-K.L.
Funding
The authors state that there are no financial interests that might benefit from the publication of this article or
conflicts of interest related to this manuscript. The study was supported by a grant from Seoul National University
Hospital (Number 0420180530). The funding body had no role in the design and conduct of the study; collection,
management, analysis, and interpretation of the data; preparation, review, or approval of the manuscript; or the
decision to submit the manuscript for publication.
Competing interests
The authors declare no competing interests.
Additional information
Supplementary Information The online version contains supplementary material available at https://doi.
org/10.1038/s41598-021-82149-9.
Correspondence and requests for materials should be addressed to J.W.P.
Reprints and permissions information is available at www.nature.com/reprints.
Publisher’s note Springer Nature remains neutral with regard to jurisdictional claims in published maps and
institutional affiliations.
Scientific Reports | (2021) 11:3538 | https://doi.org/10.1038/s41598-021-82149-9 10
Vol:.(1234567890)www.nature.com/scientificreports/
Open Access This article is licensed under a Creative Commons Attribution 4.0 International
License, which permits use, sharing, adaptation, distribution and reproduction in any medium or
format, as long as you give appropriate credit to the original author(s) and the source, provide a link to the
Creative Commons licence, and indicate if changes were made. The images or other third party material in this
article are included in the article’s Creative Commons licence, unless indicated otherwise in a credit line to the
material. If material is not included in the article’s Creative Commons licence and your intended use is not
permitted by statutory regulation or exceeds the permitted use, you will need to obtain permission directly from
the copyright holder. To view a copy of this licence, visit http://creativecommons.org/licenses/by/4.0/.
© The Author(s) 2021
Scientific Reports | (2021) 11:3538 | https://doi.org/10.1038/s41598-021-82149-9 11
Vol.:(0123456789)You can also read