Bristol City Council Clean Air Plan: Outline Business Case - Economic Case - Bristol City Council
←
→
Page content transcription
If your browser does not render page correctly, please read the page content below

OUTLINE BUSINESS CASE

Bristol City Council Clean Air Plan:
Outline Business Case –
Economic Case

Prepared for

Bristol City Council

January 2019

Economic Case
3.1 Introduction
This chapter sets out the economic case and forms part of the BCC CAP Outline Business Case. The
completed Outline Business Case will contain the following information:
Strategic Case –sets out the case for change and the spending objectives of the Plan.
Economic Case – assesses the shortlisted options that achieve compliance in the shortest
possible time from a value for money perspective, as well as identifying distributional impacts of
the shortlisted options.
Commercial Case – establishes the preferred route to procurement, based on supplier capability
and likely delivery solution.
Financial Case ‐ sets out the detailed costings for the Plan and available funding sources.
Management Case – provides the governance and management arrangements to deliver the
preferred option.
This economic case has the following supporting documents:
Appendix D Air Quality Assessment Reports
Appendix E Transport Modelling Reports
Appendix F Stated Preference Survey Report
Appendix G Economics Methodology Report
Appendix H Social Distributional Impacts Report
3.2 Options assessed
The Option Assessment Report (Appendix C to the OBC) concluded the better performing options
are:
Option 4 – Medium area Class D charging option with complementary non‐charging
interventions.
Option 2c – Diesel car exclusion over a small area with bus and taxi fleet improvement to Euro 6
or better (assumed to be implemented 24 hours a day/7 days a week).
These options are assessed in this economic case.
During the development of the economic case, legislative issues have been identified associated
with a diesel car exemption. Research about the legislative powers required to implement the
scheme 24 hours a day, 7 days a week indicates that the Traffic Regulation Order (TRO) rules would
sufficiently support a vehicle restriction (or ban) however this would need to be within a time limit.
If this option were to be progressed, the project team would work with JAQU to understand the
feasibility (and associated programe) of a legislative amendment in relation to S.3.1.b of the Road
Traffic Regulation Act 1984 to enable local authorities to introduce measures that are not “charging”
but nonetheless may reduce pollution.
3‐1
3.3 Transport Modelling Approach
3.3.1     Modelling methodology
This modelling methodology summarises the detailed methodology found in the Local Plan
Transport Modelling Methodology Report (T3), and its appended technical notes, bringing together
an overview of all the components of how the baseline and option testing has been carried out using
the GBATS4M Transport Model.

3.3.2     Base and Baseline
3.3.2.1   Model Development
The Local Plan Transport Modelling Methodology Report (T3), chapters 3, 4 and 7, outlines the
modelling methodology for the Base and Baseline models. It states that the GBATS4M variable
demand model has been used to develop the 2021 baseline models, based on the inputs from the
updated Uncertainty Log.
The Uncertainty Log was developed in 2015 therefore details for an up‐to‐date Uncertainty Log have
been collated. This will cover both development and scheme assumptions. The baseline model
(2021) has the most recent scheme assumptions for the assessment year modelled within it based
on the Near Certain and More than Likely entries in the Uncertainty Log.
A growth model has been developed within the Demand Model which creates highway and public
transport future year demand matrices using the production and attraction trip end totals for the
new development, a gravity model to distribute these new developments using base year travel
costs and then converting to origin and destination format. These new trips are then added to the
base year matrices. Three‐dimensional matrix balancing to build full reference case matrices is
undertaken, retaining the base year trip length distribution and control to the National Trip End
model (NTEM, Tempro V7.2) growth for West of England and external zones.
These matrices are then run through the variable demand model until convergence is achieved
within the limits specified by the DfT.
Light and heavy goods vehicle growth is based on forecasts produced by the National Transport
Model (NTM) as advised by WebTAG. Goods vehicles are not subject to change via the demand
model.
Joint Spatial Plan growth has not been included in the development of the 2021 and 2031 baseline
models as it is not sufficiently certain, in terms of the WebTAG criteria, to be included.
The 2021 Baseline highway model developed has been adapted to be able to model the
implementation of a charging CAZ. The matrices have been split by compliance for each user class
using the surveyed Automatic Number Plate Recognition (ANPR) data.

3.3.2.2   ANPR Data
The 2017 Automatic Number Plate Recognistion (ANPR) surveys were undertaken in July and the
analysis (including tabulated data) and use is discussed fully in the ANPR Data Analysis and
Application technical note which is appended to T3. A summary is provided here.
The ANPR data has been used to determine the compliance splits of the current fleet when
compared to the CAZ framework criteria relating to Euro Standards. The registration data from the
ANPR surveys have been cross referenced with data purchased from Carweb to gain information on
vehicle type, fuel type and Euro standard. The ANPR data has also been used to split the taxi fleet
from the car matrices and the coaches from the HGV matrices, by applying global factors, by time
period.

                                                 3‐2
The base year compliance splits by vehicle type (Car, Taxi, LGVs, Coaches and HGVs) have been
determined from the 2017 ANPR data worked back to 2015 using the Emission Factor Toolkit
national euro standard splits. The baseline has been adjusted to 2021 using the fleet projection tool
within the Emission Factor Toolkit.
3.3.2.3 Matrix Compliance Splits
The highway model has 6 user classes: Car Non‐business (Low Income), Car Non‐business (Medium
Income), Car Non‐business (High Income), Car Business, LGV and HGV. These has been split into 12
user classes using the following methodology:
Split the Car user classes into Car and Taxi user classes
Split the HGV user class into HGV and Coach user classes
Split Car, Taxi, LGV, HGV and Coach matrices into compliant and non‐compliant using the time
period splits
3.3.2.4 Post‐Processing
The ANPR data collected has also been used to determine the HGV rigid/artic split by compliance
and fuel type splits for cars and LGVs. This has been used to add more detail to the modelled outputs
via post processing, to produce inputs into the EFT.
First Bus provided information regarding the 2021 fleet composition by service. Non‐First bus
compliance splits have been derived from ANPR data adjusted to 2021 using the EFT tool. The bus
fleet composition has been handled outside the transport model, before input to the EFT. This has
enabled vehicle details for particular routes to be accounted for in both the current and future fleet.
3.3.2.5 Euro Standard Splits
The EFT has national Euro Standard splits within it. These have been overwritten with splits
calculated from the 2017 ANPR data, projected forward to 2021.
3.3.2.6 2015 Base Compliance Splits
The base year compliance splits have been determined from the 2017 ANPR data worked back to
2015 using the EFT national euro standard splits. The ANPR Data Analysis and Application technical
note (appended to T3), Chapter 3, details this process and the outputs. Table 3.1 shows the
projected 2015 compliance data by time period – AM peak, IP (Interpeak) and PM peak.
Table 3.1: 2015 Compliance Splits by Time Period, Medium Cordon
Vehicle AM IP PM
Category Compliant Non‐compliant Compliant Non‐compliant Compliant Non‐compliant
Cars 36.1% 63.9% 34.7% 65.3% 35.3% 64.7%
LGV 0.2% 99.8% 0.2% 99.8% 0.2% 99.8%
HGV rigid 20.2% 79.8% 19.0% 81.0% 15.2% 84.8%
HGV artic 35.0% 65.0% 36.3% 63.7% 34.0% 66.0%
HGV 22.7% 77.3% 21.7% 78.3% 19.2% 80.8%
Taxi 11.5% 88.5% 9.1% 90.9% 10.7% 89.3%
Bus 7.6% 92.4% 7.9% 92.1% 7.7% 92.3%
Coach 14.7% 85.3% 15.1% 84.9% 15.8% 84.2%
Total 28.4% 74.8% 27.1% 76.6% 30.0% 71.3%
3.3.2.7 2021 Baseline Compliance Splits
The fleet projection tool within the EFT version 8 has been used to project the euro standard splits
from the 2017 ANPR data to the Baseline year of 2021. The ANPR Data Analysis and Application
technical note (appended to T3), Chapter 4, details this process and the outputs. A summary of the
projected 2021 compliance data by time period is provided in Table 3.2.
3‐3
Table 3.2: 2021 Compliance Splits by Time Period
Vehicle AM IP PM
Category Compliant Non‐compliant Compliant Non‐compliant Compliant Non‐compliant
Cars 74.0% 26.0% 72.8% 27.2% 73.4% 26.6%
LGV 58.0% 42.0% 63.1% 36.9% 58.2% 41.8%
HGV rigid 73.9% 26.1% 72.5% 27.5% 66.7% 33.3%
HGV artic 85.7% 14.3% 86.4% 13.6% 85.2% 14.8%
HGV 76.6% 23.4% 75.6% 24.4% 72.6% 27.4%
Taxi 39.7% 60.3% 33.7% 66.3% 37.7% 62.3%
Bus 65.2% 34.8% 66.3% 33.7% 65.7% 34.3%
Coach 68.8% 31.2% 69.6% 30.4% 70.6% 29.4%
Total 72.5% 30.8% 72.0% 31.7% 70.9% 30.3%
3.3.3 Clean Air Zone Option Testing
3.3.3.1 Primary Behavioural Responses
The primary responses have been modelled using the G‐BATS4M highway model using the following
methodology, as described in the Local Plan Transport Modelling Methodology Report (T3), Chapter
5:
Pay Charge – no change to the model
Avoid Zone – a charge has been applied to each inbound link to replicate the expected percentage change
from the baseline case of non‐compliant cars, LGVs and HGV’s within the CAZ
Cancel journey / change mode – this has been modelled by reducing the number of trips made by
non‐compliant vehicles to/from and within the CAZ area, to replicate the expected percentage
change from the baseline case
Replace Vehicle – an adjustment to the matrices by extracting select cordon matrices for the non‐
compliant trips and switching the proportion of replace vehicles, calculated from the stated
preference surveys, from the non‐compliant matrices to the compliant matrices
3.3.3.2 Secondary Behavioural Responses
In addition to the primary behavioural responses, JAQU have set out some further assumptions on
secondary responses for a charging CAZ for cars in paragraph 3.3 of the Evidence Package guidance.
These have been used due to lack of any available local data.
These secondary responses have been applied during the calculation of the upgrade costs and post‐
processing of the extracted link‐based flow data from the Transport Model for the ‘replace vehicle’
response.
3.3.3.3 Stated Preference Surveys
Stated preference survey of BCC / South Gloucestershire Council (SGC) / North Somerset Council
(NSC)/ Bath and North East Somerset (B&NES) residents were undertaken in 2018. The work
targeted owners of non‐compliant cars / LGVs who drive in central Bristol, and 1100 online surveys
completed Feb / March 2018.
The questionnaires asked how owners would respond to a small and medium size charging CAZ using
structured ‘multiple choice’ exercises and then the results were analysed using logistical regression
statistical techniques.
3‐4
3.3.3.4 Upgrade Costs
In order to determine the primary response rates over a range of CAZ charges from the stated
preference surveys, an upgrade cost is required for cars. The LGVs methodology for determining
response rates also requires an estimation of an upgrade cost. The upgrade costs of other vehicle
types (HGVs, Taxi, Bus and Coaches) were not used to calculate the primary response rates; rather,
the primary response rates for these vehicle types were determined by other information collated.
3.3.3.5 Proposed Charge Rates
Table 3.3 shows the proposed charges. These are selected as the minimum charges required to
address the air quality exceedances within Bristol and are in line with charges being considered by
other local authorities.
Table 3.3: Bristol CAZ Proposed Charges
Charge Class Daily Charge
Cars £9.00
Taxis £9.00
LGVs £9.00
HGVs £100.00
Buses £100.00
Coaches £100.00
3.3.3.6 Calculated Response Rates for Medium area CAZ D with Complementary Measures
The methodology for calculating the primary response rates for all vehicle type is summarised as
follows:
Cars ‐ The upgrade cost has been used to determine a range of primary responses for different
charge rates using the stated preference survey responses from the Medium zone area
LGVs ‐ The primary response rates are calculated from the stated preference survey responses
which were identified as a ‘van’. Again, the upgrade cost is used to determine a range of
primary responses for different charge rates from the Medium zone area
HGVs ‐ The primary behavioural responses rates for HGVs were taken from ‘Table 2 –
Behavioural responses to charging Clean Air Zones’ in the Evidence Package, provided by JAQU
Taxis ‐ The taxi response rate is based on Bristol enforcing compliance for Taxis through their
licensing agreements with taxi operators
Coaches ‐ The initial response rates for coaches were taken from ‘Table 2 – Behavioural
responses to charging Clean Air Zones’ in the Evidence Package, provided by JAQU
Buses ‐ The response rates for buses were determined through discussions between Bristol and
bus operators
An adjustment for foreign vehicles has been applied to the responses rates calculated from the
methodology set out above, as foreign vehicles cannot be reliably charged (their details are not
captured in the Driver and Vehicle Licensing Agency (DVLA) database in order to determine if the
vehicle is compliant and so enforcement can only occur through a manual process with limited
powers). The final response rates will assume a ‘worst case’, i.e. that these vehicles continue to drive
within the zone but do not pay the charge. In reality it is unlikely that this will be the case for all
foreign vehicles.
3‐5
Table 3.4 shows the final primary behavioural response rates by vehicle type produced the
methodology set out above and the charge rates in Table 3.3. These are the response rates that have
been applied to the core modelling scenarios within the traffic model.
Table 3.4: Final Primary Behavioural Response Rates for Medium Area Class D
Response Cars Cars Cars Cars Taxis LGVs HGVs Buses Coaches
Low Medium High Employers
Income Income Income Business
Pay Charge 4.4% 7.3% 5.2% 9.4% 4.1% 15.9% 8.8% 0.0% 17.8%
Avoid Zone 10.8% 14.1% 16.1% 18.0% 0.0% 19.2% 4.3% 0.0% 0.0%
Cancel Journey / 39.9% 22.1% 14.2% 14.5% 0.0% 2.6% 4.3% 6.4% 11.4%
Change Mode
Replace Vehicle 44.9% 56.5% 64.5% 58.1% 95.9% 62.2% 82.6% 93.6% 70.8%
3.3.3.7 Calculated Response Rates for Diesel car exclusion over a small area with bus and
taxi fleet improvement to Euro 6 or better
The methodology for calculating the primary response rates for all vehicle type is summarised as
follows:
Cars – Diesel Cars are excluded from the Small area, the pay charge response rate was set to
zero, the avoid zone rate has been determined by the model assignment, where through trips
can reroute and for trips with either an origin or destination point within the Small area, the
cancel trip/change mode and replace vehicle responses from the stated preference surveys
have been proportioned so that the total response rate totals 100 per cent
Taxis – Assumed 100 per cent replace vehicle
Buses ‐ Assumed 100 per cent replace vehicle
Table 3.5 shows the final primary behavioural response rates by vehicle type produced the
methodology set out above. These are the response rates that have been applied to the core
modelling scenarios within the traffic model.
Table 3.5: Final Primary Behavioural Response Rates for Diesel car exclusion over a small area with bus and taxi
fleet improvement to Euro 6 or better
Response Cars Cars Cars Cars Taxis LGVs HGVs Buses Coaches
Low Medium High Employers
Income Income Income Business
Pay Charge 0.0% 0.0% 0.0% 0.0% 0.0% 0.0% 0.0% 0.0% 0.0%
Avoid Zone 43.1% 41.0% 37.1% 38.8% 0.0% 0.0% 0.0% 0.0% 0.0%
Cancel Journey / 16.4% 17.0% 18.1% 17.6% 0.0% 0.0% 0.0% 0.0% 0.0%
Change Mode
Replace Vehicle 40.5% 42.0% 44.7% 43.6% 100.0% 0.0% 100.0% 0.0% 0.0%
3‐6
3.4 Air Quality Modelling Approach
3.4.1      Overview of approach
Dispersion modelling has been undertaken using ADMS‐Roads version 4.1, which is one of the
“standard” models recommended in JAQU’s ‘Transport and Air Quality’ guidance. The model is
approved by Defra and used extensively in the United Kingdom.
The model base year is 2015, with monitoring data for this year used to verify and adjust the
modelled concentrations. Options 4 and Option 2c, have been modelled for the future years 2021
and 2031, together with the future baseline (whiteout the aforementioned measures) for the same
years.
Both options showed exceedances of the NO2 limit in Bristol city centre in 2021 and no exceedances
in 2031. So, in order to compare the two options in terms of reaching compliance in the shortest
time possible and estimate in which year compliance would be reached, modelling results have been
interpolated between 2021 and 2031.
The model domain includes all roads that are listed within the national Pollution Climate Mapping
(PCM) model for the study area, as exceeding the annual mean Limit Value in 2021 for NO2 (as
published by Defra), as well as roads where annual mean NO2 concentrations are known to exceed
the national air quality objective, based on the most recent review and assessment report published
by BCC.
The domain also includes all potential displacement routes which may affected by the measures,
identified from the traffic model.

3.4.2      Summary of results
A detailed assessment of the impacts of the two preferred options on air quality has been
undertaken for the OBC using traffic and air quality models. The results of this work are summarised
in Table 3.6.

Table 3.6: Summary of AQ impacts

  Option                                        Has the options been            Does the option      Number of sites not
                                                modelled?                       achieve compliance   meeting compliance by
                                                                                in BCC by 2021?      2021

  Baseline 2021                                 Yes                             No                   >10

  Option 4 – Medium Area Class D Charging       Yes                             No                   6 locations
  Option with complementary non‐charging
  interventions

  Option 2c Diesel car exclusion across small   Yes, the Diesel car exclusion   No                   4 locations
  area with bus and taxi fleet improvement      over a small area together
  so that everything is Euro 6 or better        with taxi and bus fleet
                                                improvements

Plans showing the AQ impacts are presented in Table 3.7 and Figures 3.1 and 3.2.

                                                             3‐7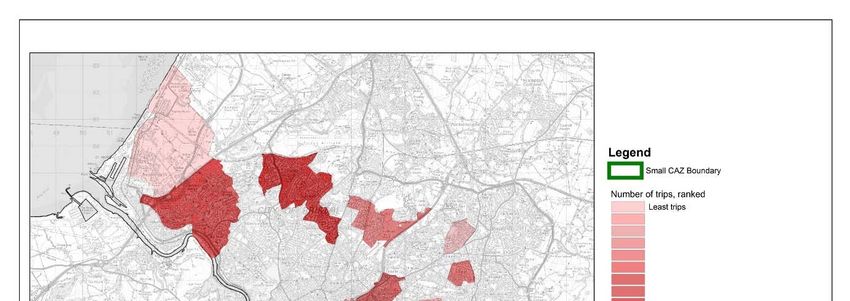
Table 3.7: Comparison of modelled options at locations with exceedances at one of more location

                                         Upper        Upper
                             Rupert      Maudlin      Maudlin                                     Queen's     College                   Newfoundland                    Church
 Road Name                   Street      Street       Street          Park Row     Park Street    Road        Green       Ward Bdy      Way                Easton Way   Road
                                         1236_2683                    1225_1815    1227_1793                  1237_2535                                                 1253_2351
                                                      1224_1236 &                                                         1110_4033 &
                             2677_1518   &                            &            &              1787_1227   &                         1470_3977          1248_1620    &
                                                      1236_1224                                                           4033_1110
 Modelled Link/s                         2683_1236                    1815_1225    1793_1227                  2535_1237                                                 2351_1253
                             Modelled    Modelled     Modelled        Modelled     Modelled       Modelled    Modelled    Modelled                         Modelled     Modelled
                             Results     Results      Results         Results      Results        Results     Results     Results       Modelled Results   Results      Results
 Modelled Scenario           (µg/m³)     (µg/m³)      (µg/m³)         (µg/m³)      (µg/m³)        (µg/m³)     (µg/m³)     (µg/m³)       (µg/m³)            (µg/m³)      (µg/m³)

         Baseline              54.88        67.2             51.6        48.1          52.2          58.8        52.1            41.1          47.3           38.7         50.5

 Medium Area Class D
 Charging Option with
                             46.09       52.4         41.4            38.9         40.5           47.9        39.1        35.7          41.4               32.7         45.6
 complementary non‐
 charging interventions
 Diesel car exclusion over
 a small area with bus and
                             42.84       45.4         36.8            33.5         36.3           43.0        39.1        37.7          36.3               32.7         45.2
 taxi fleet improvement
 to Euro 6 or better

                                                                                      3‐8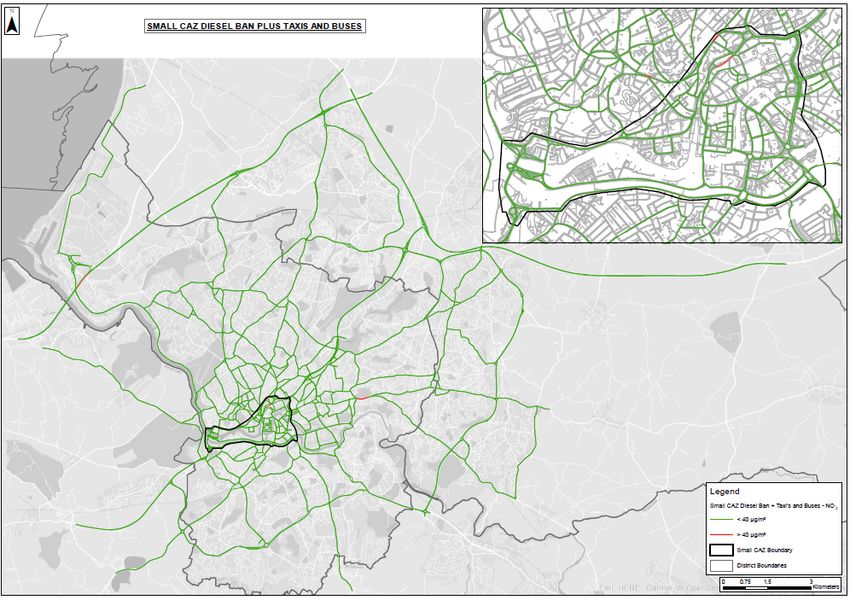
Figure 3.1 AQ impacts of Option 4: Medium Area Class D Charging Option with complementary measures

Figure 3.2 AQ impacts of Option 2c – Package of non‐charging interventions including small area car diesel ban
with taxi and bus fleet improvements

                                                       3‐10
Figure 3.3 Road Names of Key Links Experiencing Non‐Compliance
3‐11SECTION 3
Below is a description of the air quality issues at locations in the City with exceedances in one of more
options:
3.4.2.1 Rupert Street
Rupert Street (based on PCM receptors) exceeds the Air Quality objective of 40 µg/m³ in all scenarios.
The topography along Rupert Street is relatively flat. As a result of the tall buildings along the route, a
canyoning effect is created, reducing the dispersion of pollutants.
The best performing option is the Option 2c, which results in a significant reduction in emissions from
Diesel Cars, as well as Buses, with the highest emission apportionment (as calculated in the EFT) being
linked to Diesel LGVs (42.1%).
3.4.2.2 Upper Maudlin Street
Upper Maudlin Street (north of Lower Maudlin Street) exceeds the Air Quality objective of 40 µg/m³
in all scenarios.
There is a relatively steep gradient along the route, and as a result of the tall buildings along the route
(Bristol Royal Infirmary), a canyoning effect is created, reducing the dispersion of pollutants.
The best performing option is again the Option 2c, which results in a significant reduction in emissions
from Diesel Cars, with the highest emission apportionment (as calculated in the EFT) being linked to
Diesel LGVs (67%).
Upper Maudlin Street (south of Lower Maudlin Street) also exceeds the Air Quality objective of 40
µg/m³ with Option 4 while would meet compliance with Option 2c .
3.4.2.3 Park Row
Park Row exceeds the Air Quality objective of 40 µg/m³ in Baseline 2021 scenario, and both Option 4
and Option 2c would bring NO2 levels into compliance by 2021.
3.4.2.4 Park Street
Park Street exceeds the Air Quality objective of 40 µg/m³ with Option 4 due to the increase in Diesel
cars and HGVs movements diverted on this route.
There is a steep gradient along this street, and with the buildings along the route creating a canyoning
effect is created, reducing the dispersion of pollutants.
The best performing option is Option 2c, which results in a significant reduction in emissions from
Diesel Cars, with the highest emission apportionment (as calculated in the EFT) being linked to Diesel
LGVs (45.7%).
3.4.2.5 Queen's Road
Queen's Road still exceeds the Air Quality objective of 40 µg/m³ with both Option 4 and Option 2c.
There is a relatively steep gradient along the route, and as a result of the buildings along the route a
canyoning effect is created, reducing the dispersion of pollutants.
The best performing option is Option 2c, which results in a significant reduction in emissions from
Diesel Cars, with the highest emission apportionment (as calculated in the EFT) being linked to Diesel
LGVs and Buses and Coaches (44.1% / 26.7%).
3.4.2.6 College Green
College Green exceeds the Air Quality objective of 40 µg/m³ in the Baseline 2021 while both Option 4
and Option 2c would be sufficient to bring this link into compliance by 2021.
3‐12SECTION 3 – ECONOMIC CASE
3.4.2.7 A38 Cheltenham Road (Between B4051 junction and Arley Hill junction)
A38 Cheltenham Road (Between B4051 junction and Arley Hill junction) the Baseline 2021 while both
Option 4 and Option 2c would be sufficient to bring this link into compliance by 2021.
3.4.2.8 Newfoundland Way
Newfoundland Way exceeds the Air Quality objective of 40 µg/m³ with Option 4 in 2021, while Option
2c would bring compliance by 2021. Option 2c is the best option thanks to the significant reduction in
emissions from Diesel Cars, with the highest emission apportionment (as calculated in the EFT) being
linked to Diesel LGVs (76.3%).
3.4.2.9 Easton Way
Easton Way exceeds the Air Quality objective of 40 µg/m³ in the Baseline 2021, while both Option 4
and Option 2c would be sufficient to bring this link into compliance by 2021.
3.4.2.10 Church Road
Church Road exceeds the Air Quality objective of 40 µg/m³ in 2021 with both Options .There is a
gradient along this street, and canyoning effect reducing the dispersion of pollutants.The best
performing option is Option 2c, with the highest emission apportionment (as calculated in the EFT)
being linked to Diesel Cars (41.6%).
3.4.3 Year of compliance
The impact of the two preferred options has been assessed in terms of reduced time needed to
reach compliance compared to the Baseline (i.e. a scenario without measures). The modelling results
obtained for the years 2021 and 2031 have been interpolated to identify the options that will
achieve compliance at all locations in the shortest time possible. Table 3.8 shows the result of the
compliance year assessment at the most relevant locations.
Option 4 will achieve compliance at all location by 2027, with the exception of the north section of
Upper Maudlin Street that would be compliant only by 2030.
Option 2c will achieve compliance at all location by 2023, with the exception of the north section of
Upper Maudlin Street that would be compliant only by 2024.
3‐13SECTION 3 – ECONOMIC CASE
Table 3‐8: Compliance Year at relevant locations for the Baseline 2021, Option 4 and Option 2c scenarios
Years 2021 2022 2023 2024 2025 2026 2027 2028 2029 2030 2031
Rupert Street
Baseline 54.9 53.1 51.3 49.5 47.7 46.0 44.2 42.4 40.6 38.8 37.1
Medium CAZ D + CM 46.1 44.9 43.7 42.5 41.3 40.1 39.0 37.8 36.6 35.4 34.2
Small Car DiselBan + fleet improvements 42.8 41.4 40.1 38.7 37.3 35.9 34.5 33.1 31.7 30.3 28.9
Upper Maudlin Street (north)
Baseline 67.2 64.8 62.4 60.0 57.6 55.2 52.8 50.4 48.0 45.6 43.2
Medium CAZ D + CM 52.4 51.2 50.0 48.8 47.6 46.4 45.2 44.0 42.8 41.6 40.4
Small Car DiselBan + fleet improvements 45.4 43.9 42.5 41.1 39.6 38.2 36.8 35.3 33.9 32.4 31.0
Upper Maudlin Street (south)
Baseline 51.6 49.7 47.9 46.0 44.1 42.3 40.4 38.5 36.6 34.8 32.9
Medium CAZ D + CM 41.4 40.4 39.3 38.3 37.3 36.3 35.3 34.2 33.2 32.2 31.2
Small Car DiselBan + fleet improvements 36.9 35.8 34.6 33.5 32.4 31.2 30.1 29.0 27.8 26.7 25.6
Park Row
Baseline 48.1 46.4 44.7 43.0 41.3 39.6 37.9 36.2 34.5 32.8 31.1
Medium CAZ D + CM 39.0 38.1 37.2 36.3 35.4 34.5 33.6 32.7 31.8 30.9 30.1
Small Car DiselBan + fleet improvements 33.5 32.4 31.4 30.4 29.4 28.4 27.4 26.3 25.3 24.3 23.3
Park Street
Baseline 52.2 50.6 48.9 47.3 45.6 43.9 42.3 40.6 39.0 37.3 35.6
Medium CAZ D + CM 40.5 39.6 38.6 37.6 36.6 35.6 34.7 33.7 32.7 31.7 30.8
Small Car DiselBan + fleet improvements 36.3 35.0 33.7 32.5 31.2 29.9 28.7 27.4 26.1 24.9 23.6
Queen's Road
Baseline 58.8 56.8 54.8 52.8 50.8 48.7 46.7 44.7 42.7 40.7 38.6
Medium CAZ D + CM 48.0 46.8 45.6 44.4 43.3 42.1 40.9 39.7 38.6 37.4 36.2
Small Car DiselBan + fleet improvements 43.0 41.6 40.2 38.8 37.4 36.0 34.5 33.1 31.7 30.3 28.9
College Green
Baseline 52.1 50.1 48.0 46.0 43.9 41.9 39.8 37.8 35.7 33.7 31.6
Medium CAZ D + CM 39.1 38.0 36.8 35.7 34.6 33.4 32.3 31.1 30.0 28.9 27.7
Small Car DiselBan + fleet improvements 39.1 37.7 36.4 35.0 33.6 32.3 30.9 29.5 28.2 26.8 25.5
Newfoundland Way
Baseline 47.3 45.6 43.9 42.2 40.6 38.9 37.2 35.5 33.8 32.1 30.4
Medium CAZ D + CM 41.4 40.2 39.0 37.8 36.6 35.4 34.2 33.0 31.9 30.7 29.5
Small Car DiselBan + fleet improvements 36.3 35.2 34.0 32.8 31.7 30.5 29.4 28.2 27.0 25.9 24.7
Church Road
Baseline 50.5 48.6 46.6 44.7 42.7 40.8 38.8 36.9 34.9 33.0 31.0
Medium CAZ D + CM 45.6 44.0 42.5 40.9 39.4 37.9 36.3 34.8 33.2 31.7 30.2
Small Car DiselBan + fleet improvements 45.2 43.6 42.1 40.5 38.9 37.3 35.7 34.1 32.5 30.9 29.3
3.5 Economic Modelling Approach
JAQU’s Option Appraisal Guidance states that each shortlisted option identified at SOC stage should
be subject to detailed assessment of their overall costs and benefits and their distributional impacts.
The results from these assessments are intended to allow local authorities to identify the preferred
option for a scheme based on its value to society, distributional impacts and achieving compliance in
the shortest possible time. However, the Options Appraisal Guidance is also clear that only option
packages that are likely to lead to compliance as quickly as possible will be accepted, using some
pass/fail criteria as part of the Primary Critical Success Factors.
As demonstrated in Section 3.4, none of the identified shortlisted options derived from the Options
Assessment Report achieve compliance by 2021. However, two better performing options are
identified:
Option 4 – Medium area Class D charging option with complementary non‐charging
interventions
Option 2c – Diesel car exclusion over a small area with bus and taxi fleet improvement to Euro
6 or better
The economic analysis presented below is predicated on a comparative assessment of the two
options.
3‐14SECTION 3 – ECONOMIC CASE
The economic modelling approach is aligned with JAQU’s Option Appraisal Guidance and gives full
consideration to all of the economic impact types specified in that document. The results of the
analysis are outlined in the following section; the overall framework and methodology applied to the
analysis is presented in OBC‐18 ‘Economic Methodology Report’ in Appendix F of this OBC.
3.6 Economic Impacts
3.6.1 Health and Environmental Impacts
3.6.1.1 Greenhouse Gas Emissions
By changing travel behaviours (including number of trips, trip mode and vehicle type), the
intervention options may influence the quantum of Greenhouse Gas (GHG) emissions generated by
road transport. A change in GHG emissions, and CO2 emissions in particular, could generate variable
effects on climate change processes.
Based on air quality modelling outputs, the impact of the intervention options can be summarised as
follows:
Medium area CAZ D: forecast to initially reduce and then slow the growth of GHG emissions
for much of the appraisal period, before inducing acceleration in emissions in later years of
the appraisal period.
Small area diesel car exclusion: forecast to initially reduce emissions, then accelerate
emissions from the mid‐point of the appraisal period.
Relative to their respective baseline scenarios, both intervention options will therefore initially
reduce the quantum of CO2 emissions released into the atmosphere before increasing emissions at a
later date. This impact is monetised through the application of Department for Business, Energy and
Industrial Strategy (BEIS) carbon prices.
The monetised impact of a change in GHG emissions is presented in Table 3‐9, which demonstrates
that the scheme will generate a net benefit of almost £1.2 million over the ten‐year appraisal period
for the Medium area CAZ D intervention option. Due to the earlier onset of accelerated emissions
under the Small area diesel car exclusion intervention option (potentially linked to the switch from
diesel to petrol cars for some vehicle owners), the net impact is negative.
Table 3‐9: GHG impacts
Impact Medium area CAZ D Small area diesel car exclusion
Cumulative Difference in CO2 2,308
(18,843)
Emissions, 2021‐30 (tonnes)
BEIS Carbon Prices, 2021‐ 69.3 ‐ 79.4
69.3 ‐ 79.4
2030(£/tonne)
Present Value (PV) of Impact (£’s ‐116,651
1,153,292
2018 Prices and Values)
3.6.1.2 Air Quality (PM/NO2) Emissions
Based on air quality modelling outputs, the intervention options are forecast to reduce the level of
PM and NO2 emissions across the appraisal period, contributing to an improvement in air quality.
Improvements in air quality can lead to a range of public health, natural and built environment
benefits. These benefits can be monetised through the application of JAQU’s Damage Cost
estimates.
The monetised impact of a change in air quality is presented in Table 3‐10 which demonstrates that
the intervention options will generate a benefit between £17 million and £21 million over the ten‐
3‐15SECTION 3 – ECONOMIC CASE
year appraisal period. The scale of benefit is greater in the Small area diesel car exclusion
intervention option because this option is likely to induce existing diesel owners to upgrade vehicles
or change travel patterns/behaviours.
Table 3‐10: Air quality impacts
Small area diesel car
Impact Medium area CAZ D
exclusion
Cumulative Difference in NO2 Emissions 2021‐2030 (tonnes) 655.54 626.9
NO2 Damage Costs 2021‐2030 (£/tonne) 7,332‐8,762 7,332‐8,762
PV of NO2 Change (£’s 2018 Prices and Values) 4,146,929 3,888,265
Cumulative Difference in PM Emissions 2021‐2030 (tonnes) 118.29 150.39
PM Damage Costs 2021‐2030 (£/tonne) 131,467‐157,115 131,467‐157,115
PV of PM Change (£’s 2018 Prices and Values) 12,841,002 17,060,067
Aggregate PV (£’s 2018 Prices and Values) 16,987,932 20,948,332
3.6.2 Impacts on Transport Users
3.6.2.1 Fuel Switch Impacts
The transport analysis assumes that some car drivers will switch fuel type from diesel to petrol,
when upgrading their vehicle in response to the intervention option. The change in fuel switch costs
is reflected in the change in vehicle operating costs to the user, captured as part of the DfT’s
Transport User Benefits Assessment (TUBA) presented in Section 3.7.2.5. No additional or separate
analysis is provided here.
3.6.2.2 Transaction Costs
Based on the traffic forecasting analysis, the intervention options will accelerate the rate at which
vehicle owners’ purchase or upgrade to compliant vehicles. Each upgrading transaction incurs time
costs for vehicle owners relating to identifying and buying a compliant vehicle. By applying JAQU’s
recommended transaction cost data (provided as part of the National Data Inputs for Local Economic
Models) to the number of vehicles anticipated to upgrade, Table 3‐11 suggests that the scheme will
impose a transaction cost of between £83,000 and £149,000 over the ten‐year appraisal period. The
scale of transaction costs is higher for the Medium area CAZ D intervention option as more vehicles
are induced to upgrade.
Table 3‐11: Transaction cost impacts
Small area diesel car
Impact Medium area CAZ D
exclusion
Number of Vehicles Upgrading 27,012 15,228
Transaction Cost (£’s 2018 (82,831)
(148,856)
Prices and Values)
3.6.2.3 Consumer Welfare Impacts
The intervention options will affect consumer behaviour by inducing a change in travel behaviour for
non‐compliant vehicle trips (for example through upgrading vehicles, using alternative modes,
cancelling journeys etc, as suggested by the stated preference survey, Section 3.3, and reflecting in
traffic model forecasts). However, because consumers would have preferred their original action in
3‐16SECTION 3 – ECONOMIC CASE
the baseline, this change in behaviour leads to a consumer welfare impact. Two elements of analysis
were identified to estimate aggregate consumer welfare loss as a result of intervention:
Welfare loss associated with vehicles upgrading earlier
Welfare loss associated with changing travel patterns or behaviours (i.e. mode shift, cancelled
journeys, diverted journeys)
The cost of upgrading was estimated by establishing the average cost differential for upgrading a
vehicle in the intervention scenario, compared to the baseline scenario. The cost differential was
driven by the change in depreciation rates over time and therefore, the change in residual vehicle
value between replacement and replaced vehicles, at the time of upgrading in the intervention
scenario, relative to the baseline scenario. As vehicles were expected to upgrade earlier in the
intervention scenario, the cost of upgrading is expected to be higher as the difference in value
between replacement and replaced vehicles is also expected to be higher.
By applying the average cost differential for upgrading to the number of vehicles, upgrading (split by
vehicle type [i.e. cars, LGVs, buses etc) and upgrade type [i.e. to new or used vehicles]) the consumer
welfare loss associated with upgrading earlier is estimated to cost between £30 million and £35
million, as shown in Table 3‐12. The upgrading cost for the Small area diesel car exclusion
intervention option is higher than for the Medium area CAZ D option. This is because the Small area
diesel car exclusion intervention option will induce a greater number of newer (diesel) cars to
upgrade ahead of otherwise planned. Note that this figure reflects use of the ‘rule of half’ to
estimate the average loss to each upgrader.
Table 3‐12: Consumer welfare: cost of upgrading impacts
Medium area CAZ Small area diesel
Impact
D car exclusion
Number of Vehicles Upgrading 27,012 15,228
Consumer Welfare Loss (£’s 2018 Prices and Values) (29,995,696) (35,097,830)
The cost of changing travel behaviour was estimated by establishing the number of vehicle trips in
the baseline that would be fundamentally changed in the intervention scenario. The cost of each
individual trip cancelled, changed or switched to a new mode was assumed to be equal to half the
cost of the charge, where a charge applied (i.e. only in the Medium area CAZ D intervention option).
This approach, in line with JAQU’s Options Appraisal Guidance, was adopted to reflect that only
those trips that were valued at less than the cost of the charge were cancelled; any trips valued
more than the charge were assumed to pay the charge. However, as it is not possible to value every
trip that induced a behavioural response, each cancelled, changed or mode shifted trip was assumed
to be valued at half the price of the charge.
For the Small area diesel car exclusion option, traffic modelling assumes that all diesel cars adhere to
the exclusion zone. Therefore, no charge applies that is comparable to the CAZ charge. As such, no
welfare loss is assumed for vehicle trips being changed under the Small area diesel car exclusion
intervention option.
For the Medium area CAZ D intervention option, combining the number of vehicle trips changed
with the adjusted charge to enter the zone Table 3‐13 indicates that the consumer welfare loss
associated with changing travel patterns or behaviours could cost nearly £210 million over the ten‐
year appraisal period.
3‐17SECTION 3 – ECONOMIC CASE
Table 3‐13: Consumer welfare: cost of changing travel pattern or behaviour impacts
Small area diesel car
Impact Medium area CAZ D
exclusion
Number of Vehicles Trips Changed 197,528,864 264,265,131
Consumer Welfare Loss (£’s 2018 Prices and Values) (209,845,003) 0
3.6.2.4 Vehicle Scrappage Costs
As part of the upgrading process, it is assumed that the overall size of the vehicle fleet remains fixed.
Therefore, for every new vehicle purchased (25% of all upgrades), an older vehicle is scrapped. The
differential in lost asset value associated with scrapping a vehicle earlier in the intervention case
relative to the baseline case allows monetisation of this impact. By combining the number of
vehicles expected to be scrapped in the intervention scenario by the average differential in lost asset
value between the intervention and baseline scenarios, Table 3‐14 demonstrates that vehicle
scrappage costs could amount to between £3 million and £9 million across the ten‐year appraisal
period.
The scale of vehicle scrappage impacts is larger for the Small area diesel car exclusion intervention
option because the option will induce the scrappage of a greater number of high(er) value diesel cars
that can no longer enter the exclusion zone. This drives up the average differential in lost asset value
for vehicles under this intervention option, resulting in a high aggregate scrappage cost despite a
lower number of vehicles being scrapped.
Table 3‐14: Vehicle scrappage cost impacts
Impact Medium area CAZ D Small area diesel car exclusion
Number of Vehicles Scrapped 5,022 3,874
Vehicle Scrappage Costs (£’s 2018 (9,359,810)
(2,589,907)
Prices and Values)
3.6.2.5 Journey Time/Vehicle Operating Costs
By influencing travel patterns and behaviours, the intervention options could also have an impact on
transport economic efficiency (TEE), measured in terms of changes to journey time savings and
vehicle operating costs. By reducing vehicle flows, increasing vehicle speeds and reducing
congestion, travel time could be reduced alongside reduced running costs. Using DfT’s TUBA
software, the change in vehicle movements induced by the intervention options could contribute to
benefits in the region of £22 million to £72 million, based on journey time and vehicle operating cost
benefits for road users in Bristol (Table 3‐12).
The scale of benefits is considerably larger for the Medium area CAZ D intervention option. This is
because the option has the potential to remove a larger volume of traffic over a larger area relative
to the Small area diesel car exclusion intervention option
Table 3‐15: Journey time/vehicle operating cost impacts
TUBA Impact Category Medium area CAZ D Small area diesel car exclusion
PV Travel Time Impacts (2010 prices and 16,700
45,889
values)
PV Vehicle Operating Costs (2010 prices and ‐2,057
2,205
values)
PV Total (£’s 2018 Prices and Values) £72,119,048 21,957,816
3‐18SECTION 3 – ECONOMIC CASE
3.6.2.6 Accident Impacts
By changing travel patterns and behaviours, thus affecting vehicle trip numbers and speeds, the
intervention options could influence the frequency and severity of accidents. The number of
accidents and casualties is expected to reduce under both intervention options, leading to an
accident benefit of between £315,000 and £471,000 over the ten‐year appraisal period based on
utilisation of DfT’s CoBALT software (Table 3.16).
Table 3‐16: Journey time/vehicle operating cost impacts
Accident Impact Category Medium area CAZ D Small area diesel car exclusion
PV of Accident Costs in Baseline (2010 prices 16,355,400
16,355,400
and values)
PV of Accident Costs in Intervention (2010 16,041,300
16,145,900
prices and values)
Reduction in Accident Costs 209,500 314,100
PV Total (£’s 2018 Prices and Values) 314,154 471,007
3.6.2.7 Walking/Cycling Impacts
By inducing mode shift, the intervention options will increase the number of individuals making
walking and cycling trips. This has a positive economic impact, primarily by improving general health
of people, by walking and cycling more regularly, and by reducing absenteeism from work. Using the
DfT’s Active Mode Appraisal Toolkit, the forecast growth in the number of walking and cycling trips is
expected to lead to a benefit of between £51 million and £55 million (Table 3‐17).
The scale of impacts is greater in the Small area diesel car exclusion intervention option because
more trips are induced to change mode relative to their alternative action in the baseline. This is
partially driven by the fact that in the baseline for the Small area diesel car exclusion option, use of
diesel cars within the exclusion zone is maintained at a high level throughout the appraisal period.
All of these trips become non‐compliant in the intervention option. In comparison, the number of
trips in the Medium area CAZ D baseline option that would be non‐compliant in the intervention
option is initially higher, but drops markedly over the appraisal period as older cars are forecast to
be replaced even in the absence of the intervention option.
Table 3‐17: Walking/cycling impacts
Impact Medium area CAZ D Small area diesel car exclusion
Number of Trips Changing Mode 37,640,568 41,444,230
Number of New Cycling Trips 1,930,286 2,125,345
Number of New Walking Trips 25,093,712 27,629,487
PV Total (£’s 2018 Prices and Values) 51,258,892 55,194,944
3.6.3 Costs to Central and Local Government
3.6.3.1 Scheme costs
Tables 3‐18 and 3‐19 provide a summary of the costs for the scheme costs, further details will be
provided in the financial case.
3‐19SECTION 3 – ECONOMIC CASE
Table 3‐18: Estimated Scheme Costs for Option 4 – Medium area CAZ D with complementary measures
Item Estimated Cost
System Capital Costs
CAZ system (cameras and back office) £19,059,048
Street works (incl. power, comms and signage) £3,736,250
Non‐Charging Measures Capital Costs
Vehicle scrappage scheme £17,325,000
Business Rate Relief for SME's £39,375,000
Total Scheme Capital Cost £79,493,298
Revenue (Annual) Costs
CAZ operations £2,680,230
Maintenance and support £562,091
Other ongoing costs (e.g. staff, scheme monitoring) £771,981
Total Scheme Revenue (Annual) Cost £4,014,302
Note:
The above cost estimates include optimism bias as defined in HMT Green Book for the relevant item
classification.
The total capital cost excludes all costs associated with decommissioning of the CAZ system.
Table 3‐19: Estimated Scheme Costs for Option 2c – Small area diesels car exemption with bus and taxi fleet
improvements
Item Estimated Cost
System Capital Costs
CAZ system (cameras and back office) £7,117,938
Street works (incl. power, comms and signage) £1,436,951
Non‐Charging Measures Capital Costs
Vehicle scrappage scheme £17,325,000
Business Rate Relief for SME's £39,375,000
Total Scheme Capital Cost £65,254,889
Revenue (Annual) Costs
CAZ operations £545,937
Maintenance and support £223,119
Other ongoing costs (e.g. staff, scheme monitoring) £755,706
Total Scheme Revenue (Annual) Cost £1,524,762
Note:
The above cost estimates include optimism bias as defined in HMT Green Book for the relevant item
classification.
The total capital cost excludes all costs associated with decommissioning of the CAZ system.
3.6.3.2 Set‐Up Costs
The capital costs associated with delivering the scheme are estimated at between £66 million and
£79 million, as summarised in Table 3‐20. Costs are greater for the Medium area CAZ D intervention
option because the enforcement system is more expensive to install (primarily attributable to the
requirement for more ANPR cameras to cover a wider zone). More detail on the derivation of these
costs can be found within OBC‐33 ‘Project Costs’ in Appendix J of this OBC.
3‐20SECTION 3 – ECONOMIC CASE
Table 3‐20: Set‐up cost impacts (2018 prices and values)
Impact Medium area CAZ D Small area diesel car exclusion
PV of Capital Costs (£’s 2018
79,110,638 65,817,064
Prices and Values)
3.6.3.3 Running Costs
The operational costs associated with delivering the scheme are estimated at between £10 million
and £30 million over the ten‐year appraisal period, as summarised in Table 3‐21. Costs are greater
for the Medium area CAZ D intervention option due to the need to make contributions to the Clean
Air Zone central payment system on an ongoing basis. Note that revenue associated with CAZ
charges and Penalty Charge Notices (PCNs) are ignored from the analysis on the basis that this
economic benefit to local/central Government is neutralised by the economic cost to individuals of
paying the charge/fine.
Table 3‐21: Operational cost impacts (2018 prices and values)
Impact Medium area CAZ D Small area diesel car exclusion
PV of Operational Costs (£’s 2018
30,085,478 10,290,754
Prices and Values)
3.6.4 Summary
By combining the economic impacts discussed in the previous sections, the intervention options
could generate a NPV of between ‐£22m and £210m, as shown in Table 3‐22. The economic costs for
both intervention options therefore outweigh the economic benefits by a considerable margin,
particularly for the Medium area CAZ D option. This is primarily driven by the loss in consumer
welfare associated with changing travel patterns and behaviours, as well as onerous set up and
running costs.
Table 3‐22: Net economic impacts (2018 prices and values £)
Small area diesel car
Impact Medium area CAZ D
exclusion
Air Quality £16,987,932 £20,948,332
NOx £4,146,929 £3,888,265
PM £12,841,002 £17,060,067
Consumer Welfare ‐£239,840,698 ‐£35,097,830
Behavioural Response: Replace Vehicle ‐£29,995,696 ‐£35,097,830
Behavioural Response: Cancel Trip/Avoid Zone/Re‐mode ‐£209,845,003 £0
Vehicle Scrappage ‐£2,589,907 ‐£9,359,810
Transactions ‐£148,586 ‐£82,831
Traffic Flows £72,119,048 £21,957,816
GHGs £1,153,292 ‐£116,651
Set Up ‐£79,110,638 ‐£65,817,064
Running Costs ‐£30,085,478 ‐£10,290,754
Active Mode Impacts £51,258,892 £55,194,944
3‐21SECTION 3 – ECONOMIC CASE
Small area diesel car
Impact Medium area CAZ D
exclusion
Accident Impacts £314,154 £471,007
Net Present Value (NPV) ‐£209,941,989 ‐£22,192,840
To provide scale context, these NPVs, have been compared to the forecast GVA in Bristol (forecast at
£137 billion in present value terms [2018 prices and values] between 2021‐30). Across the 10 year
period assessed, the NPV of the intervention options represent between ‐0.02% and ‐0.15% of
present value GVA in B&NES over the same period.
3.7 Multi‐criteria assessment
Allied to the economic modelling impacts monetised above, a multi‐criteria assessment (MCA) was
prepared at OAR stage to differentiate between the two shortlisted options. This supports the
economic modelling by outlining the differential impact of the shortlisted options on a range of
economic actors not explicitly considered as part of the core economic modelling. This includes
employment markets, income deprivation, businesses and economic sectors (e.g. retail/leisure). It
also incorporates some economic impacts considered within the economic modelling above (e.g.
consumer welfare loss, vehicle scrappage costs and transaction costs).
3.7.1 Introduction
The qualitative economic analysis of options follows a two‐step approach:
Step One –outlines the baseline position for Bristol’s economy, covering a range of key economic
indicators, in order to establish an economic narrative
Step Two – multi‐criteria assessment (MCA) of the potential impact of the various options on key
economic indicators
The economic narrative established in Step One provides the context within which the MCA
undertaken as part of Step Two is considered.
3.7.2 Step One: Economic Narrative
This section presents a brief economic narrative for the City of Bristol. It outlines key baseline
economic indicators at both local authority level as well as for the varying spatial scales pertaining to
the various Clean Air Plan options. The analysis contains a summary of the following indicators:
Business count
Employment data/labour market characteristics
Deprivation analysis
Vehicle compliance patterns
To establish the function and form of Bristol’s economy in the context of the forthcoming Clean Air
Plan. This information is utilised to develop the multi criteria assessment presented later in this
report.
3.7.2.1 Business Count
Business count data from National Online Manpower Information System (NOMIS) provides an
insight into the number and size of businesses in a given context area. Businesses are classified into
various sizes based on the number of employees within that business. The data illustrates that the
Bristol economy consist of 22,170 businesses, with 18,025 of these classified as micro‐businesses.
Micro‐businesses make up a significant proportion (81%) of the market structure within the local
3‐22SECTION 3 – ECONOMIC CASE
authority, whilst SMEs account for 18% of all businesses within Bristol. Overall, micro and small
businesses account for 96.3% of the business within Bristol. Table 3.23 below presents the
distribution of businesses by type across Bristol.
Table 3.23: Business types within Bristol
Business Type
Context Area Micro (0 to 9) Small (10 to 49) Medium‐sized (50 to Large (250+) Total
249)
Bristol LA 18,025 3,320 700 125 22,170
Table 3.24 summarises the business count data pertaining to the geographic scales directly affected
by potential intervention options (i.e. small area CAZ15 and medium area CAZ). Between 3,000 and
7,400 businesses are located within the small and medium boundaries respectively. These figures
suggest that 13% of all Bristol businesses will be located within the small boundary and one‐third will
be located within the medium boundary.
The overarching theme, irrespective of the geographic scale, is that micro businesses make up the
largest proportion of businesses. Further, combining micro and SME businesses reveals that around
99% of all businesses located within across the local authority and within small and medium
boundaries employ fewer than 50 employees. Therefore, there is limited differentiation between the
geographic scales from a business size perspective. That said, there are nearly 60% fewer micro
businesses and SMEs within the small area CAZ boundary relative to the medium area CAZ boundary.
Table 3.24: Business types within CAZ proposals
Business Type
Context Area Micro (0 to 9) Small (10 to 49) Medium‐sized (50 to Large (250+) Total
249)
Small Area 2,210 675 145 35 3,065
CAZ
Medium Area 5,985 1,075 245 55 7,360
CAZ
Business count data was also considered for two key sectors within the Bristol economy: tourism16
and retail17. Table 3.25 reveals that for as per the economy‐wide analysis, micro businesses in the
retail sector comprise a majority of the market structure, irrespective of context area being
analysed. Within the small area CAZ boundary, micro‐businesses make up 71% of the businesses,
this increases to 80% and 79% for the medium area CAZ and Bristol respectively. It should be noted
that there is also a large presence of small retail businesses in the small CAZ area, 27%, this drops to
19% at the Medium area CAZ area and Bristol geographical measures. In total, all retail businesses at
all geographic scales are defined as micro or SMEs. At a spatially disaggregated level, less than 40%
of Bristol’s retail businesses are located within the Medium area CAZ area, and only one‐third of
these are located within the small CAZ area.
15 Used as a proxy for small area over which the diesel car exclusion zone is applied
16 The definition of tourism is based on ONS’ ‘workers in the tourism sector’ report
17 The definition of retail is based on the SIC category 47
3‐23SECTION 3 – ECONOMIC CASE
Table 3.25: Retail businesses by type
Industry Business Type
Retail Micro (0 to 9) Small (10 to 49) Medium‐sized (50 to 249) Large (250+) Total
Small Area CAZ 180 70 5 0 255
Medium Area 605 140 10 0 755
CAZ
Bristol 1,565 375 30 0 1,970
Similar patterns are evident within the tourism sector. Micro businesses make up majority of the
market share, with 61% of tourism related business in the small area CAZ being micro. This increases
to 77% and 75% for both the medium area CAZ and Bristol respectively. Small businesses in the small
CAZ make up 36% of the market share, this is higher than the 23% in the medium area CAZ and 24%
in Bristol. In total, all tourism businesses at all geographic scales are defined as micro or SMEs. At a
spatially disaggregated level, less than 40% of Bristol’s tourism businesses are located within the
medium area CAZ boundary, but the majority of these (nearly 80%) are located within the small area
CAZ boundary. This suggests a disproportionate number of tourism businesses are located within the
small area CAZ boundary; this is understandable given that Bristol City Centre falls within this zone.
Table 3.26: Tourism businesses by type
Industry Business Type
Tourism Micro (0 to 9) Small (10 to 49) Medium‐sized (50 to 249) Large (250+) Total
Small Area CAZ 295 175 15 0 485
Medium Area CAZ 480 140 0 0 620
Bristol 1,270 405 15 0 1,690
3.7.2.2 Labour Market Characteristics
Employment density outlines the distribution of jobs across Lower Super Output Areas (LSOAs) that
make up Bristol, as per data from the Business Register and Employment Survey (BRES). This data
has been mapped and is presented as Figure 3.4. The analysis demonstrates that LSOAs that
predominantly lie within the small CAZ boundary have the highest jobs density, with more than
2,000 employees per LSOA. Whilst the work illustrates that LSOAs outside the city centre generally
have a lower jobs density. Overall, there is a clear concentration of employment within Bristol City
Centre, which lies within the small area CAZ boundary. Nevertheless, because the medium area CAZ
boundary includes the small area CAZ boundary, the total level of employment within the medium
area CAZ boundary exceeds the smaller boundary.
3‐24SECTION 3 – ECONOMIC CASE
Figure 3.4: Employment Density in Bristol
The trends presented in Figure 3.4 are reflected in Table 3.27, which illustrates the sectoral profile of
employment for Bristol and the focussed geographic scales, compared to national benchmarks. The
analysis reveals that within the small area CAZ boundary the main industries of employment are
business services (industrial sectors: J, K, L, M, and N). A larger proportion of individuals ,63%, are
employed within these industries in the small area CAZ boundary relative to the medium area CAZ
boundary (45%), Bristol local authority area (35%) and nationally (28%). These sectors tend to make
a significant contribution to economic output and value added, as well as offering competitive
salaries. As has been mentioned previously, the small CAZ boundary includes Bristol City Centre
which is where the majority of business services jobs are located.
Table 3.27: Proportion of individuals in industrial sectors by context area
Industrial Sectors Small CAZ Medium area Bristol England
CAZ
Agriculture, forestry & fishing (A) 0% 0% 0% 1%
Mining, quarrying & utilities (B,D and E) 1% 2% 1% 1%
Manufacturing (C) 1% 2% 4% 8%
Construction (F) 1% 2% 4% 5%
Motor trades (Part G) 0% 1% 2% 2%
Wholesale (Part G) 0% 2% 4% 4%
Retail (Part G) 7% 7% 8% 9%
Transport & storage (inc postal) (H) 1% 3% 4% 5%
Accommodation & food services (I) 9% 8% 7% 7%
Information & communication (J) 10% 7% 6% 4%
Financial & insurance (K) 14% 10% 7% 4%
3‐25You can also read