Brokerage Firms An Overview - The Pakistan Credit Rating Agency Limited - Asia-Pacific Research Exchange

Page created by Tom Vaughn
 
CONTINUE READING
Brokerage Firms An Overview - The Pakistan Credit Rating Agency Limited - Asia-Pacific Research Exchange
Brokerage Firms
                                                  An Overview

© The Pakistan Credit Rating Agency Limited.                    January 2021
Brokerage Firms An Overview - The Pakistan Credit Rating Agency Limited - Asia-Pacific Research Exchange
TABLE OF CONTENTS

    Contents                          Page No.   Contents                     Page No.
    Introduction                         1       Fee Income                     15
    Global Industry | Overview           5       Market Performance             16
    Regional Comparison | India          6       Net Buy/Sell                   17
    Global Indices | COVID Spell         7       Regulatory Framework           18
    Local Industry | Overview            9       Business Risk                  20
    GDP Break Up                        10       Financial Risk                 21

    Macro Economic Factors              11       Rating Curve                   22
    KSE 100 | Sectoral Composition      12       SWOT Analysis                  23
    KSE 100 Returns                     13       Outlook & Future Prospects     24

    Market Volumes & Capitalization     14       Bibliography                   25
Brokerage Firms An Overview - The Pakistan Credit Rating Agency Limited - Asia-Pacific Research Exchange
BROKERAGE FIRMS | INTRODUCTION
Types of Financial Markets
                                                                         This Sector Study will majorly focus on
                             Financial Markets                         Secondary Capital Markets where most of
                                                                        the brokerage business is concentrated

   Foreign Exchange                         Derivatives     Commodity
        Market
                        Money Market
                                             Market           Market
                                                                                Capital Market

                              Secondary                                                         Secondary
       Primary Market                                             Primary Market
                               Market                                                            Market

                                                                                          Stock
                                                                                        Exchange
                                                           Square Up                   OTC Market
       Ready Market      SME Market       Odd Lot Market
                                                            Market

                                                                                                   Source: PSX     1
Brokerage Firms An Overview - The Pakistan Credit Rating Agency Limited - Asia-Pacific Research Exchange
BROKERAGE FIRMS | CAPITAL MARKETS
An Overview
• Capital markets are a broad category of markets facilitating the buying and selling of financial instruments. In particular, there are two
  categories of financial instruments in which markets are involved. These are equity securities, which are often known as stocks, and
  debt securities, which are often known as bonds. Capital markets involve the issuing of stocks and bonds for medium-term and long-
  term durations, generally terms of one year or more.

• Other than the distinction between equity and debt, capital markets are also generally divided into two categories of markets, the first
  of which being primary markets. In primary markets, stocks and bonds are issued directly from companies to investors, businesses and
  other institutions, often through underwriting.

• The capital market structure in Pakistan consists of an apex regulator of the markets, the Securities and Exchange Commission Pakistan
  (SECP), Pakistan Stock Exchange (emerged as a result of merging three stock exchanges), Mercantile Exchanges, Central Depository
  Company (CDC) and a Clearing and Settlement Company. The structure further includes intermediaries or market participants such as
  brokers which handle the transaction of shares in the capital markets on behalf of investors.

• The level of capital market development is an important determinant of level of savings, efficiency of investment and ultimately rate of
  economic growth.

• This Sector Study shall be focused on the Secondary Capital Markets, and KSE-100 shall be used as the benchmark Index for analysis
  purpose.

                                                                        Source: http://www.finance.gov.pk/survey/chapters_16/06_Capital_Markets.pdf   2
Brokerage Firms An Overview - The Pakistan Credit Rating Agency Limited - Asia-Pacific Research Exchange
BROKERAGE FIRMS| INTRODUCTION
Pakistan Stock Exchange (PSX) | Products
• Equity
     • Ready Market: In this market segment, stocks of all companies listed are traded. Transactions are settled in two days (T+2).
     • Small & Medium Enterprise Market: Shares of companies with post-issue paid-up capital between PKR25mln and PKR200mln are
       traded. Target investors for this segment include Qualified Institutional Buyers (QIBs) and High Net Worth Individuals (HNWI).
     • Odd lot Market: In this market segment, investors can trade in securities in lots which are less than normal/ regular lots (500 shares).
       The minimum number of shares that can be traded is 1. Settlement takes place in T+2 days.
     • Square Up Market: In this market segment, if a Clearing Member (CM) fails to deliver sold securities, then the failed deliveries are
       squared up in the Square-up Market.
     • Real Estate Investment Trust (REIT): REIT is a fund based trust that owns income-producing real estate, buys real estate, develops,
       manage/ operates and sells real estate assets. REITs are modelled after mutual funds where all taxable income is paid out as dividends to
       shareholders.
     • Negotiated Deals: Here negotiated deals are conducted outside the Exchange Trading Systems and are reported through the interface
       provided by the Exchange. These transactions are conducted between brokers.
• Fixed Income
     • Corporate Debt Instruments: These include Term Finance Certificates (TFCs), SUKUK Certificates, Registered Bonds, Corporate Bonds
       etc., and all kinds of debt instruments issued by any Pakistani company or corporation registered in Pakistan.
     • Government Debt Instruments: These are debt instruments issued by the Government of Pakistan. These include PIBs, Treasury Bills,
       National Savings Bonds, and Islamic Ijarah Sukuks.

                                                                                                                          Source: PSX        3
Brokerage Firms An Overview - The Pakistan Credit Rating Agency Limited - Asia-Pacific Research Exchange
BROKERAGE FIRMS| INTRODUCTION
PSX Products
• Derivatives
    • Deliverable Futures Contract (DFC): DFCs are forward contracts to buy or sell a certain underlying instrument with actual delivery of the
       said instrument occurring. The minimum lot for purchasing these shares is 500 shares. Settlement takes place 30 days after the contract
       is purchased.
    • Single Stock Cash Settled Futures (CSF): Single Cash Settled Futures are standardized contracts to buy/sell single stock futures to be
       settled in cash, where the result of the trade is the cash difference between the buying and selling price. Settlement occurs purely on
       cash basis. Settlement can occur 30, 60, & 90 days after the contract is purchased.
    • Stock Index Futures Contract (SIFC): SIFC is an agreement to buy or sell a standardized value of a stock index (basket of shares) on a
       future date at a specified price. SIFC gives opportunity to investors to trade in entire stock market by buying index futures instead of
       buying individual securities with the efficiency of mutual funds. Currently 90 days SIFCs are available at PSX.

• Exchange Traded Funds (ETFs): ETF is a pooled investment vehicle with units that can be bought or sold on the Stock Exchange at a market-
  determined price. Similar to mutual funds units, ETF owns the underlying assets (stocks or bonds) and offers investors a proportionate share
  in a pool of stocks, bonds, and other assets. ETFs are new to Pakistan and were first introduced in March 2020. There are currently four ETFs
  available to investors on the PSX.

• Margin Trading System (MTS): In MTS (Margin Trading System), an investor can buy MTS eligible securities having a part percentage of funds
  available of the total value of MTS eligible securities bought. An investor may buy a number of MTS eligible securities while having only a fixed
  percentage of funds available. The remaining amount is financed or leveraged by the Brokerage firm.

                                                                                                                            Source: PSX        4
BROKERAGE FIRMS| GLOBAL STOCK EXCHANGES
Overview
• The table shows the 10 largest stock exchanges in the world in terms of market capitalization along with their 2020 performance. The top 10
  exchanges combined represent approximately ~80% of total global market capitalization.
• The US has the two largest exchanges, NYSE and Nasdaq. The NYSE is dominated by the information technology sector which occupies ~28%
  of the total market. This is due to the presence of companies such as Apple, Microsoft and Amazon, whose individual market capitalization
  has crossed the trillion dollar mark.
                              Market Capitalization                        1 Year Performance
      Stock Exchange                                            Index                         P/E Ratio
                                   (USD Trn)                                      (CY20)                                          NYSE Sectoral Break Up (2020)
 New York Stock Exchange              22.4            S&P 500                     16%           41.17
                                                                                                                                2% 3%                       Information Technology
 Nasdaq                               18.0            Nasdaq                      42%           40.01                      3%
                                                                                                                     3%                                     Healthcare
 Shanghai Stock Exchange               7.2            Shanghai Composite          15%           16.31
                                                                                                                7%                            28%           Consumer Discretionary
 Tokyo Stock Exchange                  6.7            Nikkei 225                  18%           26.02
                                                                                                                                                            Communication Services
 Hong Kong Exchange                    6.1            Hang Seng                   -2%           13.96
                                                                                                          8%                                                Financials
 Shenzhen Stock Exchange               5.5            SZSE Component              40%           35.33
                                                                                                                                                            Industrials
 London Stock Exchange                 4.6            FTSE 100                   -10%           17.55
                                                                                                                                                            Consumer Staples
 Euronext                              4.4            Euro Stoxx 50               -5%           21.12
                                                                                                          10%                                               Utilities
 Saudi Stock Exchange                  2.4            Tadawul All Share           5%            35.54
                                                                                                                                              14%           Real Estate
 National Stock Exchange of
 India                                 0.2            NIFTY 50                    17%           35.99                                                       Materials
                                                                                                                     11%
 Bombay Stock Exchange                 0.2            SENSEX                      18%           34.58                                   11%
                                                                                                                                                            Energy
 Pakistan Stock Exchange              0.05            KSE 100                     6%            10.95

                                                                                                                Source: Investing.com, Hargreaves Landown, Bloomberg                 5
BROKERAGE FIRMS| GLOBAL MARKET
Regional Comparison | INDIA
• The Securities and Exchange Board of India (SEBI) is the regulatory body which
  oversees brokerages in the country. The Securities and Exchange Board of India
  (Stock Brokers and Sub-Brokers) Regulations, 1992 is the legislation which
  regulates the brokerage industry.
• The regulation defines 3 categories of brokers, trading members, self-clearing
  members and clearing members. These correspond with the categories
  introduced in Pakistan through the new broker regime.
• The regulation also defines a sub-broker as ‘any person not being a member of
  stock exchange who acts on behalf of a stock broker as an agent or otherwise
  for assisting the investors in buying, selling or dealing in securities through such
  stock brokers’.
• The base minimum capital requirement for stock brokers is INR 1mln, while for
  self-clearing members it is INR 10mln and for trading plus clearing members the
  minimum capital requirement is INR 25mln.

                                                                                         Source: BSE India, SEBI, PSX   6
BROKERAGE FIRMS | GLOBAL INDICES
The COVID-19 SPELL
   • Global Stock Indices took a dip during the
     first wave of Covid-19, with KSE-100 and                                                     Regional Market Indices | Monthly Performance | CY20
     BSE-Sensex dropping by ~23% in                                        20%

     March’20. China’s SSE Composite was the                               15%
                                                                                                                    17%
                                                                                                                    14%
     least to decline by ~5% (Mar’20).                                                                              13%
                                                                                                                                                     14%
                                                                                                                                                                                             11%
                                                                                                                                                                                             11%
                                                                           10%                                                                       10%
                                                                                                                                           8%        8%                                                8%
                                                                                                                                                               7%                                      7%
                                                                            5%                                                                       6%        5%                            5%
                                                                                                                            5%       4%
   • The markets recovered in the next                                                 2%
                                                                                                                    4%
                                                                                                                                     2%
                                                                                                                                     1%
                                                                                                                                                               3%
                                                                                                                                                                                  4%
                                                                                                                                                                                             3%        4%
                                                                                                                                                                                                       2%
     months and have reflected positive                                     0%         -0.2%
                                                                                       -1%
                                                                                  Jan-20     Feb-20   Mar-20   Apr-20
                                                                                                                            0%
                                                                                                                            -1%
                                                                                                                       May-20   Jun-20          Jul-20     Aug-20
                                                                                                                                                                         -1%
                                                                                                                                                                    Sep-20
                                                                                                                                                                                   0%
                                                                                                                                                                         -1% Oct-20-2% Nov-20      Dec-20
                                                                                                                                                                                   -3%
     growth sentiments barring a few months.                                -5%
                                                                                       -3%        -3%
                                                                                                           -5%
                                                                                                                            -4%                                          -4%
                                                                                                                                                                         -6%
                                                                                                  -6%
                                                                                                  -8%
                                                                                                  -9%
                                                                           -10%
                                                                                                           -13%
   • KSE-100 Index has, on average, reflected                              -15%
     a return of ~5% combined in Nov’20 and
                                                                           -20%
     Dec’20.
                                                                                                           -23%
                                                                           -25%

                                                                           -30%

                                                                                            KSE-100 Index | Pak       BSE Sensex | India          S&P - 500 | USA        SSE Composite | China

 Performance is computed using Index Value as of the last trading day of           Sources: https://www.bseindia.com/sensex/code/98/ , https://www.investing.com/indices/us-spx-500-historical-data ,       7
 each month                                                                                                                 https://www.marketwatch.com/investing/index/shcomp?countrycode=cn
BROKERAGE FIRMS | GLOBAL EQUITY MARKETS
Overview
• The adjacent table shows the MSCI                    Developed Markets                             Emerging Markets                                   Frontier Markets
  categorization of various international   Americas
                                                        Europe & Middle
                                                                            Pacific    Americas
                                                                                                   Europe, Middle East &
                                                                                                                              Asia       Europe & CIS
                                                                                                                                                          Middle East &
                                                                                                                                                                              Asia
  equity markets into developed,                             East                                          Africa                                            Africa

  emerging and frontier markets.            Canada          Austria        Australia   Argentina      Czech Republic         China         Croatia            Kenya        Bangladesh
                                            United
• In 2017, Pakistan was included in the     States          Belgium        Hong Kong    Brazil            Egypt               India        Estonia          Mauritius       Sri Lanka
  MSCI Emerging Market Index and has                       Denmark           Japan       Chile            Greece           Indonesia      Lithuania          Morocco        Vietnam
  maintained its position ever since.                                         New
                                                            Finland         Zealand    Colombia          Hungary             Korea       Kazakhstan          Nigeria
                                                            France         Singapore    Mexico            Kuwait            Malaysia      Romania            Tunisia
                                                           Germany                       Peru             Poland            Pakistan        Serbia           Bahrain
                                                            Ireland                                       Qatar            Philippines     Slovenia           Jordan
                                                             Israel                                       Russia            Taiwan                           Lebanon
                                                             Italy                                     Saudi Arabia         Thailand                          Oman
                                                          Netherlands                                  South Africa
                                                            Norway                                        Turkey
                                                            Portugal                               United Arab Emirates
                                                             Spain
                                                            Sweden
                                                          Switzerland
                                                        United Kingdom

                                                                                                                                                      Source: MSCI              8
BROKERAGE FIRMS| LOCAL INDUSTRY
Overview
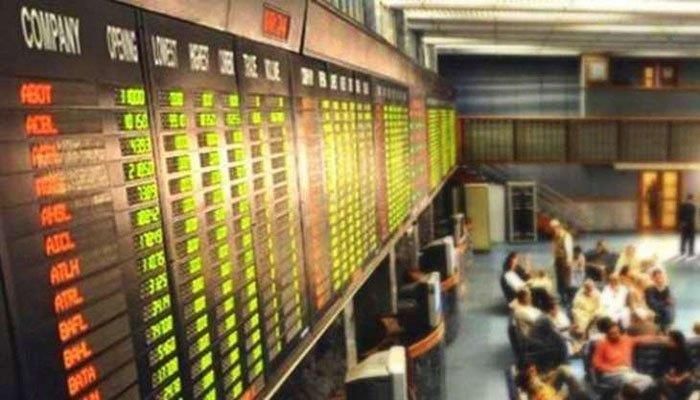
• A broker or brokerage firm acts as an intermediary by matching a customer’s buy order with a third party’s sell order or vice versa.

• Brokerage firms receive compensation through a commission or fees that is charged once the transaction has been successfully completed.
  This amount may be paid by the customer or the exchange.

• It is common for brokerage firms to offer a variety of other services to their customers which include money management, tax advice and
  financial consultation. They also provide up-to-date stock quotes, research regarding economic environment and market analysis.

• There are currently ~204 brokerage firms licensed by the Securities and Exchange Commission of Pakistan (SECP). Out of these 20 brokerage
  firms have Entity Ratings while 19 have Broker Management Ratings. Moreover, there are 9 brokerage firms listed on the Pakistan Stock
  Exchange.

                                                                                                                          Source: SECP      9
BROKERAGE FIRMS| LOCAL INDUSTRY
GDP Break Up
• Pakistan’s GDP shrunk by 0.38% in FY20 and stood at PKR~12,532bln                               FY20 Sector Wise GDP Break-Up (%)
  as compared to PKR~12,580bln in FY19.                                           Crops                                                              6.81
                                                                                  Livestock                                                         11.69
• The top 5 sectors in terms of contribution to GDP are (i) Wholesale &           Forestry                                                           0.41
  Retail Trade, (ii) Transport, Storage & Communication, (iii) Other              Fishing                                                            0.40
  Private Services, (iv) Livestock, and (v) Large Scale Manufacturing.            Total Agricultural Sector                                         19.31

                          Sectoral Shares in GDP (FY20)                           Mining and Quarrying                                              2.51
                                                                                  Large Scale Manufacturing                                         9.50
                                                                                  Small Scale Manufacturing                                         2.04
                                           19%                                    Slaughtering                                                      0.94
                                                                                  Electricity Generation + Distribution & Gas Distribution           1.76
                                                            Agricultural Sector   Construction                                                       2.53
                                                                                  Total Industrial Sector                                           19.28
                                                            Industrial Sector
                                                                                  Wholesale & Retail Trade                                          18.17
                                                    19%                           Transport, Storage & Communication                                12.31
            62%                                             Services Sector       Finance & Insurance                                                3.60
                                                                                  Housing Services                                                   6.98
                                                                                  General Government Services                                        8.60
                                                                                  Other Private Services                                            11.75
                                                                                  Total Services Sector                                             61.41

   Note: GDP value is at constant basic prices of 2005-06                                                                             Source: PBS           10
BROKERAGE FIRMS| LOCAL INDUSTRY
Macro Economic Indicators
                                          FY11          FY12          FY13         FY14      FY15      FY16      FY17      FY18      FY19       FY20        1HFY21

Average Inflation Rate (CPI)              11.90%        11.00%            7.40%     8.60%     4.50%     2.90%     4.20%     3.90%     7.30%      10.70%        8.74%

Average KIBOR                             13.45%        12.33%            9.84%     9.88%     8.85%     6.49%     6.11%     6.39%    10.43%      11.95%        7.22%

Monetary Policy Rate (MPR)                13.70%        12.41%            9.91%     9.75%     8.75%     6.04%     5.75%     5.95%     9.69%      11.75%        7.00%

PKRV                                      13.00%        11.91%            9.63%     9.75%     8.67%     6.34%     5.95%     6.26%    10.20%      11.79%        7.15%

Average Exchange Rate                      86.31         89.24            96.83    102.84    101.47    104.37    104.78    110.11    136.45      158.40       164.11

(USD mln)                                 FY11          FY12          FY13         FY14      FY15      FY16      FY17      FY18      FY19       FY20        1HFY21*

Current Account Balance                       214        -4,658           -2,496    -3,130    -2,815    -4,961   -12,270   -19,195   -13,434      -2,970       1,640

Exports                                   25,369        24,718        24,802       25,078    24,090    21,972    22,003    24,768    24,257      22,507        9,550

Imports                                   35,796        40,370        40,157       41,668    41,357    41,118    48,001    55,671    51,869      42,417       18,163

Trade Balance                            -10,427       -15,652       -15,355       -16,590   -17,267   -19,146   -25,998   -30,903   -27,612     -19,910      -8,613

Foreign Exchange Reserve                  18,244        15,289        11,020       14,141    18,699    23,099    21,403    16,384    14,482      18,886       20,512

  *Current Account, Export, Import and Trade Balance are up till Nov-20

                                                                                                                                       Source: SBP, MUFAP         11
BROKERAGE FIRMS | LOCAL INDUSTRY
KSE-100 | Sectoral Composition

• This data is based on market capitalization of                                           Sector Wise KSE-100 Share
  PKR~8.3trn as on 8th Jan, 2021.                      3,500                                                                                                                40%

                                                                                                                                                                      37%
                                                       3,000                                                                                                                35%

• Top seven (7) Sectors contribute ~63% to the total   2,500
                                                                                                                                                                            30%

  Market Capitalization of KSE-100 Index in which
                                                                                                                                                                            25%
  Commercial Banks take the lead.                      2,000
                                                                                                                                                                            20%
                                                       1,500         17%
                                                                                                                                                                            15%
                                                                                 13%
                                                       1,000
                                                                                                                                                                            10%
                                                                                             8%
                                                                                                             7%
                                                        500                                                                   6%           6%
                                                                                                                                                      5%                    5%

                                                          0                                                                                                                 0%
                                                               COMMERCIAL   OIL & GAS    FOOD &        CEMENT         TOBACCO       FERTILIZER   CHEMICAL        Others
                                                                 BANKS    EXPLORATION   PERSONAL
                                                                           COMPANIES      CARE
                                                                                        PRODUCTS

                                                                                            Market Capitalization (PKR bln)        Percentage

                                                                                                                                            Source: KSE Stocks              12
BROKERAGE FIRMS| LOCAL INDUSTRY
KSE-100 Returns | Monthly & Annual
      KSE 100
                       FY11        FY12          FY13         FY14       FY15          FY16        FY17         FY18        FY19        FY20      1HFY21
       Index

   Index Value 12,496             13,801      21,006       29,653       34,399         37,784     46,565     41,911       33,902       34,422      43,755

   Returns (%)         29%          10%           52%         41%        16%            10%        23%          -10%        -19%         2%         27%

      KSE 100
                          CY11            CY12          CY13         CY14         CY15          CY16        CY17          CY18         CY19        CY20
       Index
    Index Value          11,348         16,905       25,261       32,131         32,816       47,807       40,471      37,067          40,735     43,755
     % Change              -4%            49%           49%          27%          2%             46%        -15%            -8%         10%         7%

 KSE 100
             Jul-19    Aug-19    Sep-19    Oct-19    Nov-19    Dec-19    Jan-20    Feb-20       Mar-20   Apr-20    May-20     Jun-20     Jul-20   Aug-20   Sep-20    Oct-20      Nov-20   Dec-20
  Index

   Index
            31,938     29,672    32,079    34,204    39,288    40,735    41,631    37,984       29,232   34,112    33,931     34,422    39,258    41,111   40,571   39,888       41,069   43,755
   Value

    %
              -6%       -7%        8%        7%         15%      4%         2%         -9%      -23%      17%       -1%           1%     14%       5%       -1%       -2%         3%       7%
  Change

Note: Index Values are the closing values on the last trading day of each month/year                                                                        Source: KSE Stocks            13
BROKERAGE FIRMS | LOCAL INDUSTRY
MARKET VOLUMES & CAPITALIZATION

                       KSE-100 AVERAGE VOLUMES                                                                                            Average Market Capitalization (PKR bln)
                                                                                                                         10,000
    300                                                                                                           60%
                                                                                                                                                            9,264
                                            52%                                                                           9,000                                         8,656
                                                                                                                  50%
    250
                                                     41%                                                                  8,000               7,680
                                                                                                                  40%             7,328                                                7,211   7,082
                 34%
                                                                                                                          7,000
    200                                                                                                          30%
                          29%                                                                                 27%
                                                                                23%                                       6,000
                                                                                                                  20%
    150                                                       16%
                                   10%                                                                                    5,000
                                                                       10%                                        10%

                                                                                                         2%               4,000
    100                                                                                                           0%

                                                                                                                          3,000
                                                                                         -10%                     -10%
     50
                                                                                                  -19%                    2,000
                                                                                                                  -20%

                                                                                                                          1,000
      -                                                                                                           -30%
          FY10     FY11     FY12     FY13     FY14     FY15     FY16     FY17     FY18     FY19     FY20 1HFY21
                                                                                                                             -
                                   Annual Avg. Volumes (in mlns)                 Annual Returns                                   CY15        CY16          CY17        CY18           CY19    CY20*

  *CY20 Market Capitalization is till 6th Nov, 2020

                                                                                                                                                      Source: PSX and PACRA Database                   14
BROKERAGE FIRMS | LOCAL INDUSTRY
Fee Income
 • With effect from 14th Oct, 2019, PSX vide Notice No. PSX/N-1258 dated 9th
                                                                                                                                   Minimum Fee (3
   October, 2019 issued a notification regarding implementation of standard          Months            Average Volumes (KSE-100)
                                                                                                                                   paisa Per Share)*
   range/scale of brokerage commission.
                                                                                      Oct-19             125,373,723                  3,761,212
                                                                                     Nov-19              186,241,057                  5,587,232
 • According to the notice, the commission range of 3 paisa per share or              Dec-19             194,287,061                  5,828,612
   0.15% of the transaction value (whichever is higher) up to 2.5% of the             Jan-20             168,350,902                  5,050,527
   transaction value is prescribed.
                                                                                      Feb-20             114,219,097                  3,426,573
                                                                                     Mar-20              178,992,296                  5,369,769
                                                                                      Apr-20             161,345,897                  4,840,377
 • The decision was taken in light of the fact that some brokerage houses
   were charging nominal or zero commission rates, which was adversely               May-20              139,906,300                  4,197,189
   affecting market competitiveness and creating a disadvantage for market            Jun-20             114,903,339                  3,447,100
   participants in the form of disparity in service standards.                        Jul-20             250,330,852                  7,509,926
                                                                                      Aug-20             292,090,393                  8,762,712
                                                                                      Sep-20             354,844,167                 10,645,325
 • As the decision has ensured a minimum commission fee for the brokerage             Oct-20             257,128,176                  7,713,845
   sector, the brokerage firms have gone into profits from core operations in        Nov-20              161,094,871                  4,832,846
   the current year. The decision, however, faced some resistance from the            Dec-20             265,752,275                  7,972,568
   market participants as they believed that it should be a free market based
                                                                                *Effective Date - 14th Oct, 2019
   on the level of services provided and client comfort.

                                                                                                                               Source: PSX             15
BROKERAGE FIRMS| LOCAL INDUSTRY
Market Performance
• The adjacent table shows performance ratios for the KSE
  100 index for the latest calendar year.                                                                                  KSE 100 Indicators
• The price to earnings ratio of the index clocked in at 10.95                                                         Ratios                              CY20
  per share. Meanwhile, the price to book ratio stood at                                         Price to Earnings (P/E)                                  10.95
  1.28 per share. In addition, the Earnings Per Share
  currently stand at PKR~4,164 per share.                                                        Price to Book (P/B)                                       1.28
• The return of the KSE 100 index over the 12 month period                                       Earnings Per Share (EPS)                                 4,164
  of CY20 stood at 5.97%.                                                                        1 Year Return                                            5.97%
• Moreover, the total market capitalization of the entire                                        Market Capitalization* (PKR bln)                         8,298
  stock exchange stands at PKR~8,298bln.

   * Market Capitalization is for entire market while other ratios/return is for KSE 100 index

                                                                                                                                        Source: Bloomberg, PSX    16
BROKERAGE FIRMS| LOCAL INDUSTRY
NET BUY/SELL
                          Net Buy/Sell (PKR mln)                                                                  Net Buy/Sell (USD mln)
 Participants          FY16       FY17      FY18     FY19      FY20      1HFY21    Participants                 FY16        FY17        FY18        FY19        FY20        1HFY21
 Individuals           13,287      -5,526     580    20,796    34,001     26,087   Individuals                    128          -53             5       166          213        159
 Companies             -9,136     13,354    10,853   14,553     4,245     14,595   Companies                       -84        127         100          111           27         91
 Banks / DFIs            -686     -19,648   -1,139    9,009     -8,516   -11,316   Banks / DFIs                        -6     -187         -10          63          -55         -69
 NBFC                  19,498       -631      -907     -172       707       180
                                                                                   NBFC                           188              -6          -8          -2          5         1
 Mutual Funds           3,927     60,460    -3,550   -20,080    -7,792     3,394
                                                                                   Mutual Funds                    39         576          -35         -146         -50         20
 Other Organizations    4,144      2,043     8,547    3,423     4,973       507
                                                                                   Other Organizations             40          -19         78           28           32          3
 Broker Proprietary
                                                                                   Broker Proprietary Trading      -22             -6      -44          -15         -13          -9
 Trading               -2,233       -626    -4,852    -1,801    -2,105    -1,607
                                                                                   Insurance Companies                 0      220         204          150          128         83
 Insurance Companies          -   23,142    22,817   17,887    20,179     13,381
 LIPI NET               6,430     68,483    32,349   43,615    45,691     45,220   LIPI NET                        62         652         289          356          285        279

 Foreign Individuals     328        -513      256        61      -134        26    Foreign Individuals                 3           -5          2           0           -1        0

 Foreign Corporates    -5,512     -70,198   34,936   -44,540   -49,033   -40,191   Foreign Corporates              -53        -669        -312         -362       -306         -247

 Overseas Pakistanis   -1,246      2,241     2,351      865     3,477     -5,055   Overseas Pakistanis             -12         21          21              6         22         -32

 FIPI NET              -6,430     -68,483   32,349   -43,615   -45,691   -45,220   FIPI NET                        -62        -652        -289         -356       -285         -279

                                                                                                                                                    Source: NCCPL               17
BROKERAGE FIRMS| LOCAL INDUSTRY
Regulatory Framework
• The primary regulatory body for brokers is the Securities and Exchange Commission of Pakistan. There are a comprehensive set of regulations that
  govern the activities of brokers. These include the Securities Brokers (Licensing and Operations) Regulations 2016, the SECP Act 1997, the Anti-Money
  Laundering Act 2010 as well as regulations of the Pakistan Stock Exchange (PSX), Central Depository Company (CDC) and National Clearing Company of
  Pakistan (NCCPL)
• The PSX prescribes a standard commission range of 3 paisa per share or 0.15% of the transaction value (whichever is higher) up to 2.5% of the
  transaction value. The table shows the broker categories in the New Broker Regime introduced by the government in 2020. The brokers were required
  to apply for conversion to their specific category by July 2020. The cutoff date for implementation of LC requirement was extended till May 2021 by the
  SECP.
 Categories                         Trading Only                        Trading and Self Clearing                                          Trading and Clearing
                       The broker can only execute            The broker can execute as well as settle        The broker can execute as well as settle its proprietary trades and trades
                       its proprietary trades and trades on   its proprietary trades and trades executed on   executed on behalf of its customers and can keep custody of securities and cash
                       behalf of its customers but cannot     behalf of its customers and can keep custody    owned by it and its customers subject to such conditions as imposed by the
 Description
                       settle executed trades or keep         of securities and money owned by it and its     Commission and, in addition, such securities broker can settle trades of other
                       custody of securities or money         customers subject to such conditions as may     securities brokers and their customers and keep custody of the securities and
                       owned by it and its customers.         be imposed by the Commission.                   cash owned by such other securities brokers and their customers.
 Minimum Net Worth                   PKR 15mln                                PKR 100mln*                                                      PKR 500mln
 Liquid Capital
                                     PKR 5mln                                  PKR 10mln                                                        PKR 50mln
 Requirement
 Minimum Net
                                   Not Applicable                              PKR 10mln                                                        PKR 15mln
 Capital Balance
 Assets Under
                                   Not Applicable                        25 Times of Net Worth                                            35 Times of Net Worth
 Custody Limit
   * This will increase to PKR 125mln from July 1, 2021

                                                                                                                                                            Source: SECP, PSX           18
BROKERAGE FIRMS| LOCAL INDUSTRY
Applicable Tax Laws
 On Brokerage and Commission Income                                            On the Purchase/Sale of Shares

Section                233 Brokerage & Commission                             Section                    233-A Collection of tax by Stock Exchange

                                                                              Sub-Section                233-A (1)(a)                233-A (1)(b)          233-A (1)(c)        233-A (1)(d)
                       Fed / pro/ local Govt company, AOP constituted by or
Responsible Person
                       under any law
                                                                              Responsible Person         PSX                         PSX                   PSX                 PSX
From Whom              Recipient of brokerage or commission                                                                                                Sellers of shares
                                                                                                                                                                             Finance through
                                                                              From Whom                  Member of PSX               Member of PSX         through members
                                                                                                                                                                             members of PSX
Nature of payment /    Brokerage and commission income (Including –                                                                                        of PSX
Transaction            resident agents.                                                                                              On sale of shares in                      From its Member in
                                                                                                         On purchase of shares in                         From its Members
                                                                              Nature of payment /                                    lieu of the                               respect of financing of
                                                                                                         lieu of the commission                           in respect of
                       10 % of the amount of payment                          Transaction                                            commission earned                         carryover trade in
Rate                                                                                                     earned by its Members.                           trading of shares.
                       5 % in case of advertising agents                                                                             by its Members.                           shares business
                                                                                                                                                           0.01%of traded      10 % of carryover
                                                                              Rate                       0.01%of purchase value.     0.01%of sale value.
Adjustable / Final     Final                                                                                                                               value.              charge

                                                                              Adjustable / Final         Minimum tax                 Minimum tax           Minimum tax         Adjustable
Payment of Tax        Provincial Government - the same day.
deducted or collected Other – Within seven days from the end of each week     Payment of Tax deducted or
                                                                                                         Within 7 days from the end of each week ending on every Sunday.
(Rule 43)             ending on every Sunday                                  collected (Rule 43)
                       Monthly - within 20 days of end of each month.         Monthly Statements to be
                                                                                                         Within 20 days of end of each month.
Statements to be filed Annual – within two months of end of financial year.   filed (Rule 44)
(Rule 44)              Extension can be sought from Commissioner u/s 165      Annual Statements to be
                                                                                                         Within 2 months of end of financial year.
                       (4).                                                   filed (Rule 44)

                                                                                                                                                                  Source: SECP                19
BROKERAGE FIRMS | LOCAL INDUSTRY
Business Risk
• This risk arises from the possibility that a broker may experience lower
  than expected profits or may incur a loss. This would prevent the broker
  from providing investors and stakeholders with adequate returns.                   Industry Average              FY17        FY18       FY19           FY20

• The stability and sustainability of income from core operations is key to
                                                                              Fee Based Income Growth              48%             -5%    25%            31%
  minimizing this risk.
• While the industry’s average fee based income has been volatile, it has
                                                                                                  Fee Based Income Growth
  remained positive apart from FY18.
                                                                              60%
• The industry’s fee based income growth stood at ~31% in FY20 as
                                                                              50%
  compared to ~25% in FY19. A stable level of growth reflects positively                   48%
  on earnings sustainability and reduced business risk.                       40%

• Another positive indicator has been the fixation of minimum                 30%                                                                  31%
  commission rate for brokerage services effective from 14th Oct, 2019.                                                        25%

  The industry’s profits from core operations turned positive during the      20%

  previous fiscal year after facing a dip in FY18.                            10%

                                                                               0%
                                                                                        FY17            FY18-5%             FY19                FY20
                                                                              -10%

   Note: Industry Averages are based on 10 Listed/Rated firms

                                                                                                                  Source: PACRA Database, PSX             20
BROKERAGE FIRMS | LOCAL INDUSTRY
Financial Risk
• Credit Risk: It emanates from the inability of clients to pay for the Industry Averages                     FY17     FY18 FY19 FY20
  securities purchased on their behalf. This can be minimized
  through appropriate procedures and controls regarding client          Equity Instruments/Investments           24%     28%      49%     32%
  acceptance and assessment of client credit worthiness.
                                                                        Liquid Assets/(STB+Trade Related
• Market Risk: It arises primarily from adverse movements in            Liabilities)                            109%     74% 165% 128%
  investment values such as the change in stock price of an equity
  instrument. Investors can have different appetites for the level of Equity / Total Assets                      42%     44%      39%     34%
  market risk that they are willing to take on. Moreover, different
  instruments have different levels of risk associated with them.
• The industry’s exposure to market risk can be evaluated through the equity instruments to total investments ratio. The greater share of
  equity indicates greater level of market risk. The industry’s average ratio stood at ~32% in FY20 (FY19: ~49%).

• Liquidity Risk: It occurs due to insufficient funds to meet financial obligations when they become due. This can be minimized by
  maintaining sufficient liquid investments and having the ability to raise funds in a timely and cost-effective manner from external sources.

• The liquidity risk can be evaluated through liquid assets to short-term borrowing and trade related liabilities ratio. The industry has an
  average ratio of 128% in FY20 (FY19: 165%). A ratio above 100% indicates that the firm has enough liquidity to pay off liabilities that may
  arise in the short term.

• The final ratio is the capital adequacy ratio i.e., equity to total assets. The industry’s average for this ratio clocked in at ~34% during FY20
  (FY19: ~39%).

Note: Industry Averages are based on 10 Listed/Rated firms                                                            Source: PACRA Database         21
BROKERAGE FIRMS | LOCAL INDUSTRY
Rating Scale

                     Entity Ratings | PACRA vs VIS                               Broker Management Ratings | PACRA vs VIS
       10                                                              7

                                                                       6
           8

                                                                       5

           6
                                                                       4

                                                                       3
           4

                                                                       2

           2
                                                                       1

           0                                                           0
               AA+   AA       AA-      A+        A   A-   BBB+             BMR1+    BMR1   BMR2++   BMR2+   BMR2     BMR3++   BMR3+   BMR3   BMR4++
     PACRA      0    1         0        0        0   4     0     PACRA       0       2       0        2      0         0        1      2       0
     VIS        0    0         2        2        1   9     0     VIS         0       0       2        3      6         1        0      0       0

                                                                                                                   Source: PACRA Database             22
BROKERAGE FIRMS | LOCAL INDUSTRY
SWOT Analysis
• Strong regulatory oversight through SECP and                                    • Any kind of uncertainty, be it political, social or
  PSX.                                                                              economic can have a negative impact on the
• Stock market is in recovery phase in the last few                                 stock market and in turn on the brokerage firms.
  months as investor confidence is growing.                                       • Some of the regulatory requirements, e.g.
                                                                                    minimum capital , may be difficult for small
                                                                                    brokers to meet.

                                                      Strengths   Weaknesses

 • Uncertainty in the market and amongst                                            • Introduction of new products, such as
   investors due to second wave of COVID-19.                                          Exchange Traded Funds.
 • Delay in availability of vaccination could         Threats     Opportunities     • The economy is in recovery phase which also
   hamper economic recovery.                                                          bodes well for investors in the stock market as
                                                                                      well as brokerage firms.

                                                                                                                                     23
BROKERAGE FIRMS | Outlook & Future Prospects
Outlook: Stable
• The domestic economy has started to gradually recover from the impact of the COVID-19 pandemic which slowed down industrial activities
  and bought various businesses to a halt.
• Industrial activity has picked up in various sectors with the Large Scale Manufacturing Industries output increasing ~5.46% YoY during the first
  four months of FY21. The sectors which have contributed to this growth are textiles, food & beverages, pharmaceuticals and chemicals. Food
  & Beverage sector holds a sizable portion of the Index market capitalization, therefore is a positive sign for the Sector.
• As a result, the stock market has also gradually moved in a positive direction as the economic recovery has picked up due to which investor
  confidence in the market has also increased. KSE-100 Index return for the month of Dec’20 was recorded at ~7% and is expected to continue
  growth trajectory in the absence of any major uncertainty. Following a sluggish movement of over two fiscal years, the KSE-100 benchmark
  has crossed over 45,000 points (12-Jan-21).
• The decision taken by the State Bank of Pakistan (SBP) to lower the policy rate by 625bps to 7% in the last quarter of FY20 has lowered the
  finance costs incurred by brokerage firms.
• The inflation level in the country has also declined. The average inflation rate during the 1HFY21 stood at ~8.74% as compared to an average
  inflation rate of ~10.7% during FY20. Moreover, the exchange rate is also expected to remain stable in the near future.
• However, there is still significant uncertainty in the market due to second wave of COVID-19 across the globe. While global capital markets are
  also showing signs of recovery, a strict lockdown or closure of business activities across major economies can have an indirect impact on
  Pakistan’s market where the country’s export destinations are concentrated. In addition, there is no clarity regarding timeline as to when
  vaccines may become available in the country and mechanism to inoculate the general public.

                                                                                                                                             24
BROKERAGE FIRMS| BIBLIOGRAPHY

•   Pakistan Bureau of Statistics (PBS)
•   Pakistan Stock Exchange (PSX)                            Research Team          Saniya Tauseef                            Insia Raza
•   State Bank of Pakistan (SBP)                                                    Asst. Manager                             Associate Analyst
•   Federal Board of Revenue (FBR)                                                  saniya.tauseef@pacra.com                  insia.raza@pacra.com
•   National Clearing Company of Pakistan Limited (NCCPL)
•   Securities & Exchange Commission of Pakistan (SECP)                        Contact Number: +92 323 8457222
•   PACRA Database
•   Investing.com
•   Securities and Exchange Board of India (SEBI)
•   BSE India
•   Bloomberg
•   https://www.hl.co.uk/news/articles/how-tech-dominates-
    the-us-stock-market                                                                    DISCLAIMER
                                                                  PACRA has used due care in preparation of this document. Our information has been
                                                                  obtained from sources we consider to be reliable but its accuracy or completeness is not
                                                                  guaranteed. The information in this document may be copied or otherwise reproduced, in
                                                                  whole or in part, provided the source is duly acknowledged. The presentation should not be
                                                                  relied upon as professional advice.

                                                                                                                                                         25
You can also read