Bushfire Cost Pass Though Application - Independent Verification and Assessment - TransGrid - Australian Energy ...
←
→
Page content transcription
If your browser does not render page correctly, please read the page content below
Bushfire Cost Pass Though Application –
Independent Verification and Assessment
                                   TransGrid
                              13 November 2020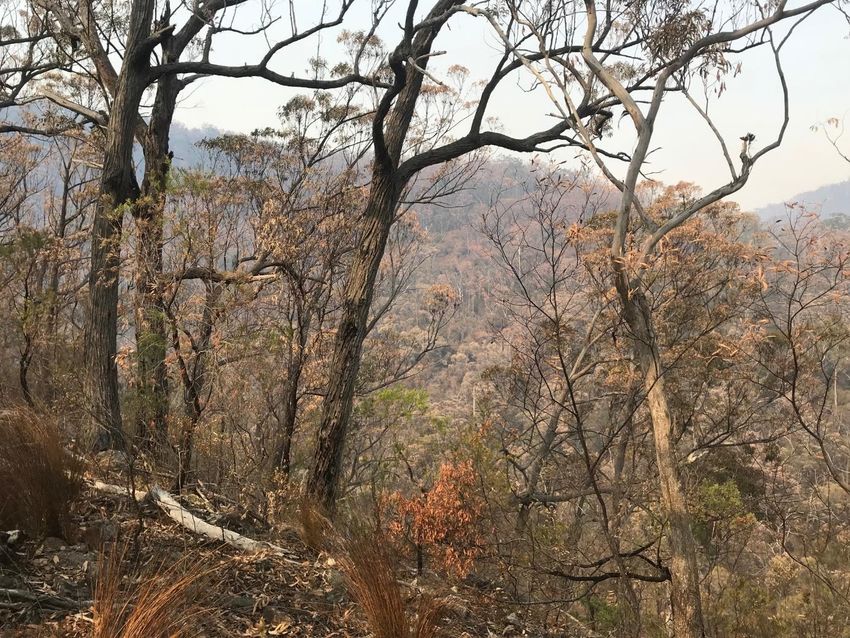
Contents
1. Executive summary ................................................................................................... 0
2. Scope.......................................................................................................................... 2
3. Severity analysis of 2019/20 bushfire season......................................................... 3
4. Cost independent verification and assessment ..................................................... 3
4.1 Regulatory requirements ....................................................................................................... 4
4.1.1 Regulatory requirements assessment ............................................................................ 5
4.1.2 Pass through materiality threshold ................................................................................. 6
4.2 Expenditure incurred and forecasted.................................................................................... 7
4.2.1 TransGrid’s immediate response overview..................................................................... 7
4.3 Actual expenditure ................................................................................................................. 8
4.4 Transmission lines forecast expenditure.............................................................................. 9
4.5 Easements - vegetation management ..................................................................................14
4.6 Contingent project or an associated trigger event ..............................................................17
Figures
Figure 1 Annual rainfall deciles map 2019 .................................................................................................20
Figure 2 Rainfall deciles map 1 Jan 2018 to 31 Dec 2019 .........................................................................21
Figure 3 Australian rainfall deciles 1 Apr 2017 to 30 Sep 2019 ..................................................................21
Figure 4 Two year rainfall decile map comparison for NSW severe fire seasons ........................................22
Figure 5 Modelled root zone soil moisture – September 2019 ....................................................................25
Figure 6 Modelled root zone soil moisture – December 2019 .....................................................................25
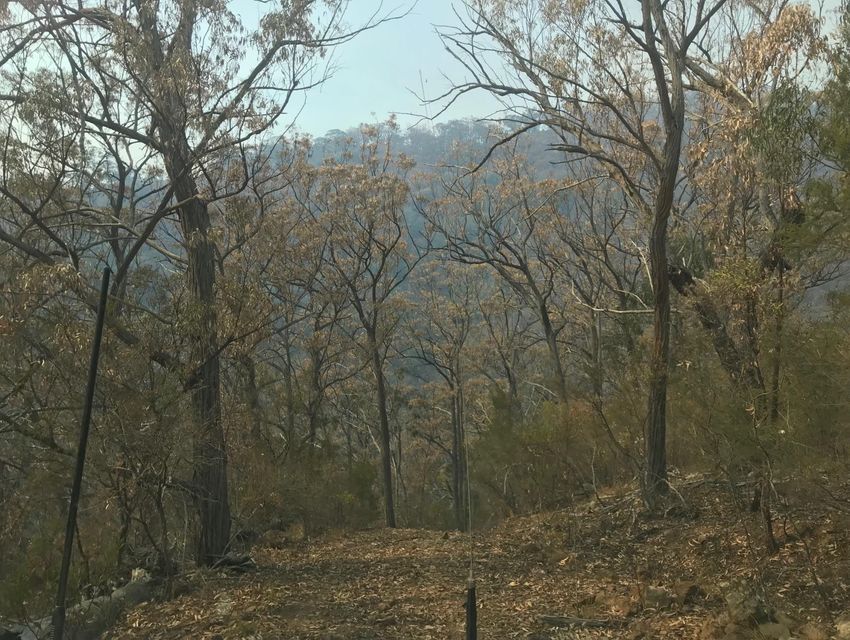
Figure 7 Severe drought stress evident in forest near Burragate (Towamba Valley) ...................................27
Figure 8 Severe drought stress impact on tree canopies near Burragate (Towamba Valley) ......................28
Figure 9 NSW monthly mean temperature decile maps August – December 2019 .....................................30
Figure 10 NSW monthly 3pm vapour pressure anomaly – August to December 2019 ..................................32
Figure 11 3PM vapour pressure ‘humidity’ deciles for spring 2019 ...............................................................33
Figure 12 Accumulated FFDI deciles – spring 2019 .....................................................................................34
Figure 13 Copy of Figure 3 from TransGrid Cost Pass Through Application .................................................42
Tables
Table 1 Incremental expenditure increase from 2019-20 bushfires event ($M, Real 2017-18) ....................... 0
Table 2 Incremental expenditure increase from 2019-20 bushfires event ($M, Real 2017-18) ....................... 4
Table 3 Incremental cost increase breakdown from 2019-20 bushfires ($M, Real 2017-18) .......................... 4
Table 4 Assessment considerations ............................................................................................................. 5
Table 5 Building block costs for eligible pass through amount ($M, Nominal) ................................................ 6
Table 6 Pass through application thresholds – incremental building block costs ........................................... 7
GHD ADVISORY
ii
GHD Report for TransGrid – Bushfire Cost Pass Though
Application – Independent Verification and Assessment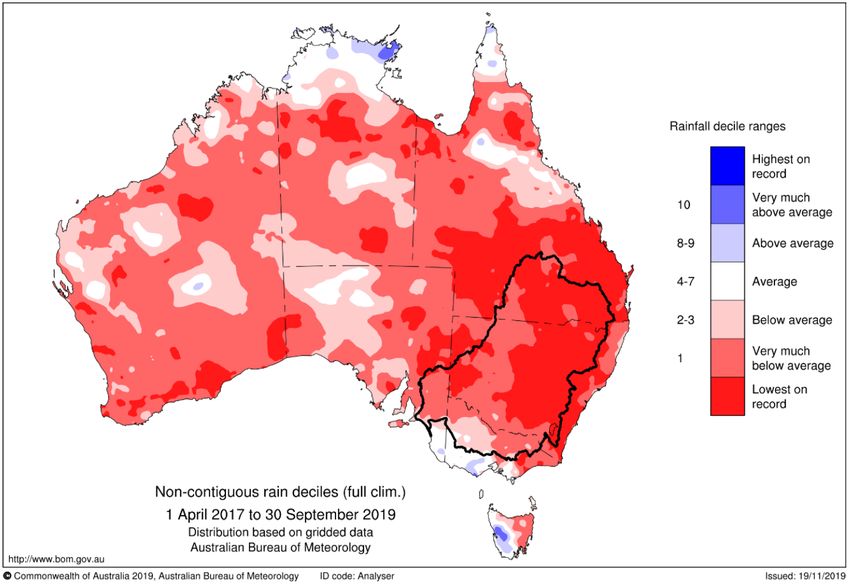
Table 7 Actual costs for the 2019-20 bushfires (Real $2017-18) ................................................................... 8
Table 8 Breakdown of actual expenditure (Real $2017-18) ........................................................................... 8
Table 9 Summary of forecasted transmission line costs...............................................................................10
Table 10 Examination of various aspects for selected transmission line forecast expenditure ......................11
Table 11 Forecasted vegetation management remediation costs for the 2019-20 bushfires (Real $2017-18)
...................................................................................................................................................................15
Table 12 Bushfire damage summary – Hazard Trees (Real $2020-21) ........................................................15
Table 13 Rainfall rank against all years for long-term weather stations near fire-impacted areas..................23
Table 14 Forecasted expenditure XXXXX ...................................................................................................43
Table 15 Labour costs XXXXX ....................................................................................................................43
Table 16 Material costs XXXXX ..................................................................................................................44
Table 17 Risk costs XXXXX ........................................................................................................................45
Table 18 Forecasted expenditure XXXXX ...................................................................................................45
Table 19 Labour costs XXXXX ....................................................................................................................46
Table 20 Material costs XXXXX ..................................................................................................................46
Table 21 Risk costs XXXXX ........................................................................................................................47
Table 22 Forecasted expenditure XXXXX ...................................................................................................47
Table 23 Labour costs XXXXX ....................................................................................................................48
Table 24 Material costs XXXXX ..................................................................................................................48
Table 25 Risk costs XXXXX ........................................................................................................................49
Table 26 Forecasted expenditure XXXXXXXXXXXXXXXXXXXXX ..............................................................49
Table 27 Labour costs XXXXXXXXXXXXXXXXXXXXXX.............................................................................50
Table 28 Material costs XXXXXXXXXXXXXXXXXXXXXX ...........................................................................50
Table 29 Risk costs XXXXXXXXXXXXXXXXXXXXX ...................................................................................51
Table 30 Forecasted expenditure XXXXX ...................................................................................................51
Table 31 Labour costs XXXXX ....................................................................................................................52
Table 32 Material costs XXXXX ..................................................................................................................53
Table 33 Risk costs XXXXX ........................................................................................................................53

Appendices
Appendix A - Severity analysis of 2019/20 bushfire season .........................................................................19
Appendix B - Transmission line forecasts ....................................................................................................43
Appendix C – Glossary ...............................................................................................................................55
Appendix D – References ...........................................................................................................................57

          GHD ADVISORY
  iii
          GHD Report for TransGrid – Bushfire Cost Pass Though
          Application – Independent Verification and Assessment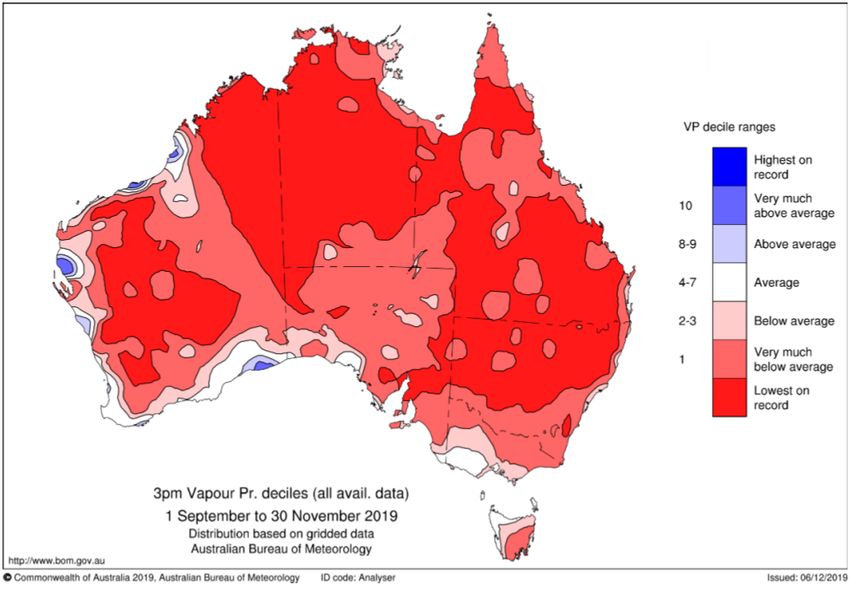
1.                Executive summary
TransGrid have prepared a bushfire pass through application in relation to the additional expenditure that
have incurred as a results of the 2019-20 bushfire season. Their bushfire cost pass through application
details that TransGrid has incurred $10.6 million ($Real 2017-18) and expects to incur a further $39.2 ($Real
2017-18) in additional expenditure as a result of the 2019-20 bushfires, which is not included in their 2018-23
Revenue Determination.
The following table summarises TransGrid’s pass through application request.
Table 1 Incremental expenditure increase from 2019-20 bushfires event ($M, Real 2017-18)

    Expenditure                     2019                    2020              2021         2022     Total
    category
                                                                                                  ($ million)

    Opex                               -                      8.8             11.9         28.1      48.8

    Capex                              -                      1.0               -           -        1.0

    Total                              -                      9.8             11.9         28.1      49.8

The unprecedented nature of the 2019-20 bushfire season has been well documented. The independent
NSW Bushfire Inquiry Final Report (NSW Inquiry Final Report) described the 2019-20 bushfires as1:
“…extreme, and extremely unusual. It showed us bushfires through forested regions on a scale that we have
not seen in Australia in recorded history, and fire behaviour that took even experienced firefighters by
surprise”
TransGrid’s Cost Pass Through Application 2019-20 Bushfires (Application) executive summary,
summarises the resulting impact on their network. Across the remainder of this document and the
supporting Expenditure Forecasting Methodology for 2019-20 Bushfires, this impact is further detailed.
In response to the bushfire events, TransGrid took prudent and efficient actions in incurring emergency
expenditure to make the network safe and to restore services.

These immediate actions also included detailed condition assessments to determine the extent of network
damage. The results of these condition assessments were recorded in the Asset Inspection Manager
System (ASIMS) for further assessment / analysis and underpin the forecasted expenditure included in the
pass through application.
GHD has independently assessed the 2019-20 bushfire season and the impact on TransGrid’s network in
section 3 to confirm the unprecedented nature of the event.

GHD has also independently assessed the regulatory requirements for pass though applications in section 4.
This analysis confirms that:

1
    Final Report of the NSW Bushfire Inquiry, 31 July 2020 p. iv (NSW Bushfire Inquiry).

            GHD ADVISORY
    0
            GHD Report for TransGrid – Bushfire Cost Pass Though
            Application – Independent Verification and Assessment
•    TransGrid has experienced a positive change event elevating costs materially higher than Business
         as Usual (BAU) than it would have incur but for that event
    •    The quantum of the incremental expenditure incurred and forecasted, exceeds the regulatory
         threshold for materiality
    •    Our selection testing confirms that expenditure incurred and forecasted relates to the positive
         change event and is incremental to BAU
    •    Our consideration of the forecasting methodology and selection testing of forecast elements
         indicates that the identification of remediation requirements was prudent and cost forecasting
         efficient
    •    Nothing has come to GHD’s attention that would suggest that the expenditure contained in
         TransGrid’s bushfire pass through application relates to contingent projects or an associated trigger
         event.

        GHD ADVISORY
1
        GHD Report for TransGrid – Bushfire Cost Pass Though
        Application – Independent Verification and Assessment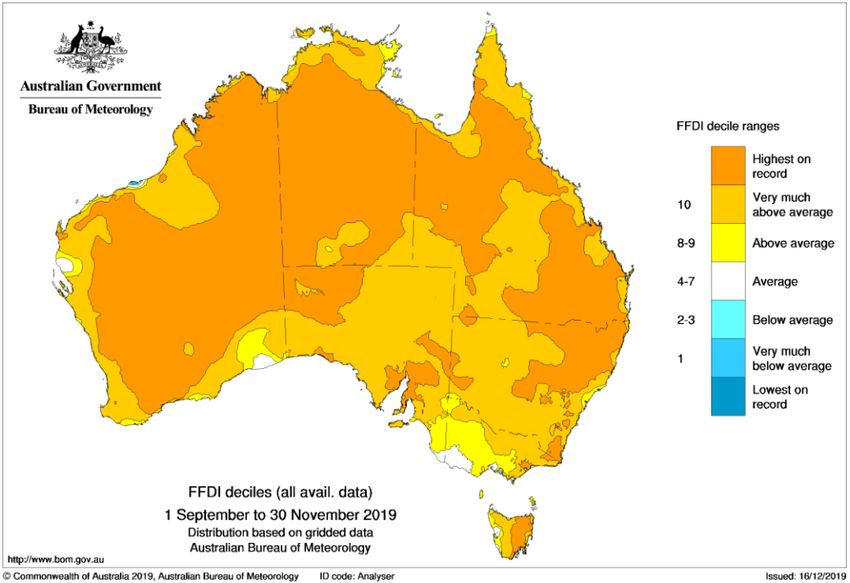
2.             Scope
The scope of the assessment includes:
     •    Detailed analysis of the drought / rainfall and fire weather severity conditions in NSW which led to
          the severe / unprecedented conditions during the bushfire season
     •    Analysis of the scale of fire occurrence, size and impact in NSW which greatly contributed to those
          fires becoming uncontrollable, resulting in the large and abnormal scale of network impact and
          damage
     •    Comparative analysis of the scale and cost of the bushfire damage (to TransGrid’s network) in the
          2019-20 fire season relative to recent years, based upon data provided by TransGrid

     •    Independent assessment of the incremental costs incurred as a result of the 2019-20 fire season.
This report has been prepared by GHD for TransGrid and may only be used and relied on by TransGrid for
the purpose agreed between GHD and the TransGrid as set out above.
GHD otherwise disclaims responsibility to any person other than TransGrid arising in connection with this
report. GHD also excludes implied warranties and conditions, to the extent legally permissible.

The services undertaken by GHD in connection with preparing this report were limited to those specifically
detailed in the report and are subject to the scope limitations set out in the report.
The opinions, conclusions and any recommendations in this report are based on conditions encountered and
information reviewed at the date of preparation of the report. GHD has no responsibility or obligation to
update this report to account for events or changes occurring subsequent to the date that the report was
prepared.

The opinions, conclusions and any recommendations in this report are based on assumptions made by GHD
described throughout this report. GHD disclaims liability arising from any of the assumptions being incorrect.
GHD has prepared this report on the basis of information provided by TransGrid and others who provided
information to GHD, which GHD has not independently verified or checked beyond the agreed scope of
work. GHD does not accept liability in connection with such unverified information, including errors and
omissions in the report which were caused by errors or omissions in that information.
GHD has prepared comparative estimates using information reasonably available to the GHD employee(s)
who prepared this Report, and based on assumptions and judgments made by GHD.
The comparative estimates has been prepared for the purpose of supporting TransGrid in their CPA
submission and must not be used for any other purpose.
The comparative estimates are a preliminary estimate only in 2019 real Australian dollars. Actual prices,
costs and other variables may be different to those used to prepare the comparative estimates and may
change. Unless as otherwise specified in this Report, no detailed quotation has been obtained for matters
identified in this Report. GHD does not represent, warrant or guarantee that the works can or will be
undertaken at a cost which is the same or less than the comparative estimates.

Where estimates of potential costs are provided with an indicated level of confidence, notwithstanding the
conservatism of the level of confidence selected as the planning level, there remains a chance that the cost
will be greater than the planning estimate, and any funding would not be adequate. The confidence level
considered to be most appropriate for expenditure modelling purposes will vary depending on the

         GHD ADVISORY
 2
         GHD Report for TransGrid – Bushfire Cost Pass Though
         Application – Independent Verification and Assessment
conservatism of the user and the nature of the project. The user should therefore select appropriate
confidence levels to suit their particular risk profile.

3.             Severity analysis of 2019/20 bushfire
               season
In Appendix A of the report GHD has undertaken:
     •    Detailed analysis of the drought / rainfall and fire weather severity conditions in NSW which led to
          the severity / unprecedented conditions during the bushfire season
     •    Analysis of the scale of fire occurrence, size and impact in NSW which greatly contributed to those
          fires becoming uncontrollable and resulting in the large and abnormal scale of network impact and
          damage.
GHD considers there is very strong evidence that the fire events of 2019-20 in NSW are unprecedented, with
the scale of very high severity fire not seen on such a scale in NSW before.

GHD considers that a very high proportion of the bushfire damage incurred by TransGrid occurred during
Severe to Catastrophic Forest Fire Danger Index (FFDI) conditions, on account of the timing of network fault
and outage incidents being coincident with such conditions.

Further, a very high proportion of the fire damage incurred by TransGrid, occurred at fires declared by the
NSW Rural Fire Service (RFS) to be Section 44 fires. These fires are incapable of control or suppression by
the fire fighting authority and requiring the RFS Commissioner to take control and responsibility for those
fires under Section 44 of the Rural Fires Act.
GHD also notes that during the periods in which damage to TransGrid’s network was occasioned, a State of
Emergency was declared at those times by the NSW Premier, there being three such 7 day periods during
the 2019/20 fire season, the first declared on 11 November 2019, the second on 19 December 2019, and the
third on 2 January 2020.
For the above reasons, and based on the evidence presented in Appendix A, GHD agrees with TransGrid’s
assessment that the 2019-20 fires in NSW were, collectively, a ‘natural disaster’ cost pass through event
which occurred during the 2018/19 – 2022/23 regulatory control period.

4.             Cost independent verification and
               assessment
As detailed in Section 3 and supported by the evidence presented in Appendix A, the 2019/20 bushfire
season was seen as unprecedented.
TransGrid has incurred and has forecasted additional opex and capex as a direct result of the 2019-20
bushfires.

The Application outlines that TransGrid will incur additional expenditure, over BAU expenditure as a direct
result of the season’s bushfires, as listed in Table 2 and Table 3 below.

         GHD ADVISORY
 3
         GHD Report for TransGrid – Bushfire Cost Pass Though
         Application – Independent Verification and Assessment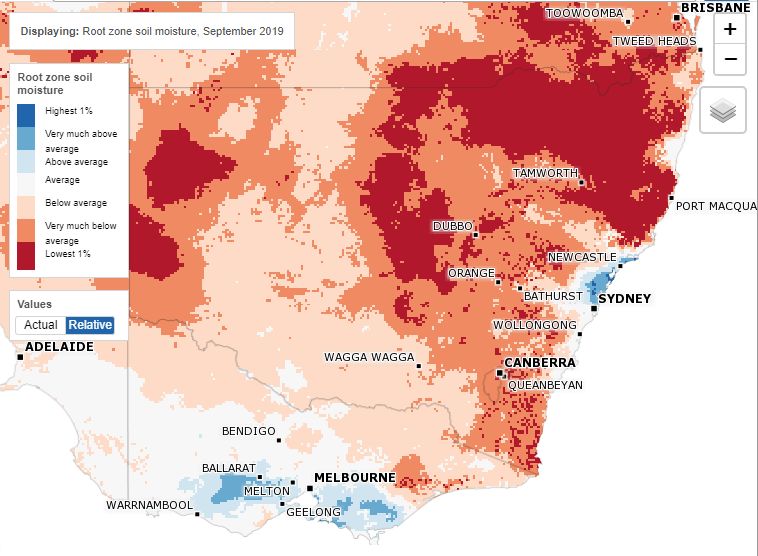
Table 2 Incremental expenditure increase from 2019-20 bushfires event ($M, Real 2017-18)

    Expenditure                     2019                    2020              2021            2022              Total
    category
                                                                                                              ($ million)

    Opex                               -                      8.8             11.9            28.1               48.8

    Capex                              -                      1.0                  -           -                 1.0

    Total                              -                      9.8             11.9            28.1               49.8

Table 3 Incremental cost increase breakdown from 2019-20 bushfires ($M, Real 2017-18)

    Category                                                  2019          2020       2021          2022         Total
                                      Reference
                                                                                                                ($ million)

    Opex

        Transmission lines            Section 4.4                   -       7.5        7.0           28.0          42.5

        Easements                     Section 4.5                   -       0.9        4.8           0.1            5.8

        Substations                   -                             -       0.2         -             -             0.2

        Communication and                                                                                           0.1
                                      -                             -       0.1         -             -
        protection

        Property                      -                             -       0.1         -             -             0.1

        Pass-through                                                                                                0.1
                                      -                                 -     -         0.1               -
        Application

    Capex

        Transmission lines            Section 4.4                   -       1.0         -             -             1.0

    Total                                                           -       9.8        11.9          28.1          49.8

4.1                Regulatory requirements
The National Electricity Rules (NER), details in Section 6A.7.32 the types of events relevant for transmission
cost pass throughs, including:
        •    A positive change event which is defined3 as “a pass through event which entails the Transmission
             Network Service Provider incurring materially higher costs in providing prescribed transmission
             services than it would have incurred but for that event, but does not include a contingent project or
             an associated trigger event”

2
    Ref. [3], pp. 908-915[3],
3
    Ref. [3], Chapter 10, p. 1298

            GHD ADVISORY
    4
            GHD Report for TransGrid – Bushfire Cost Pass Though
            Application – Independent Verification and Assessment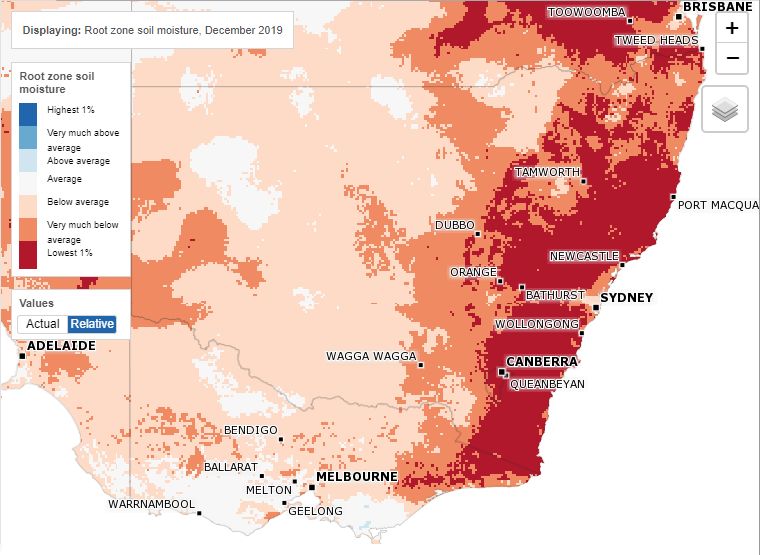
•    Any other event specified in a transmission determination as a pass through event for the
             determination4 (pass through event) which includes a ‘natural disaster’ event as per TransGrid’s
             2018-23 revenue determination5 “Natural Disaster Event means any natural disaster including but
             not limited to fire, flood or earthquake that occurs during the 2018/19 – 2022/23 regulatory control
             period that increases the costs to TransGrid in providing prescribed transmission services, provided
             the fire, flood or other event was not a consequence of the acts or omissions of the service provider”
The NER defines6 the eligible pass through amount as “In respect of a positive change event for a
Transmission Network Service Provider, the increase in costs in the provision of prescribed transmission
services that, as a result of that positive change event, the Transmission Network Service Provider has
incurred and is likely to incur (as opposed to the revenue impact of that event) until:
        (a) unless paragraph (b) applies – the end of the regulatory control period in which the positive change
            event occurred; or
        (b) if the transmission determination for the regulatory control period following that in which the positive
            change event occurred does not make any allowance for the recovery of that increase in costs
            (whether or not in the forecast operating expenditure or forecast capital expenditure accepted or
            substituted by the AER for that regulatory control period) – the end of the regulatory control period
            following that in which the positive change event occurred.”

4.1.1             Regulatory requirements assessment
GHD’s independent verification and assessment has considered the regulatory requirements detailed in the
section above, and has summarised our assessment in Table 4 below.
Table 4 Assessment considerations

    Topic                   Consideration                                                                       Report section

    Pass through            Section 3 and Appendix A support the occurrence of a pass through event.            Section 3 and
    event                                                                                                       Appendix A

    Positive change         GHD independently verified the materiality threshold performed by TransGrid         Section 4.1.2
    event                   and we are satisfied the materiality threshold is met for the 2019-20 bushfires
                            to be defined as a pass through event.

                            To verify that the expenditure relates to the pass through event, GHD has
                            tested selections, detailed in the following sections to confirm the cause and to
                            consider if is it incremental to BAU.

                            The following sections include selection testing deigned to validate that the
                            expenditure relates to the bushfire events and whether the forecasts represent
                            a prudent and efficient solution.

                                  •    Actual expenditure                                                       Section 4.3
                                  •    Transmission lines                                                       Section 4.4

4
    Ref. [3], clause 6A.7.3(a1)(5), p. 900
5
    Ref. [4], p. 37
6
    Ref. [3], Chapter 10, p. 1267

            GHD ADVISORY
    5
            GHD Report for TransGrid – Bushfire Cost Pass Though
            Application – Independent Verification and Assessment
Topic                   Consideration                                                                           Report section

                               •    Vegetation management                                                        Section 4.5

                         Nothing has come to GHD’s attention that would indicate that the expenditure            Section 4.6
                         incurred and forecasted to be incurred relates to a contingent project or an
                         associated trigger event.

 Eligible pass           Is the pass through amount requested by TransGrid supported?                            Satisfaction of the
 through amount                                                                                                  assessments
                                                                                                                 detailed in the
                                                                                                                 rows above will
                                                                                                                 support the pass
                                                                                                                 through amount
                                                                                                                 requested by
                                                                                                                 TransGrid.

4.1.2          Pass through materiality threshold
TransGrid’s Application details the calculation of the pass through amount as detailed in Table 5 below. Their
pass through claim is $49.8 million ($Real 2017-18) in expenditure terms, or $53.2 million ($Nominal) in
building block cost terms.
Table 5 Building block costs for eligible pass through amount ($M, Nominal)
                                                                                                                         Total
                                                2018-19          2019-20   2020-21     2021-22          2022-23
                                                                                                                      ($ million)

 Return on capital                                   -              -        0.1          0.1             0.1             0.2

 Return of capital                                   -              -       (0.0)        (0.0)           (0.0)            (0.0)

 Opex                                                -             9.2      12.8         31.0             0.0             53.0

 Tax allowance                                       -              -        0.0          0.0             0.0             0.0

 Maximum allowance revenue                           -             9.2      12.9         31.0             0.1             53.2
 (unsmoothed)

 Maximum allowance revenue                           -              -         -          50.2             5.3             55.5
 (Smoothed)

As detailed in the Application, TransGrid can only make a claim if the event has led to ‘incurring materially
higher costs in providing prescribed transmission services’.

         GHD ADVISORY
 6
         GHD Report for TransGrid – Bushfire Cost Pass Though
         Application – Independent Verification and Assessment
The NER defines the term ‘materially’ as a ‘change in costs (as opposed to the revenue impact)’ that
‘exceeds one per cent of the maximum allowable revenue for the Transmission Network Service for that
regulatory year’7.
The analysis included in the Application details that they have satisfied this test.
Table 6 Pass through application thresholds – incremental building block costs
Total
2018-19 2019-20 2020-21 2021-22 2022-23
($ million)
Maximum Allowable Revenue 734.3 759.5 779.5 828.2 865.2 3,966.7
(MAR)
Incremental costs – 2019-20 734.3 768.8 792.4 859.2 865.3 4,019.9
bushfires plus MAR
Difference - 9.2 12.9 31.0 0.1 53.2
Materiality of bushfire event (%) 0.0% 1.2% 1.7% 3.7% 0.0% 1.3%
To support TransGrid’s assertion, GHD has:
• Confirmed that the calculation of the materiality threshold is suitable
• Confirmed that the MAR amounts to TransGrid’s Post Tax Revenue Model (PTRM)
• Validated that the incremental costs to expenditure incurred and forecasted to be incurred relate only
to the pass though event (as described in the following sections)
4.2 Expenditure incurred and forecasted
To present an understanding of the pass through application amount, GHD has:
• Detailed TransGrid’s immediate response to the bushfire events in Section 4.2.1. This is relevant as
it creates an understanding of the expenditure incurred to date in Section 4.2.2
• Detailed expenditure incurred and forecasted to be incurred in the following sections.
4.2.1 TransGrid’s immediate response overview
The Application details the immediate activities undertaken by TransGrid to make assets safe and to restore
services. These activities included:
• Emergency works to make hazardous situations safe and restore assets which were rendered
inoperable. This included establishing safe access to the transmission lines, replacing burnt out
wood poles, restoring broken conductors, replacing damaged insulators and restoring auxiliary
supplies to switching stations and communications sites. These emergency works have been
recorded as actual expenditure detailed in section 4.3 below.
7
Ref. [3], p. 1292
GHD ADVISORY
7
GHD Report for TransGrid – Bushfire Cost Pass Though
Application – Independent Verification and Assessment• TransGrid also conducted condition assessments in two stages:
o Stage 1 – network integrity assessment to determine the immediate integrity of the network in
January 2020 and to inform the extension or removal of market constraints imposed by AEMO.
o Stage 2 – detailed condition assessments to determine the extent of network damage. The
results were recorded in the ASIMS where work orders for repairs were then issued in
accordance with TransGrid’s corrective maintenance process.
4.3 Actual expenditure
The Application details that TransGrid incurred actual expenditure of $10.6 million ($Real 2017-18) between
1 July 2019 and 30 September 2020 as a direct result of the 2019-20 bushfires.
The actual expenditure detailed in Table 7 were extracted from the Ellipse Enterprise Resource Planning
(ERP) system and represent the expenditure booked to work orders created specifically to record the costs
of the 2019-20 bushfire event.
Table 7 Actual costs for the 2019-20 bushfires (Real $2017-18)
Expenditure 2019 2020 2021 2022 Total
category
($ million)
Opex - 8.8 0.8 - 9.6
Capex - 1.0 - - 1.0
Total - 9.8 0.8 - 10.6
Table 8 Breakdown of actual expenditure (Real $2017-18)
Expenditure 2019 2020 2021 2022 Total
category
($ million)
Opex
Transmission - 7.6 0.6 - 8.2
lines
Sub stations - 0.2 - - 0.2
Communication - 0.1 - - 0.1
and protection
Property - 0.1 - - 0.1
Easements - 0.9 0.2 - 1.0
Capex
Transmission - 1.0 - - 1.0
lines
GHD ADVISORY
8
GHD Report for TransGrid – Bushfire Cost Pass Though
Application – Independent Verification and AssessmentExpenditure 2019 2020 2021 2022 Total
category
($ million)
Total 10.6
To verify that the actual expenditure incurred related to the pass through event, GHD made a selection from
the ERP data set representing the actual expenditure. Our selection testing of 2 asset types covering 40%
of the supporting data set found the activities carried were as a result of 2019-20 bushfires. Our selection
testing found that the expenditure related to the 2019-20 bushfire event and was not BAU.
4.4 Transmission lines forecast expenditure
As detailed in the Application, TransGrid’s impacted zones included 999 km in route length and 9000 km of
line conductors and earth wires (9 per cent of TransGrid’s transmission line route length) and 2,681
transmission line structures comprising 1,822 steel lattice tower and pole structures, 596 wood poles
structures and 263 concrete structures.
All forecasted expenditure associated with transmission line are opex.
In forecasting the required remediation expenditure, TransGrid has used the combination of recent
transmission line capital project delivery experience (including remediation works on 2019-20 bushfire
damage assets) and its BAU cost estimation processes applied to its prescribed expenditure.
Generally, the basis for the cost estimate (unit rates, contractor cost, lump sum allowance etc.) is
summarised as follows:
• TransGrid referred to the project experience of stage 1 remediation works for the damaged XXXX to
derive the estimates for contractor civil work, contractor electrical work and duration based project
set-up costs. It also used this experience to factor its estimate for network topography and location
based civil, accessibility and outage management costs. Finally, it used this recent experience to
refine / revise its BAU or existing cost information stored in the Success Estimator Database and / or
Ellipse Inventory Management System for new transmission lines material items.
• TransGrid referred to schedule of rates for various cost items from its existing contractor panel
members and market sourced information.
• Geospatial information and aerial photography were analysed, along with project experience of stage
1 remediation works for the damaged XXXX, to estimate the allowance for access risk. Additional
risk allowance is also calculated and added to the estimate to incorporate the unknown factors and
variables such as weather, material cost, geotechnical information, project delays, and the ongoing
COVID-19 pandemic restriction to provide an expected P50 cost.
Generally, the basis for the volumetric or material quantities (labour hours, distances, item count, duration
etc.) is summarised as follows:
• TransGrid referred to the project delivery plan and schedule prepared by its Work Delivery business
unit
GHD ADVISORY
9
GHD Report for TransGrid – Bushfire Cost Pass Though
Application – Independent Verification and Assessment• TransGrid referred to its established project and safety management systems and requirements to
estimate the required labour hours (internal and outsourced) to deliver the planned remediation
works
• Identified through inspection and condition assessment and sourced from Asset Manager List of
work orders, post bushfire aerial photography of the defects, spatial Information, and asset drawings
and records, such as line schedules.
This approach to determining the forecast expenditure is detailed in Section 5.2 of the Forecasting
Methodology for 2019-20 Bushfires. This document details that in developing remediation expenditure
estimates TransGrid has:
• Only included the minimum works needed to return the assets to the condition they were in prior to
the bushfire event. For example, replacing only the affected phases
• Only included works where the risk of leaving the asset in its current state would compromise the
safety or performance of the transmission network within the timeframe of the current regulatory
control period. That is, damage which has been deemed non-urgent will continue to be monitored by
TransGrid rather than repaired
• Deducted from the costings any avoided vegetation maintenance activities that would have been
incurred had the bushfires not occurred. For example, vegetation clearing costs in locations where
the fires have effectively eliminated the encroaching vegetation
• Excluded from the scope any opportunistic replacement and maintenance activities. The scope only
includes activities for damages directly caused by the 2019-20 bushfires event.
The following Table 9 summarises the total cost estimated and forecasted to occur from Autumn of 2021 to
Autumn of 2022.
Table 9 Summary of forecasted transmission line costs
Total
Transmission Line Section reference
($ million)
Forecasted expenditure (Real $2020-21):
XXXXX 5.7.1 10.8
XXXXX 5.7.2 6.5
XXXXX 5.7.3 3.4
XXXXX XX XX 5.7.4 8.4
XXXXX 5.7.5 5.7
Other Lines - 0.8
Total forecasted expenditure (Real $2020-21) 35.6
Total forecasted expenditure (Real $2017-18) 34.3
8.2 (opex)
Actual expenditure (Real $2017-18) Table 8
1.0 (capex)
Total (Real $2017-18) 42.5 (opex)
GHD ADVISORY
10
GHD Report for TransGrid – Bushfire Cost Pass Though
Application – Independent Verification and AssessmentTotal
Transmission Line Section reference
($ million)
1.0 (capex)
The total estimate in the above table includes all cost components (i.e. incremental internal and outsourced
labour hours, expenses, contractor costs, unitised costs, non-unitised costs, and risk allowance) and is
expressed in 2017-18 Real dollar terms in order to align the cost values with the same terms in TransGrid’s
current regulatory period PTRM.
Detailed information on each of the transmission line listed in the above table including the respective
damage summary (including photographs), scope of repair work, material cost estimate, labour cost estimate
and risk cost estimate is provided in the Expenditure Forecasting Methodology for 2019-20 Bushfires. This
information are not replicated in this report in the interests of brevity.
In order to independently verify the build-up of these transmission line forecast expenditure, GHD examine
the following aspects of the investment decision and cost estimation:
• The enduring need to retain these damaged assets
• The basis of expenditure decision to repair these damaged assets
• Review the formulation of the cost estimate (unit rates, contractor cost, lump sum allowance etc.)
and corroborate from its reference sources and assumptions
• Review the identification of the volumetric or material quantities (labour hours, distances, item count,
duration etc.) and corroborate from its reference sources and assumptions
• Review the inputs and underlying assumptions for risk allowance build-up and its interaction with
project management and controls allowance
• Determine if the proposed cost estimates are consistent with the approach that TransGrid described
in its Expenditure Forecasting Methodology document (i.e. including only minimum work, risk based
repair decision, avoiding double counting and opportunistic expenditure)
• Scope to optimise the delivery of these remediation work in terms of work scheduling and in
leveraging BAU asset management functions.
These aspects were examined by reviewing the following selected samples of transmission lines:
• XXXXX
• XXXXX
• XXXXX, XXXXX and XXXXX
These selections constitute 72% of the total proposed forecast expenditure and also includes maximum
diversity of cost estimate inputs allowing us to gain confidence in the overall expenditure forecasting process
followed. Our observations are documented in the following Table 10.
Table 10 Examination of various aspects for selected transmission line forecast expenditure
Aspects Observations
Need The examined (and also the remaining) transmission lines forms part of NSW and ACT
electricity transmission backbone and form part of the NEM grid that allow inter region
energy trading, especially between NSW and Victoria. They are crucial infrastructures that
GHD ADVISORY
11
GHD Report for TransGrid – Bushfire Cost Pass Though
Application – Independent Verification and AssessmentAspects Observations
transport electricity generated by Snowy Hydro to the load centres in NSW and ACT. The
XXXXX XXXXXXXX XX XXXXXX and therefore is an important link to the VNI
interconnector. Review of TransGrid’s 2020 Transmission Annual Planning Report indicate
fairly utilised transmission lines given their location in the wider network topography and
allowing for the N-1 contingency.
Decision We examined the expenditure decision by reviewing the basis such as evidence of
damages to the asset, the impact of those damages to its functional performance and the
corrective maintenance process which is aligned to ISO55001 certified asset management
system. We reviewed the photographs of damaged assets, metallurgical test report of
damaged conductors that formed the basis of TransGrid’s engineering condition
assessments, and the records of defect work order prioritisation process.
We are satisfied that the expenditure decision made by TransGrid is reasonable and that
the decisions related to activities incremental to BAU.
Timing We reviewed the proposed timeline and duration of the repair work considering the nature
of work, geographical location, resource availability/ constraints (including internal,
outsourced and contractor), outage window constraints due to Snowy Hydro generation,
and the seasonal demand profile of Southern NSW and Northern Victoria.
We are satisfied that the expenditure timeline and duration proposed by TransGrid is
reasonable.
Cost estimates We reviewed the build-up of cost items from past project records, competitive market
quotes and unitised cost information saved in TransGrid’s Success Estimation database
used in formulating the contractor costs (for e.g. weekly labour rate, per km track access
rate and weekly establishment rate) and material unitised rates (for e.g. conductor rate,
insulator rate, fittings, construction pad set-up rate and gravel). We also reviewed hourly
labour rates of various types of skill sets (managers, engineers, switching, HSE etc.),
penalty rates, allowance and expenses in delivering these damage repair works.
We are satisfied that the cost estimates and their underlying build-up used in forecasting
the expenditure are reasonable.
Volumetric or We reviewed the build-up of material and duration quantities (km, unit item, weeks) and
quantity estimate their respective basis such as geo-spatial inputs, asset condition assessment, engineering
judgement and assumption, outage and operational constraints, HSE requirements, and
the proposed workforce capability. We also reviewed the build-up of internal and
outsourced labour hours and its basis such as scope of work, type of activities, project
team set-up, need for multiple site work fronts, and TransGrid’s construction risk and HSE
system requirements.
We are satisfied that the volumetric or quantity estimate and their underlying basis used in
forecasting the expenditure are reasonable.
GHD ADVISORY
12
GHD Report for TransGrid – Bushfire Cost Pass Though
Application – Independent Verification and AssessmentAspects Observations
Risk As indicated above the transmission line repair expenditure forecast is based upon the
best estimate of the extent of the damage, site accessibility for construction purpose and
the ground condition for building set-up pads. The expenditure forecast is also based on
TransGrid’s engineering assessment of work and outage duration and project team set-up.
We note that it is not until progress and access is made for contractor site establishment
and construction set-up, the expenditure variables become more definitive as unknown
variables (such as plant access or geotech condition) are quantified. The other unknown
expenditure variables (such as weather conditions, NSW park access, environmental
issues) continues to become definitive as the project runs it course.
Presently, TransGrid has included mark-ups ranging from 16% to 23% to each of its repair
project cost estimate sub-total or direct cost to allow for the following risk variables:
• Weather delay
• Track condition uncertainty
• High content of hard rock
• External delays and restriction due to NSW Parks (Snowy Mountains),
Environment, Aboriginal Heritage site and Endangered species affairs
• Materials/equipment price and demand-supply fluctuation
• Pandemic restriction
These risk variables are unknown at this stage, and as explained above they will start to
become more definitive and be able to be quantified as the project progresses on site.
Based on our experience of brownfield transmission line restringing work with multiple work
fronts, on mountainous terrains, and on environmentally sensitive national park land, we
believe this level of risk allowance is reasonable in TransGrid’s expenditure forecast.
GHD also reviewed the cost and risk components using our own comparative estimates for
the general scope of work. It is usual for brownfield projects to have risk (or contingency
costs allocations) up to 25% or higher commensurate with the current scope definition. Our
comparative estimates indicated a higher cost, hence this indicates the direct costs and
risk allocation cost is reasonable.
Prudency We reviewed the scope of proposed work and the Asset Manager work order priority in
proposing the repair work with assigned level of varying urgency (and therefore the
proposed timelines) to appreciate the amount of work and risk based repair decision
included in the expenditure forecast. We examined the scope for over-engineered solution,
duplication of work with BAU maintenance practice, and opportunity to deliver these repair
works in an efficient manner with weighing against the residual risks.
We are satisfied that the proposed repair works are prudent.
GHD ADVISORY
13
GHD Report for TransGrid – Bushfire Cost Pass Though
Application – Independent Verification and Assessment4.5 Easements - vegetation management
As detailed in TransGrid’s Application, approximately 9% of network route length and 830 kilometres of
access track, have been impacted by the 2019/20 bushfires across NSW.
To address further bushfire exposures and network integrity, TransGrid:
• Has engaged suitably qualified Arborists from various vegetation management contractors (Active,
ETS and Asplundh) to perform Visual Tree Assessment (VTA). The Application indicates that by
September 2020, 80% impacted spans had been inspected and scoped with approximately trees
identified as requiring remediation. Further on-site inspections identified that on average 14% of
hazard tree are ‘unacceptable’, and require management to limit the risk to the electricity network on
top of the 7.5% managed through the hazard trees maintenance program.
• Incurred expenditure to create the required safe access for crews.
The Expenditure Forecasting Methodology for 2019-20 Bushfires details that forecast costs for easement
remediation works are based on current vegetation contractor rates for management of hazard trees and
access tracks. All works are undertaken by contractors. Each of the components of the costs for easements
were sourced as follows:
• Access track costs were based on $X,XXX per km using our current standard panel contractor rate.
• Hazard tree costs were based on $X,XXX per tree removed also using our current standard panel
contractor rate.
GHD has validated both access tracks and hazard tree costs are based on based on contractor estimates.
To verify the incurred costs related to easements and vegetation, GHD made a selection from the
easements data set representing the actual costs. Our selection testing of 4 items (transmission lines)
covering 10% of whole data found out that all actual costs relates to easements. The easement cost is
dependent on the following factors
• A = Quantity of hazard trees impacted by bushfires
• B = Percentage of unacceptable trees x A
• C = Calculated distance using spatial system
• D = Cost of addressing hazard trees ($X,XXX/tree) x B
• E = Cost of addressing access tracks ($X,XXX//access track) x C
The easement cost were calculated as:
Direct costs = (B x D) + (C x E)
Easement cost = Direct costs + Risk costs
Using the formula above, GHD has confirmed that the easement costs add up to total expected cost as
shown in
Table 12.
GHD ADVISORY
14
GHD Report for TransGrid – Bushfire Cost Pass Though
Application – Independent Verification and AssessmentTable 11 Forecasted vegetation management remediation costs for the 2019-20 bushfires (Real $2017-
18)
Expenditure category Reference Total
($ million)
Actual expenditure Table 8 1.0
Forecasted Table 11 4.8
Total (Real $2017-18) 5.8
Table 12 Bushfire damage summary – Hazard Trees (Real $2020-21)
Line Span Quantity of Quantity of Vegetation Access track
Hazard Trees Hazard Cost Cost
Impacted Trees to
Remove
Easement $X,XXX,XX $XXX,XXX
X
5A1/5A2 Central region of TL5A1/5A1 up 10 1 $X,XXX $XXX
to str. 152
31/32 393-472 299 42 $XX,XXX $XX,XXX
76/77 Northern region of 76/77 up to 1173 164 $XXX,XXX $XXX,XXX
str. 226
5A3/5A4 Central region of TL5A3/5A4 up 26 4 $X,XXX $X,XXX
to str. 228
5A3/5A5 426-443 57 8 $XX,XXX $X,XXX
5A6/5A7 Mt. Piper to Bannaby Str 279 to 26 4 $X,XXX $X
str 295
76/77 Central region of 76/77 from str. 45 6 $X,XXX $X,XXX
105
5A1/5A2 Northern region of TL5A1/5A1 79 11 $XX,XXX $XX,XXX
from str. 92
5A3/5A4 Northern region of TL5A3/5A4 8 1 $X,XXX $X,XXX
from str. 170
22 16-19 & 113-137 29 4 $X,XXX $X,XXX
25/26 103-168A/168B 0 0 $X $X
31/32 103-267 319 45 $XX,XXX $XX,XXX
87 Armidale to Coffs Harbour 394 55 $XX,XXX $X,XXX
96C Armidale to Coffs Harbour 274 38 $XX,XXX $X,XXX
GHD ADVISORY
15
GHD Report for TransGrid – Bushfire Cost Pass Though
Application – Independent Verification and AssessmentLine Span Quantity of Quantity of Vegetation Access track
Hazard Trees Hazard Cost Cost
Impacted Trees to
Remove
96L Tenterfield to Lismore 990 139 $XXX,XXX $XX,XXX
89 550-603 703 98 $XXX,XXX $XX,XXX
963 Tomago to Taree 428-473 720 101 $XXX,XXX $X
964 PMQ-232 34 5 $X,XXX $X,XXX
965 186-353 991 139 $XXX,XXX $X,XXX
966 Armidale to Koolkhan 2600 364 $XXX,XXX $X
967 103-193 320 45 $XX,XXX $XX,XXX
51 LTSS-125 239 33 $XX,XXX $XX,XXX
2 UTSS-159 477 67 $XXX,XXX $XX,XXX
3 LTSS-60 171 24 $XX,XXX $X,XXX
7 LTSS-40 0 0 $X $X
U1 UTSS-T1 125 18 $XX,XXX $X
U3 UTSS-T1 18 3 $X,XXX $X
U5 UTSS-T1 192 27 $XX,XXX $X
U7 UTSS-T2 1465 205 $XXX,XXX $X,X
3W Capital WF (Str 278) to KVSS 340 48 $XX,XXX $X
39 Bannaby to Sydney West 514 72 $XXX,XXX $X
L1 Entire Line 0 0 $X $X
L3 Entire Line 0 0 $X $X
L5 LTSS-Tumut5 0 0 $X $X
YY Entire Line 11 2 $X,XXX $X
97D Str 251 to 296 152 21 $XX,XXX $X
978 Str 248 to 342 22 3 $X,XXX $X
64 Entire Line 1283 180 $XXX,XXX $XX,XXX
65 Entire Line 1286 180 $XXX,XXX $XX,XXX
66 Entire Line 2017 282 $XXX,XXX $XXX,XXX
993 49-92 112 16 $XX,XXX $X,XXX
1 UTSS-96 196 27 $XX,XXX $XX,XXX
Direct Cost $4,627,267
GHD ADVISORY
16
GHD Report for TransGrid – Bushfire Cost Pass Though
Application – Independent Verification and AssessmentLine Span Quantity of Quantity of Vegetation Access track
Hazard Trees Hazard Cost Cost
Impacted Trees to
Remove
Risk Cost $379,296
Total Expected Cost (Real $2020-21) $5,006,563
Total Expected Cost (Real $2017-18) 4.8 million
4.6 Contingent project or an associated trigger event
Nothing has come to GHD’s attention that would suggest that the expenditure contained in TransGrid’s
Application relates to contingent projects or an associated trigger event.
GHD ADVISORY
17
GHD Report for TransGrid – Bushfire Cost Pass Though
Application – Independent Verification and AssessmentAppendices 18 GHD ADVISORY GHD Report for TransGrid – Bushfire Cost Pass Though Application – Independent Verification and Assessment
Appendix A - Severity analysis of 2019/20
bushfire season
In this section of the report GHD has undertaken:
         •   Detailed analysis of the drought / rainfall and fire weather severity conditions in NSW which
             led to the severity / unprecedented conditions during the bushfire season.
         •   Analysis of the scale of fire occurrence, size and impact in NSW which greatly contributed to
             those fires becoming uncontrollable and resulting in the large and abnormal scale of network
             impact and damage.

A.1 Drought influence bushfire activity and severity
It is well established through scientific research and operational experience that drought is a most
significant causal factor contributing to fire season severity, particularly in forested landscape areas.

GHD considers that the leading factor contributing to the frequency, intensity, timing and location of
bushfires in NSW in the 2019-20 bushfire season was the severe drought affecting a very high
proportion of NSW.

Drought increases the amount of fuel available to burn during a bushfire, increases the frequency of
ignitions through making the landscape more conduce to ignition and spread, and lengthens the
period of time when bushfires can start and spread.

Drought serves to increase the amount of forest fuel available to burn. Drought does this by:
•        Increasing the quantity of fuel on the forest floor by causing severe moisture stress in trees and
         understorey shrubs causing increased leaf fall as plants shed leaves to conserve moisture

•        Increasing the propensity for live shrub layers to burn due to reducing live fuel moisture content
         and increasing the proportion of dead fuel retained in understorey shrub canopies
•        Increasing the proportion of forest fuels available to burn

•        The increased fuel contributes to increasing fire intensity, rate of spread, and spotting.
Drought affects the timing of bushfires by creating conditions conducive to bushfire ignition and spread
earlier in the year than occurs in more average or above average rainfall years. Historically (not just
during 2019-20), in severe drought-affected years, adverse bushfires can occur along the north and
mid north coast and ranges as early as August with peak fire conditions occurring in September and
October and extending until the arrival of late-onset summer rainfall. This was the case during the
2019-20 fire season, and it has also been the case during many previous severe drought-affected fire
seasons.

A.2 Drought severity in 2019
The extent and severity of drought conditions affecting NSW leading up to and during the 2019-20
bushfire season is unprecedented. Using Bureau of Meteorology (BoM) rainfall data, GHD has
analysed rainfall data to determine the severity of rainfall deficits during 2019.
When considered at the full calendar year timescale, rainfall deficiencies across NSW were severe. A
most substantial proportion of coastal and inland areas north of the Hunter Valley into southern
Queensland and from the coast to the north and central west slopes and plains experienced their
driest year on record.

    19

     GHD ADVISORY
     GHD Report for TransGrid – Bushfire Cost Pass Though
     Application – Independent Verification and Assessment
From the Sydney basin/Central Tablelands south into northern Victoria, conditions were in the first (lowest) decile. Figure 1 shows rainfall deciles across NSW for the calendar year for 2019. Figure 1 Annual rainfall deciles map 2019 20 GHD ADVISORY GHD Report for TransGrid – Bushfire Cost Pass Though Application – Independent Verification and Assessment
Drought effects can be even more acute when they extend over longer periods. Drought conditions in
NSW effectively commenced in early 2017. Figure 2 shows rainfall deciles across NSW for the two
year period spanning 2018 and 2019.

Figure 2 Rainfall deciles map 1 Jan 2018 to 31 Dec 2019
Considered in the broader Australian context of rainfall deciles spanning 3 consecutive “southern wet
seasons’ (APR-OCT) the period leading into the 2019/20 NSW fire season was exceptionally dry, with
most of the state recording lowest on record rainfall (Figure 3).

Figure 3 Australian rainfall deciles 1 Apr 2017 to 30 Sep 2019
 21

  GHD ADVISORY
  GHD Report for TransGrid – Bushfire Cost Pass Though
  Application – Independent Verification and Assessment
A.3 2018/2019 two year rainfall deficit comparison with previous severe fire seasons

        2018 - 2019                                             2001 - 2002                                  1993 - 1994

        1981 - 1982                                             1967 - 1968

Figure 4 Two year rainfall decile map comparison for NSW severe fire seasons
Figure 4 shows two year rainfall decile map comparisons for historically severe/crisis fire seasons affecting NSW.

        GHD ADVISORY
        GHD Report for TransGrid – Bushfire Cost Pass Though
        Application – Independent Verification and Assessment
 22
The two year rainfall decile maps (Figure 4) show that the extent and severity of drought leading into the 2019/20 fire season was greater in extent and severity than
conditions leading into any of the historically severe fire seasons in NSW.
At the annual rainfall scale, annual rainfall for 2019 can be ranked against all other previous years. In Table 13, selected weather stations with long-term rainfall
records in or near fire-impacted areas are examined.
Table 13 Rainfall rank against all years for long-term weather stations near fire-impacted areas
Weather Station Number Number of Mean annual Lowest on 2017 annual 2018 annual 2019 annual 1 Apr to 31
years record rainfall (mm) record rain (rank) (rank) (rank) Dec rainfall
(mm) (rank)
Eden (Timbillica) 069029 60 961.5 513.4 9 6 8 2
Bega (Newtown Rd) 069002 135 857.7 398.9 48 31 13 1
Bombala (Therry St) 070005 135 645.3 304.7 61 27 3 1
Batemans Bay (Buckenbowra) 069052 60 996.6 428 19 11 3 1
Braidwood (Krawaree) 070057 132 715.7 340 13 31 6 1
Tumut (Simpson St) 072044 60 813.6 33.9 17 4 5 5
Bathurst (Ag Stn) 063005 60 636.8 214.2 10 13 5 2
Branxton 061014 157 811.6 378.7 38 79 5 1
Bulahdelah 060002 114 1325.7 563.3 31 34 2 1
Wingham 060036 131 1092.7 378.8 78 45 1 1
Walcha (Kaori) 057119 75 913.5 474.5 40 23 1 1
Telegraph Point (Farrawells Rd) 060031 110 1304.4 411.6 64 50 1 1
Nana Glen (Cowling Close) 059139 62 1358.3 663.2 42 35 1 6
Tenterfield 056032 149 844.4 254.6 67 9 1 1
Tabulam PO 057018 131 975.7 425 68 32 1 1
Woodenbong 057024 86 997.1 335 60 12 1 1
GHD ADVISORY
GHD Report for TransGrid – Bushfire Cost Pass Though
Application – Independent Verification and Assessment
23The fire season in NSW generally starts in spring in north coastal/tableland districts, and progressively
moves south, with the south coast and southern ranges/slopes generally the last to see significant fire
potential commencement from around December (or earlier in drought years). Accordingly, rainfall
over the last 9 months of the year (1 April to 31 December) has the most significant influence on the
severity of conditions leading into each bushfire season. Rainfall in the January to March period has
relatively less influence (relative to winter and spring rainfall) on fuel drying over the following spring
and summer. Hence it can be instructive to look at rainfall deficiencies over the 1 April to 31 December
period to consider fire season severity potential.
From the rainfall analyses presented in Table 13, the following conclusions can be drawn:
• With two exceptions (Eden and Tumut) annual rainfall deficits in 2019 were considerably worse
than in both 2018 and 2017 which were also drought-affected years
• In the mid north coast and ranges areas of Wingham, Walcha and Telegraph Point, 2019 annual
rainfall was the lowest on record (noting Wingham records go back 131 years)
• In the north coast/northern rivers/ranges areas of Nana Glen (inland from Coffs Harbour);
Tabulam (near Casino), Tenterfield and Woodenbong (near the QLD border) annual rainfall was
the lowest on record (noting Tenterfield records go back 149 years)
• When measured over the 1 April to 31 December period (the period most greatly affecting fire
season conditions) 12 out of 16 long-term stations analysed recorded the lowest rainfall on record
for that period. A further 2 had their second driest period on record
• Those stations registering lowest on record rainfall in 2019 recorded, at worst, less than a third of
their mean annual rainfall, and at best just over half.
A.4 The effect of drought on soil and fuel moisture
The effect of drought on fuels is to dry them out so that they are available to burn. In severe droughts,
even large logs on the forest floor can dry out sufficiently to burn away completely once ignited. Soil
moisture is also depleted which causes vegetation stress.
The progression of the fuel and soil drying effects of the drought leading into the 2019/20 bush fire
season can be gleaned from modelled soil moisture maps produced by the BoM.
Root zone soil moisture maps covering NSW sourced from the BoM’s Australian Water Resources
Assessment Landscape (AWRA-L) modelling for September and December 2019 are copied at
Figures 5 and 6.
The modelling takes account of rainfall, evapotranspiration, runoff and deep drainage. It is evident that
soil dryness in the fire-affected areas north of the Hunter was already at very much below average to
lowest percentile (worst 1%) levels in September (as it was also in August), and except for some
largely coastal rainfall in the lower Hunter and Sydney basin, conditions remained that way in those
areas through to December.
Along the South Coast and ranges soil moisture was already very much below average in September,
and progressively worsened to widespread lowest percentile conditions by December. Alpine areas
and the south west slopes progressively worsened from below average/very much below average to
very much below average/lowest percentile conditions by December when large fires broke out in that
area.
24
GHD ADVISORY
GHD Report for TransGrid – Bushfire Cost Pass Though
Application – Independent Verification and AssessmentYou can also read