BY AMAR BHARDWAJ, DR. COLIN MCCORMICK, AND DR. JULIO FRIEDMANN MAY 2021
←
→
Page content transcription
If your browser does not render page correctly, please read the page content below
OPPORTUNITIES AND LIMITS
OF CO2 RECYCLING IN A
CIRCULAR CARBON ECONOMY:
TECHNO-ECONOMICS, CRITICAL
INFRASTRUCTURE NEEDS, AND
POLICY PRIORITIES
  BY AMAR BHARDWAJ, DR. COLIN MCCORMICK,
  AND DR. JULIO FRIEDMANN
  MAY 2021
ABOUT THE CENTER ON GLOBAL ENERGY POLICY
The Center on Global Energy Policy at Columbia University SIPA advances smart, actionable
and evidence-based energy and climate solutions through research, education and dialogue.
Based at one of the world’s top research universities, what sets CGEP apart is our ability to
communicate academic research, scholarship and insights in formats and on timescales that
are useful to decision makers. We bridge the gap between academic research and policy —
complementing and strengthening the world-class research already underway at Columbia
University, while providing support, expertise, and policy recommendations to foster stronger,
evidence-based policy. Recently, Columbia University President Lee Bollinger announced
the creation of a new Climate School — the first in the nation — to tackle the most urgent
environmental and public health challenges facing humanity.

Visit us at www.energypolicy.columbia.edu

            @ColumbiaUEnergy

ABOUT THE CARBON MANAGEMENT RESEARCH INITIATIVE
The Carbon Management Research Initiative (CaMRI) at the Center on Global Energy Policy
provides independent insight and data-driven analysis for private and public sector leaders
navigating this new and complex landscape, leveraging the multidisciplinary scholars and
the extensive technical expertise at Columbia University, including in law, business, science,
engineering, finance, public policy and social science.

CaMRI is grateful for the time and perspectives of the Circular Carbon Economy project
advisory committee, which includes individuals from across government, academia, civil
society and industry with deep expertise across technology, policy, economics and finance
relevant to enabling solutions to climate change. Current participants include:

   ●   Mr. Brad Page, CEO, Global Carbon Capture & Storage Institute (Co-Chair)
   ●   Mr. Ahmad Al-Khowaiter, CTO, Saudi Aramco (Co-Chair)
   ●   Dr. Stephen Bohlen, Acting State Geologist, California Department of Conservation
   ●   Ms. Heidi Heitkamp, Former Senator from North Dakota, U.S. Senate, United States
       of America
   ●   Mr. Richard Kaufmann, Chairman, New York State Energy Research and Development
       Authority (NYSERDA)
   ●   Ms. Maria Jelescu Dreyfus, CEO, Ardinall Investment Management
   ●   Dr. Arun Majumdar, Director, Precourt Institute for Energy at Stanford University
   ●   Dr. Nebojsa Nakicenovic, Former Deputy Director General/CEO, International Institute
       for Applied Systems Analysis (IIASA)
   ●   Mr. Adam Siemenski, President, King Abdullah Petroleum Studies and Research
       Center (KAPSARC)
   ●   Prof. Nobuo Tanaka, Former Executive Director, International Energy Agency (IEA)
       and Distinguished Fellow, Institute of Energy Economics Japan
ABOUT THE SCHOOL OF INTERNATIONAL AND PUBLIC AFFAIRS
SIPA’s mission is to empower people to serve the global public interest. Our goal is to foster
economic growth, sustainable development, social progress, and democratic governance
by educating public policy professionals, producing policy-related research, and conveying
the results to the world. Based in New York City, with a student body that is 50 percent
international and educational partners in cities around the world, SIPA is the most global of
public policy schools.

For more information, please visit www.sipa.columbia.edu
OPPORTUNITIES AND LIMITS
OF CO2 RECYCLING IN A
CIRCULAR CARBON ECONOMY:
TECHNO-ECONOMICS, CRITICAL
INFRASTRUCTURE NEEDS, AND
POLICY PRIORITIES
BY AMAR BHARDWAJ, DR. COLIN MCCORMICK,
AND DR. JULIO FRIEDMANN
MAY 2021

Columbia University CGEP
1255 Amsterdam Ave.
New York, NY 10027
energypolicy.columbia.edu

          @ColumbiaUEnergy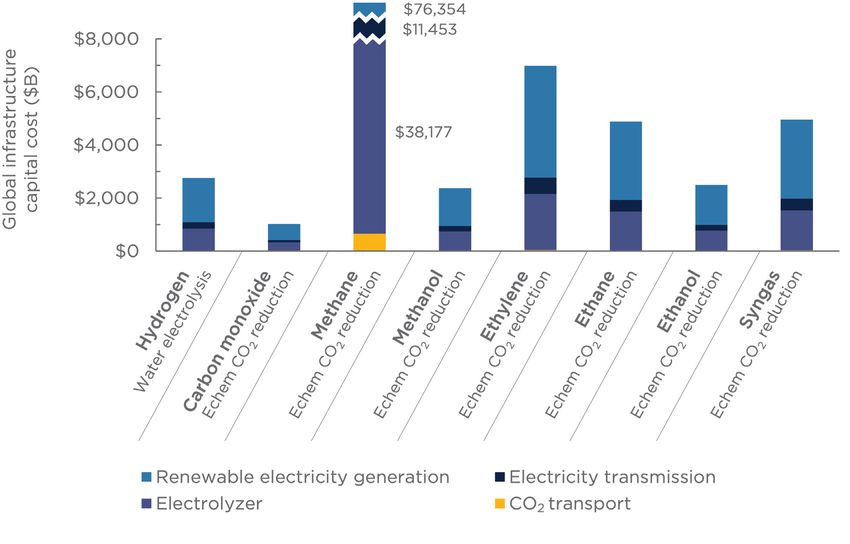
OPPORTUNITIES AND LIMITS OF CO2 RECYCLING IN A CIRCULAR CARBON ECONOMY:
TECHNO-ECONOMICS, CRITICAL INFRASTRUCTURE NEEDS, AND POLICY PRIORITIES

ABOUT THE AUTHORS
Amar Bhardwaj is a current Marshall Scholar and a former research assistant at the Center on
Global Energy Policy at Columbia University. He is focused on policy and economic analysis
as well as technology development within renewable energy, clean fuels, and CO2 utilization.
Bhardwaj is also an incoming energy industry analyst in the Office of Energy Policy and
Innovation at the Federal Energy Regulatory Commission. Previously, he was a lead researcher
in Columbia’s Solar Fuels Engineering Lab, the editor in chief of Consilience: The Journal of
Sustainable Development, and an expert reviewer for the Intergovernmental Panel on Climate
Change’s 6th Assessment Report. Bhardwaj has authored numerous publications in energy
policy and technology and has presented his work globally, including at the United Nations.
He holds a BS in chemical engineering, summa cum laude, from Columbia University, and will
shortly begin a PhD in chemical engineering at Stanford University.

Dr. Colin McCormick is an expert on low-carbon and negative-emissions technologies,
including pathways for carbon dioxide removal and research needs for clean energy systems.
He is currently the chief innovation officer for Carbon Direct, and previously served as the
senior advisor for R&D at the US Department of Energy. He holds a PhD in physics from UC
Berkeley and is an adjunct associate professor at the Georgetown University Walsh School of
Foreign Service.

Dr. Julio Friedmann is a senior research scholar at the Center on Global Energy Policy at
Columbia University. He is one of the most widely known and authoritative experts in the US
on carbon removal (CO2 drawdown from the air and oceans), CO2 conversion and use (carbon-
to-value), and carbon capture and sequestration. Dr. Friedmann recently served as principal
deputy assistant secretary for the Office of Fossil Energy at the Department of Energy, where
he was responsible for DOE’s R&D program in advanced fossil energy systems, carbon capture
and storage (CCS), CO2 utilization, and clean coal deployment. He has also held positions at
Lawrence Livermore National Laboratory, including senior advisor for energy innovation and
chief energy technologist. He is also the CEO of Carbon Wrangler, LLC, is a distinguished
associate at the Energy Futures Initiative, and serves as a special advisor to the Global CCS
Institute. Dr. Friedmann received his bachelor of science and master of science degrees from
the Massachusetts Institute of Technology, followed by a PhD in geology at the University of
Southern California.

4 | CENTER ON GLOBAL ENERGY POLICY | COLUMBIA SIPA
OPPORTUNITIES AND LIMITS OF CO2 RECYCLING IN A CIRCULAR CARBON ECONOMY:
                                              TECHNO-ECONOMICS, CRITICAL INFRASTRUCTURE NEEDS, AND POLICY PRIORITIES

ACKNOWLEDGMENTS
This report benefitted from a multi-round peer review process involving two anonymous
external expert reviewers and three anonymous Columbia University reviewers. The authors
deeply thank these reviewers for their thoughtful and detailed comments, which contributed
materially to the work. The authors are also grateful to their fellow colleagues in the Carbon
Management Research Initiative at the Center on Global Energy Policy, who provided helpful
feedback, resources, and support throughout the development of the report. Last but not
least, the authors thank all their colleagues at the Center on Global Energy Policy for helping
with the design, publication, launch, and promotion of the work.

This report represents the research and views of the authors. It does not necessarily represent
the views of the Center on Global Energy Policy. The paper may be subject to further revision.

This report is part of The Circular Carbon Economy: Keystone to Global Sustainability series,
which assesses the opportunities and limits associated with the transition toward more resilient,
sustainable energy systems that address climate change, increase access to energy, and spark
innovation for a thriving global economy.

This work was made possible by support from the Center on Global Energy Policy and grant
funding from the Global Carbon Capture & Storage Institute. More information is available at
https://energypolicy.columbia.edu/about/partners.

                                                                           ENERGYPOLICY.COLUMBIA.EDU | MAY 2021 | 5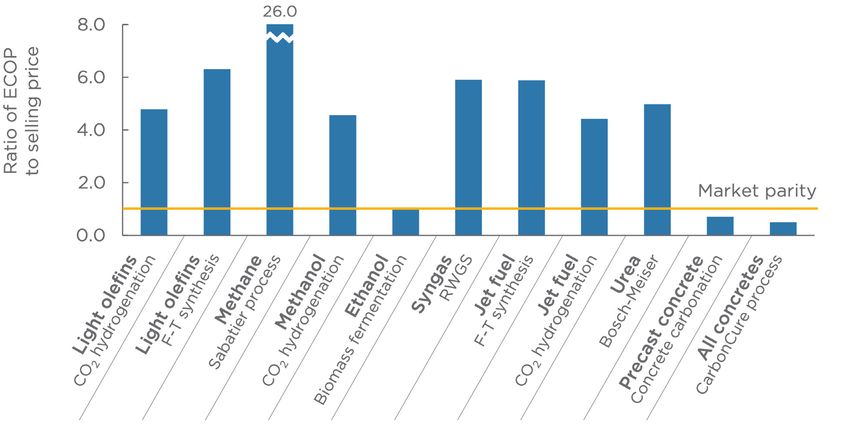
OPPORTUNITIES AND LIMITS OF CO2 RECYCLING IN A CIRCULAR CARBON ECONOMY:
TECHNO-ECONOMICS, CRITICAL INFRASTRUCTURE NEEDS, AND POLICY PRIORITIES

TABLE OF CONTENTS
Executive Summary                                                               07
Introduction                                                                    09
          Selected CO2 Recycling Pathways                                       10
Methodology                                                                     12
          Estimated Cost of Production (ECOP) and Sensitivity Analysis          12
          Carbon Abatement Metrics and Effect of Subsidies                      12
          Global Critical Infrastructure Needs and Resource Consumption         13
          Inputs and Assumptions                                                14
Results                                                                         17
          Estimated Cost of Production                                          17
          Cost Sensitivity Analysis                                             21
          Carbon Abatement Potential                                            24
          Marginal Abatement Cost and Revenue                                   27
          Effective Carbon Price and Gross Subsidies                            29
          Critical Infrastructure Needs                                         31
          Global Electricity and Hydrogen Consumption                           35
Discussion                                                                      38
          Reducing the Estimated Cost of Production of CO2 Recycling Pathways   38
          Carbon Abatement                                                      41
          Critical Infrastructure Needs                                         41
          Market Size                                                           42
Policy Recommendations                                                          44
          Prioritizing Pathways                                                 44
          Policies for Cost Reductions and Market Deployment                    45
          Critical Infrastructure Build-out                                     46
Conclusion                                                                      47
Appendix                                                                        48
          Appendix Tables                                                       48
          Overview of Selected CO2 Recycling Pathways                           53
          Detailed Methodology                                                  55
Notes                                                                           65

6 | CENTER ON GLOBAL ENERGY POLICY | COLUMBIA SIPA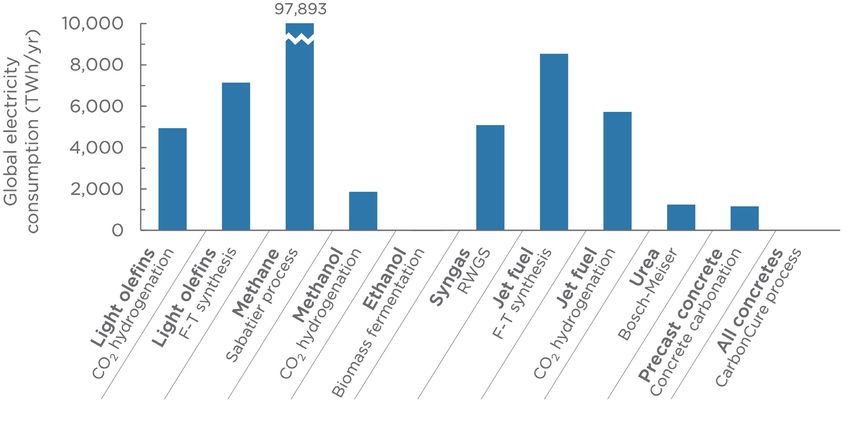
OPPORTUNITIES AND LIMITS OF CO2 RECYCLING IN A CIRCULAR CARBON ECONOMY:
                                               TECHNO-ECONOMICS, CRITICAL INFRASTRUCTURE NEEDS, AND POLICY PRIORITIES

EXECUTIVE SUMMARY
Despite growing efforts to drastically cut carbon dioxide (CO2) emissions and address climate
change, energy outlooks project that the world will continue to rely on certain products that
are currently carbon-intensive to produce but have limited alternatives, such as aviation fuels
and concrete. Recycling CO2 into valuable chemicals, fuels, and materials has emerged as an
opportunity to reduce the emissions of these products. In this way, CO2 recycling is a potential
cornerstone of a circular carbon economy that can support a net-zero future. However, CO2
recycling processes have largely remained costly and difficult to deploy, underscoring the
need for supportive policies informed by analysis of the current state and future challenges of
CO2 recycling.

This report, part of the Carbon Management Research Initiative at Columbia University’s
Center on Global Policy, examines 19 CO2 recycling pathways to understand the opportunities
and the technical and economic limits of CO2 recycling products gaining market entry and
reaching global scale. The pathways studied consume renewable (low-carbon) electricity
and use chemical feedstocks derived from electrochemical pathways powered by renewable
energy. Across these CO2 recycling pathways, the authors evaluated current globally
representative production costs, sensitivities to cost drivers, carbon abatement potential,
critical infrastructure and feedstock needs, and the effect of subsidies. Based on this analysis,
the paper concludes with targeted policy recommendations to support CO2 recycling
innovation and deployment.

Key findings of the analysis include the following:

   ●   CO2 recycling pathways could deliver deep emissions reductions. When supplied
       by low-carbon electricity and chemical feedstocks, CO2 recycling pathways have
       the combined potential to abate 6.8 gigatonnes of CO2 per year (GtCO2/yr) when
       displacing conventional production methods.

   ●   Some CO2 recycling pathways have reached market parity today, while the costs of
       remaining pathways are high. Electrochemical carbon monoxide (CO) production,
       ethanol from lignocellulosic biomass, concrete carbonation curing, and the CarbonCure
       concrete process all have an estimated cost of production (ECOP) lower than the
       product selling price. These pathways have a combined carbon abatement potential
       of 1.6 GtCO2/yr. Most remaining pathways have an ECOP of 2.5 to 7.5 times greater
       than the product selling price. In particular locations and contexts, ECOP may be
       substantially lower, but these costs are representative of CO2 recycling at global scale.

   ●   Catalyst performance and input prices are the main cost drivers. The largest
       component of ECOP is electricity and chemical feedstock costs, and the main cost
       drivers are those who influence these two cost components. For electrochemical
       pathways, ECOP is most sensitive to catalyst product selectivity (the ability of the
       catalyst to avoid unwanted side reactions), catalyst energy efficiency, and electricity

                                                                            ENERGYPOLICY.COLUMBIA.EDU | MAY 2021 | 7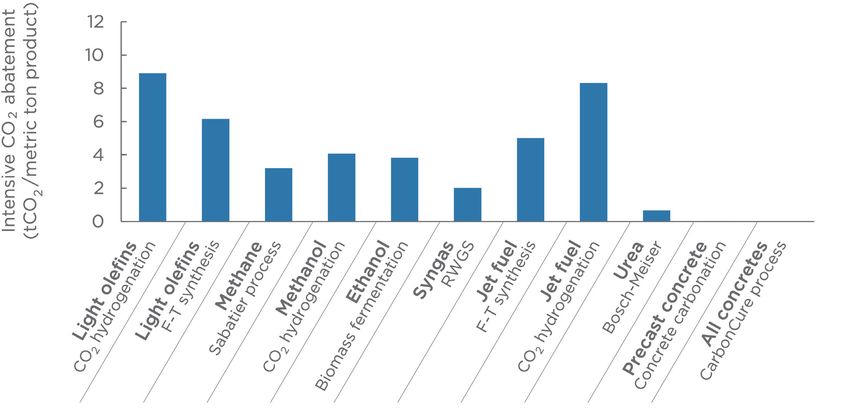
OPPORTUNITIES AND LIMITS OF CO2 RECYCLING IN A CIRCULAR CARBON ECONOMY:
TECHNO-ECONOMICS, CRITICAL INFRASTRUCTURE NEEDS, AND POLICY PRIORITIES

          price. For thermochemical pathways, the largest cost drivers are product selectivity,
          chemical feedstock price, and the price of the electricity used to make the feedstocks.

     ●    CO2 recycling at the scale of current global markets would require enormous new
          capacity of critical infrastructure. Each pathway at global scale would consume
          thousands of terawatt hours of electricity, 30–100 million metric tons (Mt) of
          hydrogen, and up to 2,000 Mt of CO2 annually. This would require trillions of dollars of
          infrastructure per pathway to generate and deliver these inputs, including a combined
          8,400 gigawatts (GW) of renewable energy capacity and 8,000 GW of electrolyzer
          capacity across all pathways.

Based on these findings, the authors recommend the following set of policy actions:

     ●    Ensure CO2 recycling pathways are fed by low-carbon inputs. Without low-carbon
          electricity and feedstocks, CO2 recycling could potentially be more carbon-intensive
          than conventional production.

     ●    Prioritize certain pathways strategically. CO2 recycling methane and ethane
          production are extremely uneconomic and should be deprioritized. All other pathways
          are more economically promising and could be the focus of a targeted innovation
          agenda to reduce costs. In addition, the following pathways that have an ECOP
          less than 5 times the selling price could be prioritized for early market growth:
          electrochemical CO production, green hydrogen, ethanol from lignocellulosic biomass,
          concrete carbonation curing pathways, CO2 recycling urea production, and CO2
          hydrogenation to light olefins, methanol, or jet fuel.

     ●    Target research, development, and demonstration (RD&D) to catalyst innovation to
          bring down ECOP and reduce input demand. Policy makers can promote RD&D to
          improve the selectivity and energy efficiency of CO2 recycling catalysts. By decreasing
          a pathway’s consumption of electricity and feedstocks, these innovations would both
          decrease ECOP and alleviate the sizable critical infrastructure needs.

     ●    Create demand pull for early market CO2 recycling products. Governments can use
          demand pull policies such as public procurement standards to bolster early markets
          for the most mature CO2 recycling pathways.

     ●    Promote build-out of critical infrastructure. To provide for the substantial
          infrastructure needs of CO2 recycling, policy makers can seek to remove barriers
          to and catalyze investment in building renewables installations, transmission lines,
          electrolyzers, and CO2 transport pipelines.

8 | CENTER ON GLOBAL ENERGY POLICY | COLUMBIA SIPA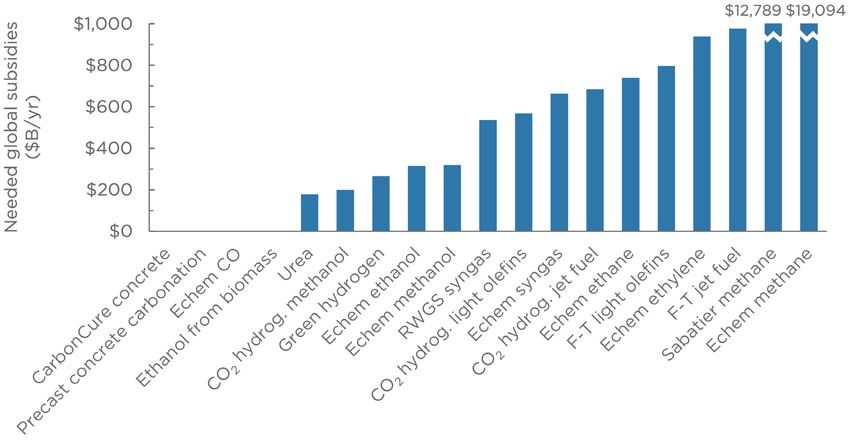
OPPORTUNITIES AND LIMITS OF CO2 RECYCLING IN A CIRCULAR CARBON ECONOMY:
                                              TECHNO-ECONOMICS, CRITICAL INFRASTRUCTURE NEEDS, AND POLICY PRIORITIES

INTRODUCTION
To mitigate the severe consequences of the climate crisis, the world must reach net-zero
greenhouse gas emissions by midcentury and net-negative emissions shortly thereafter.1
Current decarbonization efforts have focused on efficiency improvements (e.g., US CAFE
standards and appliance standards), increased build-out of renewable electricity (e.g.,
Germany’s Energiewende), and electrification of heating and automobiles. Many studies
indicate that despite recent progress, existing policies will leave substantial residual
emissions in some sectors, such as heavy-duty transportation or heavy industry, that are
either expensive or infeasible to completely decarbonize.2 Moreover, many products in our
day-to-day lives, be they chemicals, fuels, or materials, contain substantial carbon volumes
themselves that will eventually oxidize and form CO2 in the atmosphere.

One way to abate emissions from these sectors involves CO2 recycling, wherein CO2 is
converted into valuable chemicals, fuels, and materials and used in commercial products.3 The
CO2 used can be sourced from point-source emitters such as fossil power plants or be drawn
directly out of the atmosphere or oceans. This can be considered a component of a circular
carbon economy that includes CO2 reduction, reuse, recycling, and removal.4 By consuming
CO2 as a feedstock, these pathways could replace difficult-to-decarbonize products and
processes with low-carbon, carbon neutral, or net carbon-negative alternatives. Since CO2
recycling products can help reduce sources of residual emissions, as in the potential case of
producing net neutral fuels for the transportation sector, these pathways will be crucial to
achieving net-zero emissions.

CO2 recycling pathways include many processes and products with different costs, viability,
and carbon footprints. To contribute meaningfully toward deep decarbonization, CO2
recycling pathways must be deployed on the gigatonne scale and must operate with
extremely low-carbon energy and material inputs.5 Investment and commercialization of CO2
recycling requires a measured approach informed by chemistry, engineering, and economics.
A misunderstanding of the merits and limitations of each pathway risks poor use of capital,
lost time, and ineffective carbon abatement measures, limiting the abatement achieved
through CO2 recycling pathways. Coordinating an effort of this scale and complexity will
require a comprehensive quantitative analysis of the techno-economics of key CO2 recycling
pathways and the critical infrastructure needed to support them. Several previous studies
have investigated the techno-economics of various CO2 utilization pathways,6 but they often
do not address a wide range of pathways and do not integrate techno-economic findings with
infrastructure needs or broader policy implications.

In this study, we investigate the techno-economics, critical infrastructure needs, and effects
of subsidies for 19 of the chemical and industrial CO2 recycling processes with the largest
volume of product demand. These include eight electrochemical pathways and eleven
thermochemical pathways. We evaluate the potential for these CO2 recycling pathways
to replace conventional production methods and supply current global demand for their
products. We model these pathways to consume renewable electricity and use chemical

                                                                           ENERGYPOLICY.COLUMBIA.EDU | MAY 2021 | 9
OPPORTUNITIES AND LIMITS OF CO2 RECYCLING IN A CIRCULAR CARBON ECONOMY: TECHNO-ECONOMICS, CRITICAL INFRASTRUCTURE NEEDS, AND POLICY PRIORITIES feedstocks, such as hydrogen, that are produced electrochemically with renewable electricity. We evaluate several characteristics of each pathway: the current estimated cost of production (ECOP, in $/metric ton product), global carbon abatement potential, marginal cost of carbon abatement, effective carbon price and scale of subsidies needed to make the pathways profitable, and the critical infrastructure necessary to deploy the pathway at global scale. We also use a cost sensitivity analysis across a range of techno-economic inputs to identify specific innovations that can drive cost reductions for the pathways. We make policy and investment recommendations based on these findings to accelerate deployment of CO2 recycling across sectors at reasonable costs and ultimately realize gigatonne-scale CO2 recycling for deep emissions reductions. Selected CO2 Recycling Pathways The CO2 recycling pathways analyzed in this study are listed in Table 1. We investigated 8 electrochemical pathways and 11 thermochemical pathways. Each pathway is defined by the pairing of a chemical process (e.g., CO2 hydrogenation) and its desired product (e.g., methanol). Several of the chemical processes can be adapted to target various products, and in these cases, we evaluate each process-product pairing as a distinct pathway. The electrochemical pathways include water electrolysis to produce hydrogen and electrochemical CO2 reduction, in which CO2 and water react to produce a range of hydrocarbon products. The thermochemical pathways include CO2 hydrogenation, which uses CO2 and H2 feedstocks to produce various hydrocarbons, and Fischer-Tropsch (F-T) synthesis, which uses syngas (CO and H2) to create various hydrocarbons. The ethanol from lignocellulosic biomass pathway breaks down and ferments the sugars in lignocellulosic biomass feedstocks, such as agricultural residues, to produce ethanol. The urea production pathway is modeled as a Bosch-Meiser process that uses green ammonia and externally sourced feedstock CO2. The concrete production pathways are each modifications to one step of conventional concrete production in order to incorporate CO2 into the concrete. We model these as identical to conventional concrete production, save for the modified CO2 recycling step. A detailed description of each pathway is included in the appendix. 10 |CENTER ON GLOBAL ENERGY POLICY | COLUMBIA SIPA
OPPORTUNITIES AND LIMITS OF CO2 RECYCLING IN A CIRCULAR CARBON ECONOMY:
                                              TECHNO-ECONOMICS, CRITICAL INFRASTRUCTURE NEEDS, AND POLICY PRIORITIES

Table 1: Summary of CO2 recycling pathways evaluated

Desired product                      Process                                        Feedstocks
Electrochemical pathways
Hydrogen                             Water electrolysis                             H2O
Carbon monoxide                      Electrochemical (Echem) CO2                    CO2
                                     reduction
Methane                              Electrochemical CO2 reduction                  CO2, H2O
Methanol                             Electrochemical CO2 reduction in               CO2, H2O
                                     ionic liquid aqueous electrolyte
Ethylene                             Electrochemical CO2 reduction                  CO2, H2O
Ethane                               Electrochemical CO2 reduction                  CO2, H2O
Ethanol                              Electrochemical CO2 reduction                  CO2, H2O
Syngas                               Electrochemical CO2 reduction                  CO2, H2O
Thermochemical pathways
Light olefins incl. ethylene         CO2 hydrogenation w green H2                   CO2, H2
Light olefins incl. ethylene         Fischer-Tropsch (F-T) synthesis w              CO, H2
                                     electro-syngas
Methane                              Sabatier process w green H2                    CO2, H2
Methanol                             CO2 hydrogenation w green H2                   CO2, H2
Ethanol                              Lignocellulosic biomass fermentation Lignocellulosic biomass
Syngas                               Reverse water gas shift reaction               CO2, H2
                                     (RWGS) w green H2
Jet fuel                             F-T synthesis w electro-syngas                 CO, H2
Jet fuel                             CO2 hydrogenation w green H2                   CO2, H2
Urea                                 Bosch-Meiser process w green                   CO2, NH3
                                     ammonia and 100% external CO2
Precast concrete                     Concrete carbonation curing                    CO2, concrete
All concretes (precast, ready-mix,   CarbonCure process                             CO2, concrete
masonry concrete)

                                                                          ENERGYPOLICY.COLUMBIA.EDU | MAY 2021 | 11
OPPORTUNITIES AND LIMITS OF CO2 RECYCLING IN A CIRCULAR CARBON ECONOMY: TECHNO-ECONOMICS, CRITICAL INFRASTRUCTURE NEEDS, AND POLICY PRIORITIES METHODOLOGY We designed our analysis in the context of using CO2 recycling pathways to supply current global demand for their products. Our analysis is outlined here and detailed in the appendix. The general categories of analysis for each CO2 recycling pathway were current production costs, sensitivities to cost drivers, carbon abatement potential, critical infrastructure and feedstock needs, and the effect of subsidies. Estimated Cost of Production (ECOP) and Sensitivity Analysis The current estimated cost of production (ECOP, in $/metric ton product) for each pathway was determined by estimating the electricity cost, feedstock cost (hydrogen, CO2, CO, biomass, and/or ammonia), fixed operation and maintenance (O&M) cost, and capital cost per ton of product produced. The key techno-economic inputs used for calculating ECOP were electrical energy efficiency, product selectivity and yield, capacity factor, capital cost, electricity price, and feedstock prices. Product selectivity broadly refers to the percentage of input feedstock and/or energy that goes toward making the desired product as opposed to undesired byproducts. More detailed definitions of the different selectivity metrics we used and how they were calculated can be found in the detailed methodology in the appendix. To determine the ratio of a certain chemical feedstock consumed by a pathway (in tons of feedstock consumed per ton of product), we divided the ideal feedstock consumption ratio by the appropriate selectivity metric. The ideal feedstock consumption ratio is defined by the reaction’s stoichiometry (the ratio of molecules of feedstock to molecules of product in the chemical reaction equation). Dividing by selectivity accounts for the additional feedstock that is consumed to produce reaction byproducts. To calculate CO2 consumption through this method, we used the carbon selectivity of the pathway—the selectivity to the desired product among all carbon-containing products. This allowed us to exclude the hydrogen evolution side reaction in electrochemical CO2 reduction, which does not consume CO2. Similarly, to find the H2 consumption, we used the hydrogen selectivity, which gives the percentage of input hydrogen that goes to the desired product. This excludes CO2 conversion to CO in many thermochemical pathways, which does not consume H2. For a cost sensitivity analysis, the value of each techno-economic input was increased and decreased by 20 percent, with all else remaining fixed, and the resulting percent change in ECOP was noted. In designing the tool for these analyses, we varied input parameters broadly to understand sensitivities; a future analysis will detail the sensitivities to inputs. Carbon Abatement Metrics and Effect of Subsidies The intensive carbon abatement (tCO2 abated/metric ton product) of each pathway was defined as the net decrease in CO2 emissions that would result from displacing a conventional production process with a CO2 recycling pathway that produces the same product. Since a CO2 recycling product and its corresponding conventional product are functionally identical, 12 |CENTER ON GLOBAL ENERGY POLICY | COLUMBIA SIPA
OPPORTUNITIES AND LIMITS OF CO2 RECYCLING IN A CIRCULAR CARBON ECONOMY:
                                              TECHNO-ECONOMICS, CRITICAL INFRASTRUCTURE NEEDS, AND POLICY PRIORITIES

we assume that the emissions associated with the combustion or use of the products (gate
to grave emissions) are equivalent. Under this assumption, the change in emissions from
displacing conventional processes with CO2 recycling arises entirely within the cradle to
gate life cycle scope. Thus, carbon abatement was calculated through a cradle to gate life
cycle assessment incorporating the CO2 consumed in the chemical reaction, the emissions
associated with the generation of renewable electricity consumed in the process, the natural
gas-derived process heat emissions, the emissions associated with carbon capture to produce
CO2 feedstock, byproduct CO2 generation, and the counterfactual cradle to gate emissions
of producing the product using a conventional pathway. We multiplied the intensive carbon
abatement of a pathway by the global demand for its product to obtain the global carbon
abatement potential of the pathway in million metric tons of CO2 per year (MtCO2/yr).

The marginal abatement cost (MAC) was found by dividing ECOP by intensive carbon
abatement for each pathway. The marginal abatement revenue ($ of revenue/metric ton
product) was calculated by instead dividing the product selling price by the intensive
carbon abatement of the pathway. By subtracting the marginal abatement revenue from
MAC, we determined the net marginal abatement cost after revenues, which we took as
equivalent to the effective carbon price needed for the pathway to reach market parity.
Using these effective carbon prices, we plotted the sum of the carbon abatement potentials
of all pathways that have reached market parity as a function of carbon price. In the case
of repeated products, we excluded the pathway with the higher MAC after revenues. We
included both concrete production pathways because they apply to different types of
concrete. Separately, we calculated the gross subsidies needed to close the cost-price gap
for each pathway by multiplying the difference between selling price and ECOP by the global
demand for the product.

Global Critical Infrastructure Needs and Resource Consumption
The current global consumption of each pathway’s product was used as a basis for all
extensive calculations. Using this basis, the critical infrastructure requirements of renewable
electricity generation, electricity transmission, electrolyzer capacity, and CO2 pipeline
transport networks were analyzed for each global-scale process with the goal of providing
some coarse estimate of potential costs and infrastructure needs. The global TWh of
renewable electricity required for electrochemical pathways was calculated using the
electricity consumption per metric ton of product for each pathway, the global consumption
volume, the electrical energy efficiency, and the faradaic efficiency—the selectivity of input
electrical current to the desired product. For thermochemical pathways, the global renewable
electricity consumption is the electricity consumed to produce the pathway’s feedstocks plus
the comparatively smaller amount of direct electricity consumption of the thermochemical
plant. Since the vast majority of conventional chemical production and industrial energy use
does not come from electricity,7 and current electricity mixes are mostly fossil-based, we
assume that the conventional processes being displaced by CO2 recycling use no renewable
electricity. Therefore, all renewable electricity consumption from deploying CO2 recycling has
full additionality. The intensive hydrogen consumption of the thermochemical pathways (tH2/
metric ton product) was found by dividing the stoichiometric hydrogen consumption of the
pathway by the hydrogen selectivity. This value was then multiplied by global demand for the

                                                                          ENERGYPOLICY.COLUMBIA.EDU | MAY 2021 | 13
OPPORTUNITIES AND LIMITS OF CO2 RECYCLING IN A CIRCULAR CARBON ECONOMY: TECHNO-ECONOMICS, CRITICAL INFRASTRUCTURE NEEDS, AND POLICY PRIORITIES product to determine the global hydrogen consumption of the pathway. For each pathway, we determined the necessary renewable electricity generation capacity in gigawatts (GW) using the global electricity consumption and the capacity factor. We similarly calculated the needed electrolyzer capacity in GW using the electrolyzer electricity consumption associated with the pathway and the capacity factor. We translated these GW capacity values into total capital costs by multiplying the capacity by the unit capital cost ($/ kW). The capital cost of the necessary CO2 transport pipeline infrastructure for each pathway is based on the global CO2 consumption of the process. The global CO2 consumption was found by multiplying the global product demand by the units of feedstock CO2 consumed to produce one unit of product. The CO2 transport capital cost was then calculated by multiplying global CO2 consumption by a CO2 pipeline network capital cost of $42/tCO2/ yr capacity.8 This capital cost is based on a CO2 pipeline network capable of transporting 20 MtCO2/yr, consisting of a 500 km central spine with two 10 km distribution pipelines on each end.9 This provides a minimal cost estimate, as lower capacity, smaller diameter pipelines would cost more. We also determined the total infrastructure costs, GW capacities, and carbon abatement potential summed across all CO2 recycling pathways. In the case of multiple pathways that produce the same product, we included only the pathway with the largest value being summed and excluded the others from the total. We also excluded ethane pathways from the total, since the current leading use of ethane as a feedstock to produce ethylene would be eliminated if ethylene was produced entirely through CO2 recycling. Similarly, we excluded electrochemical CO production from the total since the majority of global demand for CO is as a component of syngas, and other pathways separately account for syngas production. We included both concrete production pathways since they apply to different types of concrete. Finally, we calculated the totals with and without methane production, since the extremely large global demand for methane eclipses the contribution of all other pathways and because CO2 recycling methane pathways were found to have limited prospects of supplying large- scale methane demand. Inputs and Assumptions We designed both the electrochemical and thermochemical CO2 recycling pathways to consume low-carbon electricity, here modeled as renewable energy, and assumed the H2, CO, and/or ammonia consumed as a reactant in thermochemical pathways are supplied by onsite electrochemical processes powered by renewable energy. All numerical assumptions are detailed in Table A1, A2, and A3 in the appendix. We chose globally representative input values to correspond to the global scale of this analysis. We assume the feedstock CO2 is sourced from carbon capture at point-source emitters and delivered to the CO2 recycling plant via a CO2 pipeline network at a total cost of $50 per metric ton of CO2 (tCO2).10 While lower carbon capture costs may be available in certain contexts, these lower costs will not be accessible on average for the global scope and scale of this study. For the thermochemical pathways that consume electrochemically generated feedstocks, we use our own calculated ECOP of the electrochemical feedstock production 14 |CENTER ON GLOBAL ENERGY POLICY | COLUMBIA SIPA
OPPORTUNITIES AND LIMITS OF CO2 RECYCLING IN A CIRCULAR CARBON ECONOMY:
                                               TECHNO-ECONOMICS, CRITICAL INFRASTRUCTURE NEEDS, AND POLICY PRIORITIES

pathway (e.g., water electrolysis for feedstock green H2) as the feedstock price.

Though similar studies often assume renewable electricity prices based on the levelized
cost of energy (LCOE) for renewable generators or average power purchase agreement
(PPA) prices for renewables, these methods do not reflect the duty cycles of industrial use,
contributions of network costs (costs of transmission and distribution), and electricity taxes
to the end-use industrial electricity price paid by producers. While producers may have access
to PPA-range renewable electricity prices at certain times, in limited contexts, and with low
capacity factors, these low prices will not be available on average for the global production
scale evaluated in this study. Therefore, for our estimate of the renewable electricity price paid
for global-scale CO2 recycling processes, we must incorporate the duty cycle requirements
and contributions of network costs and taxes beyond renewable PPA prices.

To estimate the renewable electricity price used in this study, we take renewable PPA
prices in a region to be equivalent to the wholesale price of renewable electricity. We
calculate the corresponding industrial price of renewable electricity by increasing the PPA
price to reflect the additional contributions of network costs and taxes to industrial prices.
Wholesale electricity prices account for 10–70 percent of industrial electricity prices in
different countries.11 We assume that renewable PPA prices on average account for the
same percentage of the final renewable electricity industrial price in a particular country.
To estimate the renewable electricity price used in this study, we assume that CO2 recycling
producers have access to industrial electricity markets and that wholesale electricity
prices represent 50 percent of the price of industrial electricity on a global basis. We use
an average global renewables PPA value of 4.75 ¢/kWh12 and divide it by 0.5 to obtain an
industrial electricity price for renewables of 9.5 ¢/kWh ($0.095/kWh). In keeping with this
framing, we assume a capacity factor of 50 percent for electrochemical pathways supplied
by renewable electricity, which was chosen to represent a combination of wind and solar
with complementary output profiles.13 Since thermochemical pathways have very small direct
electricity consumption and therefore are not as limited by the availability of renewable
resource, we assume a higher capacity factor of 90 percent.

An obvious condition from this cost framing is that the true costs of recycling CO2 will vary
substantially across regions and jurisdictions and that some locations may provide high-capacity
electricity at much lower costs. These sensitivities and ranges will be published separately.

In our techno-economic analysis, we choose values for faradaic efficiency, carbon selectivity,
and hydrogen selectivity that are 20 percent lower than those of the highest performance
catalysts reported in the literature. The 20 percent decrease from the highest performance
values was applied to reflect that many of the cited catalysis studies at the bench scale do not
demonstrate industrially relevant production rates (measured as current density or space-time
yield), and industrial demonstrations of these pathways today would not achieve bench-scale
performance. We obtain energy efficiencies for electrochemical pathways from the same
studies. Our efficiency and selectivity assumptions, along with the associated references, are
summarized in Table A1. We assumed an electrolyzer capital cost of $1,000/kW for water
electrolysis.14 For electrochemical CO2 reduction pathways, since these technologies have not
reached commercial scale and CO2 electrolyzer capital cost data is therefore not available, we

                                                                           ENERGYPOLICY.COLUMBIA.EDU | MAY 2021 | 15
OPPORTUNITIES AND LIMITS OF CO2 RECYCLING IN A CIRCULAR CARBON ECONOMY: TECHNO-ECONOMICS, CRITICAL INFRASTRUCTURE NEEDS, AND POLICY PRIORITIES modeled the electrolyzer based on water electrolyzers with a capital cost of $1,000/kW. For thermochemical pathways, we obtained capital cost estimates from plant simulations in the literature (Table A2). The annual fixed O&M costs were estimated as a small percentage of the total capital cost (Table A3). We included the emissions associated with renewable electricity generation in our carbon abatement life cycle assessment. Renewable power has life cycle emissions of roughly 10–40 gCO2/kWh,15 and we assume an average renewable electricity emissions intensity of 25 gCO2/kWh. 16 |CENTER ON GLOBAL ENERGY POLICY | COLUMBIA SIPA
OPPORTUNITIES AND LIMITS OF CO2 RECYCLING IN A CIRCULAR CARBON ECONOMY:
                                             TECHNO-ECONOMICS, CRITICAL INFRASTRUCTURE NEEDS, AND POLICY PRIORITIES

RESULTS
A large and diverse set of pathways take CO2 as an input to produce value-added products.
We reviewed 61 of such CO2 recycling pathways (Table A5) and further analyzed 19 of the
pathways that produce products with the associated highest global demand in Mt/yr (Table
1). We evaluated green H2 production by water electrolysis—though this does not strictly
qualify as CO2 recycling—because low-carbon hydrogen is a key required input for many CO2
recycling pathways. Our findings are detailed below, and key findings are summarized in Table
A4 in the appendix.

Estimated Cost of Production
The current estimated cost of production (ECOP) gives the cost of producing a ton of product
through a particular CO2 recycling pathway and provides a basis to compare the economics of
each pathway. We calculated a globally representative ECOP for each CO2 recycling pathway.
We define a pathway as “profitable” and at market parity if its ECOP is lower than the product
selling price. The ECOP comprises capital cost (CAPEX), fixed operation and maintenance
(O&M) costs, electricity costs, and costs of various feedstocks. Figure 1 shows the ECOP of
each pathway and the breakdown of ECOP between each cost category. The findings show the
ECOP for most pathways is well above the product selling price.

Figure 1: Estimated cost of production (ECOP) and product selling price for a) electrochemical
and b) thermochemical CO2 recycling pathways
a.

                                                                         ENERGYPOLICY.COLUMBIA.EDU | MAY 2021 | 17
OPPORTUNITIES AND LIMITS OF CO2 RECYCLING IN A CIRCULAR CARBON ECONOMY: TECHNO-ECONOMICS, CRITICAL INFRASTRUCTURE NEEDS, AND POLICY PRIORITIES b. For electrochemical processes, ECOP values are high—most are above $4,000/metric ton product—and greatly exceed the corresponding product selling prices, which lie below $1,000/metric ton product. Electrochemical carbon monoxide (CO) production is a notable exception with a low ECOP of $546/metric ton product, below the CO selling price. Electricity costs comprise the large majority of ECOP for electrochemical processes. Electricity is the main (or only) energy input used in electrochemical pathways to convert low- energy CO2 molecules into high-energy products. Due to relatively high estimated industrial renewable electricity prices today and large amounts of electricity input needed, electricity costs predominate in ECOP. While renewable electricity prices may fall in the future, we do not include projected prices here. Fixed O&M, CAPEX, and CO2 feedstock costs account for similar portions of the remainder of ECOP. The thermochemical CO2 recycling pathways show slightly lower ECOPs than the electrochemical pathways, with most thermochemical ECOP values below $5,000/metric ton product and smaller margins between ECOP and selling price. Ethanol production by lignocellulosic biomass fermentation has a lower ECOP than the product selling price, making the process profitable. Similarly, the two concrete production CO2 recycling pathways, which modify a single step of conventional concrete production, add minimal costs to the conventional process, maintaining an ECOP below the selling price. 18 |CENTER ON GLOBAL ENERGY POLICY | COLUMBIA SIPA
OPPORTUNITIES AND LIMITS OF CO2 RECYCLING IN A CIRCULAR CARBON ECONOMY:
                                             TECHNO-ECONOMICS, CRITICAL INFRASTRUCTURE NEEDS, AND POLICY PRIORITIES

For thermochemical pathways, the cost of feedstock green hydrogen typically accounts
for the majority of the ECOP. Hydrogen consumed as a reactant in thermochemical CO2
recycling reactions is often the largest source of energy input to the process. Since in this
analysis all feedstock hydrogen is produced through renewable-powered electrolysis, the price
of renewable electricity plays a prominent indirect role in thermochemical ECOPs. The cost
of feedstock CO2 is typically a minor component of ECOP for thermochemical pathways. For
Fischer-Tropsch synthesis processes, which use syngas—a mixture of carbon monoxide and
hydrogen—as a feedstock, carbon monoxide and hydrogen costs are the largest component of
ECOP. Once again, this feedstock syngas is modeled to be produced through electrochemical
CO2 reduction, making the renewable electricity price an important indirect contributor to
ECOP for Fischer-Tropsch.

While electricity costs comprise the largest part of electrochemical ECOPs and green
hydrogen/CO are the largest component of thermochemical ECOPs, completely eliminating
these costs would still leave ECOPs that are near or above selling price for many pathways.
For these pathways to reach market parity, other components of ECOP, such as capital cost
and fixed O&M, must decrease along with the major cost components.

A few cost trends are also apparent between pathways. By and large, C2+ products—molecules
with two or more carbon atoms in a chain—have higher ECOPs than single-carbon (C1)
products, which is to be expected. Electrochemical and thermochemical production of
C2+ products, such as ethylene or jet fuel, often have a lower energy efficiency and lower
selectivity compared to the synthesis of C1 products due to the high energy barrier to C-C
bond formation and competition from the more facile C1 pathways.

The gravimetric energy density of the products (Table A1) also plays a major role in
shaping ECOP trends since more energy-dense products require a larger input of energy to
produce, driving up total electricity or feedstock hydrogen costs. Ethanol, for instance, has a
gravimetric energy density over 40 percent lower than that of the other C2 products evaluated
and accordingly has a lower ECOP than the other C2 pathways. The high and low gravimetric
energy densities of hydrogen and carbon monoxide, respectively, similarly factor into these
products’ outlier ECOP values.

The ratio of ECOP to product selling price (Figure 2) provides a clearer comparative view
of how close each pathway is to reaching market parity. A ratio of less than 1 indicates that
ECOP is lower than the selling price and the pathway has reached market parity, as we see for
electrochemical CO production, ethanol from lignocellulosic biomass, and the two concrete
production pathways. The methane and ethane production pathways have extremely high
ratios, suggesting that it may not be feasible for these pathways to ever reach market parity.
Most pathways have ECOP to selling price ratios of up to 7.5, highlighting a wide gap
between ECOP and selling price that demands strong policy efforts to close this gap. As we
will discuss in our policy recommendations, this information can be used to help prioritize the
pathways with lower ECOP to selling price ratios that may more readily reach market parity.

                                                                         ENERGYPOLICY.COLUMBIA.EDU | MAY 2021 | 19
OPPORTUNITIES AND LIMITS OF CO2 RECYCLING IN A CIRCULAR CARBON ECONOMY: TECHNO-ECONOMICS, CRITICAL INFRASTRUCTURE NEEDS, AND POLICY PRIORITIES Figure 2: Ratio of ECOP to selling price for a) electrochemical and b) thermochemical CO2 recycling pathways a. b. 20 |CENTER ON GLOBAL ENERGY POLICY | COLUMBIA SIPA
OPPORTUNITIES AND LIMITS OF CO2 RECYCLING IN A CIRCULAR CARBON ECONOMY:
                                              TECHNO-ECONOMICS, CRITICAL INFRASTRUCTURE NEEDS, AND POLICY PRIORITIES

Cost Sensitivity Analysis
To achieve market parity, the ECOP of most CO2 recycling pathways must decrease
substantially. To assess which performance improvements or component cost reductions
would be most effective, we analyzed the cost sensitivity to key inputs and functional
parameters. The parameters evaluated include the electrical efficiency, electricity price,
capacity factor, capital cost, various feedstock costs, and product selectivity. The product
selectivity broadly describes the percentage of input feedstock and/or energy that goes
toward making the desired product as opposed to undesired byproducts, as detailed in
the appendix. Figure 3 shows the percent change in a pathway’s ECOP that results from
increasing and decreasing an input value by 20 percent, with all else equal. The concrete
production pathways are excluded since their costs are not defined by the metrics analyzed
here, such as product selectivity and feedstock prices. This analysis demonstrates how
sensitive ECOP is to an arbitrary but consistent percent change in each input, to help identify
the main cost drivers for each pathway. Since this analysis focuses on sensitivity, it does not
evaluate the extent or feasibility of cost reductions possible through improvements in each
input and does not imply that a particular input value can or will change by 20 percent in the
future. The extent of improvements available in the value of each input sets an important limit
for ECOP reduction that should be considered alongside cost sensitivity.

For electrochemical pathways, the most significant techno-economic cost drivers are
electrical energy conversion efficiency and product selectivity. This is because electricity
represents the largest component of cost, and low efficiency and selectivity directly increase
the overall electricity consumption of the pathways through energy conversion and faradaic
efficiency losses, respectively. These two inputs are followed closely in importance by the
electricity price itself.

In contrast, changes in capacity factor and electrolyzer capital cost have a relatively small
impact on ECOP. These inputs directly affect CAPEX and fixed O&M costs, which comprise
small portions of ECOP. Similarly, feedstock CO2 price is typically the weakest cost driver since
CO2 input costs are a small portion of electrochemical ECOPs. This suggests an innovation
agenda focused initially on electrochemical selectivity and conversion efficiency as opposed
to capital cost reduction for electrolyzers and renewable electricity price reduction.

                                                                          ENERGYPOLICY.COLUMBIA.EDU | MAY 2021 | 21
OPPORTUNITIES AND LIMITS OF CO2 RECYCLING IN A CIRCULAR CARBON ECONOMY: TECHNO-ECONOMICS, CRITICAL INFRASTRUCTURE NEEDS, AND POLICY PRIORITIES Figure 3: ECOP sensitivity analysis tornado plot for a) electrochemical and b) thermochemical CO2 recycling pathways, showing percent change in ECOP as a result of a 20 percent increase or decrease in input parameters a. 22 |CENTER ON GLOBAL ENERGY POLICY | COLUMBIA SIPA
OPPORTUNITIES AND LIMITS OF CO2 RECYCLING IN A CIRCULAR CARBON ECONOMY:
TECHNO-ECONOMICS, CRITICAL INFRASTRUCTURE NEEDS, AND POLICY PRIORITIES
b.
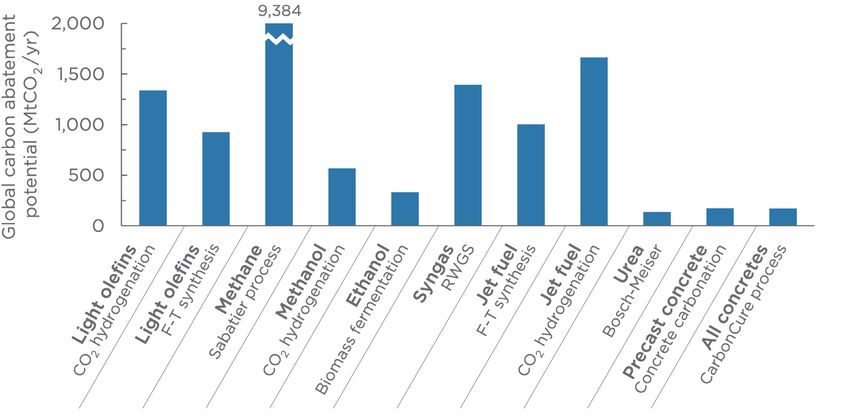
ENERGYPOLICY.COLUMBIA.EDU | MAY 2021 | 23OPPORTUNITIES AND LIMITS OF CO2 RECYCLING IN A CIRCULAR CARBON ECONOMY: TECHNO-ECONOMICS, CRITICAL INFRASTRUCTURE NEEDS, AND POLICY PRIORITIES For thermochemical pathways, selectivity, electricity price, and green hydrogen price are the main cost drivers. In contrast with electrochemical pathways, most of the thermochemical processes receive the majority of their energy input from the hydrogen used as a reactant in the chemical reactions, with heat inputs and direct electricity use contributing relatively small input energy. As a result, ECOP is particularly sensitive to green hydrogen prices and to electricity prices that highly influence green hydrogen production costs. Since a lower selectivity directly increases hydrogen consumption for undesired reaction pathways, selectivity is the most prominent driver of ECOP. The capacity factor and capital cost for thermochemical pathways have a comparatively small influence on ECOP, since CAPEX makes a much smaller contribution to ECOP than hydrogen costs do. The electrical energy efficiency of plant equipment is the least significant ECOP driver for most pathways since the direct electricity consumption of the plant is dwarfed by the energy input from feedstock hydrogen. For all pathways, the CO2 feedstock costs have a relatively small influence on ECOP. In real markets, the price of feedstock CO2 varies considerably based on the source of that CO2. This paper assumes feedstock CO2 is obtained through carbon capture from the flue gas streams of point-source emitters such as steel mills and purchased at a price of $50/tCO2.16 A key alternative potential source of CO2 is direct air capture (DAC), which removes CO2 directly from the atmosphere. Since DAC does not rely on continued use of fossil fuels as a source of feedstock CO2, DAC could potentially avoid the upstream emissions associated with fossil fuel production that exist in most point-source carbon capture scenarios, which can be substantial. DAC would provide feedstock CO2 at higher prices, currently estimated between $250 and $600/tCO2,17 though this cost could drop appreciably with broader deployment.18 DAC might provide a fossil-free source of CO2 as DAC technology matures in the medium to long term. Since feedstock CO2 price has a small influence on ECOP, the higher price of feedstock CO2 from direct air capture would not greatly influence final product costs. For instance, increasing the CO2 feedstock price by 400 percent from $50/tCO2 to $250/tCO2, a price consistent with DAC, would only increase the ECOP of electrochemical CO2 reduction to ethylene by 19 percent. Carbon Abatement Potential Since reducing CO2 emissions is the key motivation of CO2 recycling, we calculated the carbon abatement potential of each pathway (Figure 4). This is based on a life cycle assessment to find the net decrease in emissions that would result from completely replacing conventional production pathways with CO2 recycling pathways. This analysis incorporated the feedstock CO2 consumption of the recycling pathway, the CO2 emissions associated with the recycling pathway, the emissions of the counterfactual incumbent production process that is displaced, and the global demand for the product. The global carbon abatement potential of most CO2 recycling pathways lies between 150 MtCO2/yr and 1,700 MtCO2/yr (Figure 4a and 4b). These extensive carbon abatement potential values reflect both the product’s market size and the pathway’s intensive carbon abatement per ton of product. For example, urea has a low carbon content and therefore a low intensive carbon abatement per ton of product, leading to its relatively low carbon abatement potential of 138 MtCO2/yr. In contrast, the high carbon abatement potentials of the methane pathways largely reflect the product’s high global demand. 24 |CENTER ON GLOBAL ENERGY POLICY | COLUMBIA SIPA
OPPORTUNITIES AND LIMITS OF CO2 RECYCLING IN A CIRCULAR CARBON ECONOMY:
                                           TECHNO-ECONOMICS, CRITICAL INFRASTRUCTURE NEEDS, AND POLICY PRIORITIES

Figure 4: Global carbon abatement potential for a) electrochemical and b) thermochemical
CO2 recycling pathways. Intensive carbon abatement for c) electrochemical and d)
thermochemical pathways. Carbon abatement is defined as the net emissions reduction of
displacing a conventional production pathway with a CO2 recycling pathway.
a.

b.

                                                                       ENERGYPOLICY.COLUMBIA.EDU | MAY 2021 | 25
OPPORTUNITIES AND LIMITS OF CO2 RECYCLING IN A CIRCULAR CARBON ECONOMY: TECHNO-ECONOMICS, CRITICAL INFRASTRUCTURE NEEDS, AND POLICY PRIORITIES c. d. We estimated the sum carbon abatement potential for these CO2 recycling pathways together by adding the abatement potentials of each pathway, excluding the outlier methane pathways and redundant products as described in the methodology. The combined carbon abatement potential of the included pathways is 6.8 gigatonnes of CO2 per year (GtCO2/yr), or 16 percent of the 2019 global CO2 emissions of 43.1 GtCO2.19 Adding in the abatement potential 26 |CENTER ON GLOBAL ENERGY POLICY | COLUMBIA SIPA
OPPORTUNITIES AND LIMITS OF CO2 RECYCLING IN A CIRCULAR CARBON ECONOMY:
TECHNO-ECONOMICS, CRITICAL INFRASTRUCTURE NEEDS, AND POLICY PRIORITIES
contribution from Sabatier process methane production, the more viable of the two methane
pathways, the maximum abatement potential is 16 GtCO2/yr.
The intensive carbon abatement gives the tons of CO2 abated per ton of product made
through each pathway based on the aforementioned life cycle emissions assessment (Figure
4c and 4d). Importantly, all pathways evaluated have a positive carbon abatement value
under our assumption that the pathways use low-carbon inputs, indicating that using a CO2
recycling pathway to displace conventional production would indeed reduce CO2 emissions.
Many pathways have carbon abatement values between 2 and 9 tCO2/metric ton of product,
demonstrating an appreciable amount of carbon abatement for each unit of CO2 recycling
production. The two concrete pathways have particularly low intensive carbon abatements.
This is because, during CO2 curing of concrete, CO2 is incorporated at a relatively low
weight percent into solely the cement component of concrete, and cement only accounts
for an estimated 12.5 percent of the total mass of concrete.20 However, the very large global
demand for concrete leads to appreciable global carbon abatement potentials for concrete
pathways. Urea also has a relatively low intensive carbon abatement, partly because urea has
a low gravimetric carbon content, meaning a small amount of CO2 is consumed in the urea-
producing reaction. Ethylene and jet fuel pathways have large intensive carbon abatements
due to the high carbon content of these products. Hydrogen, on the other hand, has a large
carbon abatement because the conventional pathway it displaces, steam methane reforming,
has high emissions of roughly 12 tCO2/metric ton H2.
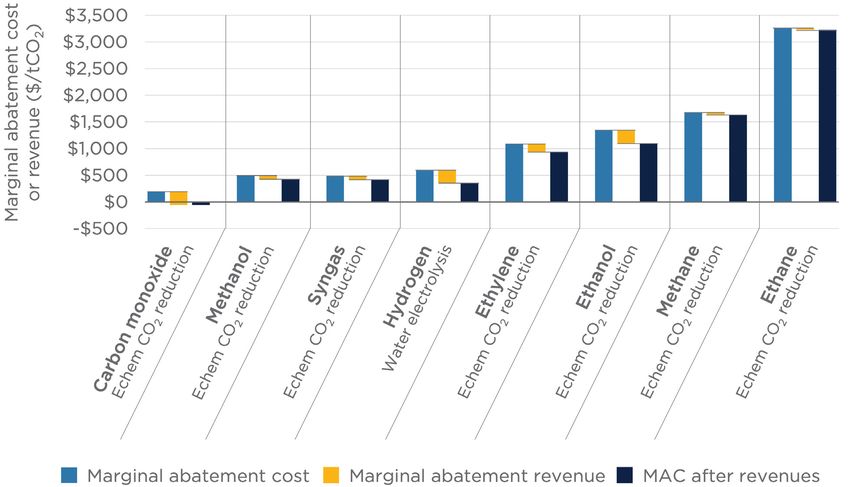
Marginal Abatement Cost and Revenue
To assess the economics of carbon abatement, the marginal cost of reducing carbon
emissions, or marginal abatement cost (MAC), provides an initial economic metric for
evaluating these pathways. The MAC gives the cost of each pathway in dollars per metric ton
of CO2 abated and was calculated by dividing ECOP by intensive carbon abatement. Since the
products of these pathways will be sold for revenue, we also calculated the revenue generated
per metric ton of CO2 abated by recycling pathways, termed the marginal abatement revenue
(MAR). The marginal abatement revenue was then subtracted from MAC to obtain the MAC
after revenues. These three values are displayed in Figure 5 as a waterfall chart, in which MAC
is shown as the initial value from which MAR is subtracted to yield MAC after revenues for
each pathway.
ENERGYPOLICY.COLUMBIA.EDU | MAY 2021 | 27You can also read