CAN "MAKE IN INDIA" MAKE JOBS? THE CHALLENGES OF MANUFACTURING GROWTH AND HIGH-QUALITY JOB CREATION IN INDIA
←
→
Page content transcription
If your browser does not render page correctly, please read the page content below

JAMES A. BAKER III INSTITUTE FOR PUBLIC POLICY
                    RICE UNIVERSITY

      CAN “MAKE IN INDIA” MAKE JOBS?
THE CHALLENGES OF MANUFACTURING GROWTH
  AND HIGH–QUALITY JOB CREATION IN INDIA

                              BY

                    RUSSELL A. GREEN
        WILL CLAYTON FELLOW IN INTERNATIONAL ECONOMICS
          JAMES A. BAKER III INSTITUTE FOR PUBLIC POLICY
                        RICE UNIVERSITY

                     DECEMBER 15, 2014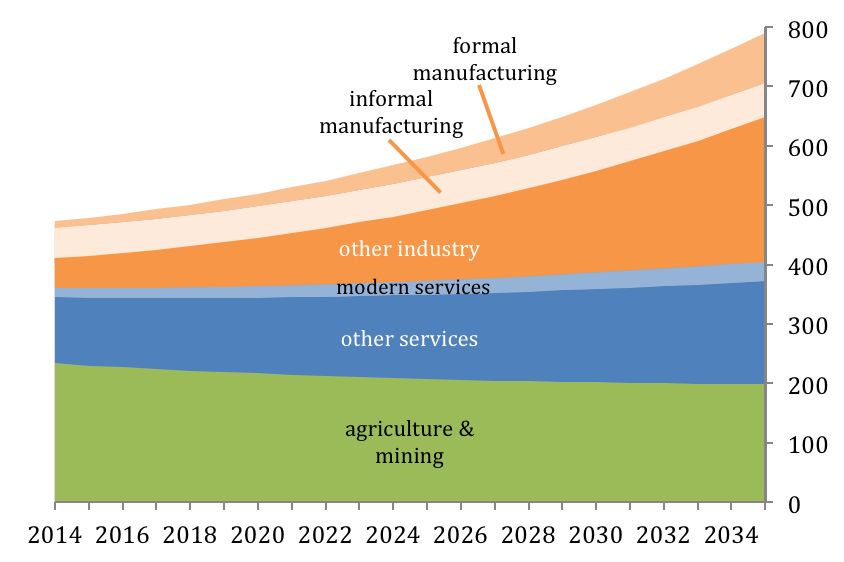
Can “Make in India” Make Jobs?

THIS PAPER WAS WRITTEN BY A RESEARCHER WHO PARTICIPATED IN A BAKER INSTITUTE
RESEARCH PROJECT. WHEREVER FEASIBLE, PAPERS ARE REVIEWED BY OUTSIDE EXPERTS BEFORE
THEY ARE RELEASED. HOWEVER, THE RESEARCH AND VIEWS EXPRESSED IN THIS PAPER ARE
THOSE OF THE INDIVIDUAL RESEARCHER, AND DO NOT NECESSARILY REPRESENT THE VIEWS OF
THE JAMES A. BAKER III INSTITUTE FOR PUBLIC POLICY.

  © 2014 BY THE JAMES A. BAKER III INSTITUTE FOR PUBLIC POLICY OF RICE UNIVERSITY

     THIS MATERIAL MAY BE QUOTED OR REPRODUCED WITHOUT PRIOR PERMISSION,
             PROVIDED APPROPRIATE CREDIT IS GIVEN TO THE AUTHOR AND
                THE JAMES A. BAKER III INSTITUTE FOR PUBLIC POLICY.

                                        2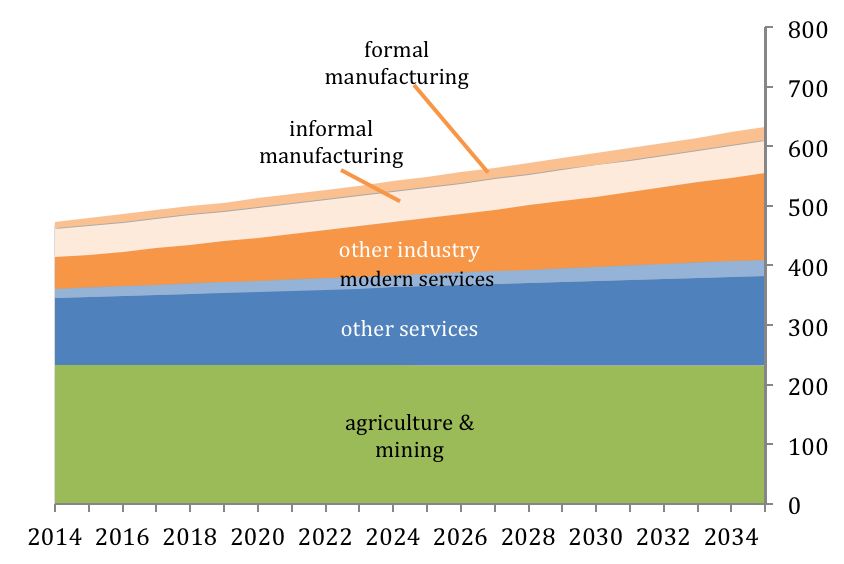
Can “Make in India” Make Jobs?

                                    ABOUT THE AUTHOR

Russell A. Green, Ph.D., is the Will Clayton Fellow in International Economics at Rice University’s
Baker Institute for Public Policy. He is also an adjunct professor in the Economics Department,
where he teaches international finance and macroeconomics. Green’s current research focuses on
financial market development in emerging market economies, financial inclusion, and Indian
developmental challenges. His non-academic writing regularly appears in op-ed pages of prominent
American and Indian newspapers.

Prior to joining the Baker Institute, Green spent four years in India as the US Treasury Department’s
first financial attaché to that country. His engagement in India primarily focused on financial market
development, India’s macroeconomy, and illicit finance, and also included diverse topics such as
cross-border tax evasion and financing global climate change activities. He worked with counterparts
in India’s government to develop the US-India Economic and Financial Partnership, launched in
2009 by Indian Finance Minister Pranab Mukherjee and US Treasury Secretary Timothy Geithner.

Green was previously the deputy director of the US Treasury’s Office of International Monetary
Policy, where he led efforts to strengthen International Monetary Fund exchange rate policies and
international reserve management. He started his tenure at Treasury in the Office of Quantitative
Policy Analysis, focusing on emerging market vulnerabilities and debt sustainability analysis. His
economic research has addressed bank regulation, financial liberalization, international reserve
accumulation, bilateral investment treaties, and the economics of international reproductive health.
Green speaks Spanish and Japanese and holds a B.A. from Pomona College and a Ph.D. from the
University of California, Berkeley.

                                   ACKNOWLEDGEMENTS

This report was greatly facilitated by the able research assistance of Thomas McAuley and benefited
from useful discussions with Ajit Ghose and Berthold Herrendorf.

                                                  3
Can “Make in India” Make Jobs?
Abstract
A new “Make in India” campaign to “transform India into a global manufacturing hub” aims to
use manufacturing as a vehicle for job growth. Is this strategy realistic? This paper helps answer
the question by describing the job growth potential of the Indian economy. Formal-sector
manufacturing demonstrates the most potential for job growth under a more supportive policy
regime. The paper models future employment paths for India for the next 20 years. Assuming
sufficient reforms to generate East Asia-style manufacturing growth, the impact on employment
and output is substantial, even if the campaign target of 100 million new manufacturing jobs
remains difficult to achieve. The paper then describes a set of reforms sufficient to unleash such a
manufacturing growth boom.
4Can “Make in India” Make Jobs?
1. Introduction
India has a jobs problem. The country’s economic growth, even at the impressive rates of the last decade,
has not produced meaningful jobs for its expanding working-age population. Dead-end rural construction
jobs have offered the only area of expansion. Millions too many families depend on low productivity
agriculture for a living as a result.
The jobs issue is also politically salient. The 10 states that elected the most members of parliament for
Prime Minister Narendra Modi’s party, the Bharatiya Janata Party (BJP), have significantly higher
fertility rates—and therefore more new job seekers—than the rest of India.1
Modi’s headline-grabbing response has been a “Make in India” campaign to “transform India into a
global manufacturing hub” and thereby use manufacturing as a vehicle for job growth. The plan includes a
variety of measures from easing the regulatory burden to establishing special economic zones to awaken
India’s latent manufacturing power.
Yet many economists consider labor-intensive manufacturing to be a futile goal given India’s internal
hurdles and external competition.2 They suggest that India stick with its service sector orientation and
focus on improving job creation potential there.
Is Modi’s strategy realistic? This paper helps answer the question by describing the key barriers to job
growth and assessing the job growth potential of the Indian economy.
Developing a strategy for job growth requires careful identification of sectors with true potential. Of
course, examining the economy at the level of manufacturing and services skims over important detail,
including many types of firms and industries that bear little potential. Choosing the path forward is
further complicated by the fact that past performance provides a poor indicator of true potential. A sector
hobbled by an adverse environment could look completely different with appropriate policy interventions.
Finer distinctions and anticipation of policy impacts will allow policymakers to plot a course for
optimal job growth. This paper finds that the modern service sector and the formal
manufacturing sector (both described in detail below) are the true growth sectors for India. Both
5Can “Make in India” Make Jobs?
have exhibited moderate job creation on a low base. Formal-sector manufacturing, however, has
the most potential for transformation under a more supportive policy regime.
This paper models future employment paths for India for the next 20 years. The best case
scenario anticipates sufficiently supportive policy changes to generate sustained 14 percent
growth of formal-sector manufacturing. That scenario could create more than 100 million
additional jobs. Of those jobs, almost 70 million would come from high-productivity sectors, or a
shift of 8 percent of the workforce. Although such a change implies missing the Make in India
target of 100 million new manufacturing jobs, it would still put the share of employment and
output of Indian manufacturing in the range of East Asian countries like Indonesia, Malaysia,
and China in the next two decades.
The incremental approach to reform taken thus far by the Modi government has not yet
removed enough barriers to manufacturing growth to initiate such a best case scenario. In
subsequent sections the paper reviews policy measures necessary—labor reforms, general business
climate, provision of public goods, and institutional reforms—to achieve meaningful change.
More ambitious reforms will be needed to overcome the significant barriers to competitive labor-
intensive manufacturing in India.
2. The Need for More Jobs
One of the highest priorities of the Indian government is economic inclusion —bringing more
citizens into the modern, productive economy. This is critical for meeting poverty alleviation
targets and improving many related health and education indicators. The most effective route to
improving economic outcomes is through formal sector jobs, which pay regular—and generally
higher—wages. They provide economic stability for families, allowing greater predictability and
planning in other aspects of their lives. In India only about 14 percent of the workforce has such
a formal sector job.
6Can “Make in India” Make Jobs?
Formal sector jobs were the main vehicle by which China lifted 500 million people out of
poverty over the past 25 years. While poverty measurement in India is a controversial topic, India
has likely made half of China’s poverty reduction progress.3 It has at least as far to go to reach
Chinese poverty rates of 6 percent.
Demographic Headwinds
The time is right for an all-out effort to create more high-quality jobs. Current demographic
trends offer India a one-time boost in its economic potential. The country’s young population
and declining fertility levels are causing the workforce to grow faster than the population as a
whole. This is represented in the dependency ratio—the ratio of nonworking-age people to
working-age people— which has been declining for several years (Figure 1).
A declining dependency ratio is often referred to as a “demographic dividend” because a higher
proportion of workers implies higher per capita income, assuming wages at least remain constant.
Rising per capita income creates a virtuous circle with higher disposable incomes, greater
consumption, and therefore faster growth. In addition, domestic savings rise, producing a larger
pool of capital to finance investment and development.
The U.S. and Japan experienced a fertility decline decades ago and have already reaped the
benefits. Positive demographic forces also helped propel the miracle economies of East Asia to
sustained high growth rates. India’s dependency ratio started its decline around the same time as
Korea and China, but the decline has been much slower. While the extra boost to East Asia has
largely ended, India can expect many more years before the dependency ratio bottoms out.
7Can “Make in India” Make Jobs?
Figure 1. Population Dependency Ratio
Percent nonworking age/working age, with low point indicated
Source: Population Division of the Department of Economic and Social Affairs of the UN, World Population
Prospects: The 2012 Revision, esa.un.org/unpd/wpp.
India only has until roughly 2040 to take advantage of these headwinds. If India can create more
high productivity, higher wage jobs, the demographic dividend will support higher growth levels
than would ordinarily be possible.
Winds Can Blow Both Ways
The other side of rapid labor force growth is immense pressure to produce the jobs linked to the
demographic dividend. India’s labor force will grow by almost 10 million workers per year for the
next 10 years.4 In addition, agricultural employment has been falling at a rate of about 5 million
workers per year for the past decade. At the rate that nonagricultural enterprises have created
jobs since 2000 (GDP has grown almost three times faster than employment), India will require
economic growth rates of 14 percent per year outside of agriculture to meet the need for jobs.
What happens if the private sector is not ready with jobs for this demographic dividend, if it
does not produce jobs that pull workers into higher income, higher productivity jobs than
8Can “Make in India” Make Jobs?
previous generations? A large population of underemployed or unemployed young people is a
typical ingredient for political discontent and social unrest. The demographic dividend becomes
a demographic nightmare.
The recent past does not provide much hope that the current economic structure will succeed in
producing a demographic dividend without significant changes. Between 2005 and 2012, despite
respectable nonagricultural economic growth of 9.5 percent, India added new nonagricultural
jobs at a rate of only about 7 million per year.5 Half of those were dead-end jobs in rural
construction in the four big states with the highest fertility rates.6
Furthermore, the increase in construction jobs largely came from government work schemes, not
private sector activity.7 As a result productivity rates in construction have declined because
surplus labor is merely spilling over from one fallback activity (agriculture) to another. This is not
a phenomenon exclusive to the rural poor, either. Some estimates project India producing twice
as many graduates as its job growth can absorb.8
India holds big potential for poverty reduction through economic growth, but not without a
major break from the status quo. The current trend will continue to leave most of the country
behind. This is an outcome India neither wants nor can afford.
3. Structural Problems
The story behind India’s lack of progress on higher-productivity job creation can be summed up
in one graph. Figure 2 illustrates how employment and GDP are split between the three major
sectors of the economy. Agriculture possesses most of the labor force, but services produce most
of the output. Industry ranks behind services in both categories, playing a relatively minor role in
the economy.9 Clearly a re-alignment of the labor force toward more productive activities would
yield large benefits.
9Can “Make in India” Make Jobs?
Figure 2. Sectoral Contribution to the Economy in 2010 (percent)
Global Comparisons
For India’s level of development, this economic structure does not fit the usual pattern seen
elsewhere.10 One of the many contributions of Nobel Prize-winning economist Simon Kuznets
was to document the typical pattern of economic development through the evolution of the
agriculture, industry, and services sectors.11 Today’s rich economies took a development path that
transitioned from the dominance of agriculture to large-scale manufacturing for both
employment and GDP. Only at higher levels of per-capita income did their service sectors come
to dominate the economy, becoming post-industrial economies.
The classic pattern of structural change continued in the last half of the 20th century among
successful developing countries. Most East Asian and Southeast Asian countries that have
achieved sustained high growth rates experienced industrialization prior to the rise of the service
sector.
In the new century, the pattern is beginning to evolve as some of the more advanced developing
countries in Asia begin their shift toward service sector growth.12 Developing countries as a
group are looking more post-industrial. The next set of figures present the new patterns in both
employment and GDP.
10Can “Make in India” Make Jobs?
Looking across all developing countries in recent years, the share of employment in industry
continued to grow while agriculture employed fewer workers (Figure 3). The share of the service
sector grew fastest, however. Developed countries have lost manufacturing jobs overall as their
economies automate further and rely on services for employment.
Figure 3. Global Change in Share of Employment, 2000–2010
Source: World Development Indicators, World Bank.
Figure 4. Change in Share of GDP, 2000–2010
Source: World Development Indicators, World Bank.
11Can “Make in India” Make Jobs?
In terms of GDP, the service sector in developing countries grew fastest, gaining output share,
while agriculture fell behind (Figure 4). Industry hit the middle, maintaining a constant share of
GDP. In developed countries industrial output actually shrank, indicating their post-industrial
status.
For India, on the other hand, industry has added jobs faster than even services.13 A further
distinction for India is that it saw growth in industry’s share of GDP, mostly due to growth in
manufacturing. Yet the service sector share of GDP grew faster, furthering India’s service sector
dominance. So while the service sector has always eclipsed industry in terms of GDP growth,
manufacturing is more robust in India than in most developing countries.
India’s Economic Structure in Detail
Walt Rostow, eminent economist and former national security advisor, stated, “without
appropriate disaggregation the study of growth is … [like] playing piano while wearing
mittens.”14 This is certainly true in India, as Figure 5 demonstrates. There are a few high-
performance pockets of the economy, and large laggards.
Figure 5. Performance of Sub-sectors, 2005–2012
Bubble size indicates workforce size
Source: 68th Round of the National Sample Survey and National Accounts, Ministry of Statistics.
12Can “Make in India” Make Jobs?
To some degree, the point of this policy paper is to identify which bubbles India should target
with supportive policies, and how. The aim is to create large bubbles in the northwest corner of
the graph. The next few sections explain Figure 5 in detail, providing sector-specific context to
illustrate how they have contributed to employment and GDP growth in India.
Agriculture
India’s labor force is languishing in low-productivity agriculture. Although agriculture provides
the majority of India’s jobs, the sector contributes little to GDP. It is the default employment
option for millions of rural residents with poor job opportunities, with families dividing farms
into ever-smaller plots with each generation.
There is scope for improving productivity in agriculture through improved infrastructure,
investment in irrigation and cold storage technology, removing restrictions on marketing
agricultural products, and easing land acquisition. Nonetheless, no productivity improvement will
likely increase demand for agricultural labor. Rather, the opposite is more likely.
The current lack of productivity means that the Indian economy is underutilizing its labor
abundance. Shifting workers out of agriculture into urban manufacturing and services holds
tremendous potential. India’s Ministry of Finance calculates that a manufacturing worker is four
times as productive as his or her counterpart in agriculture; a services worker is almost seven
times more productive.15
A transfer from agriculture to a more productive sector would also benefit workers. The
McKinsey Global Institute has estimated that an illiterate worker who moves from agriculture to
light manufacturing can expect a wage increase of 40 percent. A worker with basic literacy can
expect even better: a wage increase of 70 percent should he move from agriculture to heavy
manufacturing.16 Other studies show similar results regarding moves from rural areas to urban
centers, finding that urban households make two to three times more annually than comparable
rural households.17
13Can “Make in India” Make Jobs?
Services
Since colonial days India’s service sector has defied the classic development pattern, as services
have exceeded industry as a share of GDP since at least 1901.18 It has historically been a source
of formal jobs, meaning jobs with a work contract, performance-linked incentives, benefits,
better physical working conditions, and training, and it still is today (Figure 6).19
Figure 6. Formal Sector Jobs, 2012
Millions and percent of total employment
Source: 68th Round, National Sample Survey, Ministry of Statistics.
The service sector also defied conventional wisdom by fueling India’s growth from 1994 to
2008.20 It avoided many of the constraints faced by manufacturing because it does not rely as
heavily on infrastructure and land. Further, regulations on labor and competition largely do not
apply to services, and the tax burden is lighter. So once technology allowed the export of software
and business services efficiently, India’s service sector developed rapidly.21
Service sector output growth has not translated into significant employment growth in the last 10
years, as shown in Figure 3 above. Despite service sector economic growth of 9.7 percent per year
from 2005 to 2012, employment grew a meager 2.5 percent.
14Can “Make in India” Make Jobs?
The overall story of the service sector consists of slow job growth, but improvement in
availability of jobs for high-skill educated workers. Indeed, service sector employment has been
good to certain segments. Service sector growth has been associated with substantial
improvements in employment conditions in the economy, in particular a substantial increase in
the number of quality jobs with benefits.22
A much clearer understanding of the service sector can be gained by dividing it between
“modern” and “traditional” services. Modern services are technology-enabled, transportable, and
tradable. They include financial intermediation, computer services, business services,
communication, and legal and technical services. Because of technology and trade, modern
services perform much more like manufacturing, characterized by fast productivity growth and
potential to leverage export markets for growth.
Strikingly, India’s exports of modern services have grown faster than goods exports from East
Asia over the main takeoff period of 1996-2006. Modern services now constitute two-thirds of
all service exports and one-fifth of overall exports from India. This export intensity exposes them
to global competition, forcing rapid improvements in efficiency and quality.
Modern services—plus education, health care, and hospitality—explain the sustained output
growth in India’s service sector.23 What distinguishes the modern service sector more than
growth rates is productivity (Figure 5). Communications, finance, and computer-related services
yield five or more times the output per worker than most traditional services.24
15Can “Make in India” Make Jobs?
Figure 7. Service Sector Productivity: GDP per Worker, 2012
Bubble size indicates workforce size
Source: 68th Round of the National Sample Survey and National Accounts, Ministry of Statistics.
Productivity means getting more done with fewer workers, so related to high productivity is a
limited impact on employment. The bubble sizes in Figure 7 indicate that the high-productivity
sectors do not employ nearly as many workers as the low-productivity sectors. As Ejaz Ghani of
the World Bank put it, “The service sector has contributed more strongly to growth than to
employment. The rapidly growing high-skilled service sector can only provide employment to a
very small percentage of the growing labor force.”25
Manufacturing
India has a dual economy, and when discussing manufacturing, it is absolutely necessary to
distinguish between its formal and informal sectors.26 The formal manufacturing sector would
appear familiar to a developed country observer. These firms incorporate, pay taxes, have legal
utility hookups, make some effort to comply with the regulatory structure, and theoretically have
16Can “Make in India” Make Jobs?
access to the formal financial system. Informal firms, on the other hand, are much less integrated
into government-linked activities and tend to be very small.27
This distinction matters because employment in informal manufacturing is sizeable, but its
contribution to the economy is not proportional. Formal manufacturing follows the opposite
pattern. Figure 8 presents the specific breakdown between the two segments according to shares
of employment and value added.28 The share of firms is even more skewed than employment,
with 87 percent of manufacturing firms in the informal sector.29
Figure 8. Manufacturing Contribution to the Economy, 2012 (percent)
Source: 68th Round of the National Sample Survey and National Accounts, Ministry of Statistics.
The ratio of value added per employee from Figure 8 gives a simple indication that the
productivity of the formal sector is much higher than the informal sector. A more careful
comparison using micro data, controlling for amount of capital investment, technology, industry,
region, and firms’ age, indicates that productivity is about twice as high in firms with more than
250 employees than in those with only up to 10 employees.30 Higher productivity accordingly
links to higher wages.31
Observers rightly praise informal manufacturing for its entrepreneurial spirit—think of the
often-cited figure of $1 billion in annual output from Mumbai’s Dharavi slum. But that can-do
spirit does not belie low productivity, or the preference of those workers for a formal sector job
with better working conditions. Rather, informal manufacturing largely developed due to
17Can “Make in India” Make Jobs?
restrictions on formal manufacturing. Some 85 percent of informal manufacturing firms and
slightly less than half of informal manufacturing employment consist of single-person
microenterprises.32 Comparing education and income, these sole proprietors look much more like
casual laborers than entrepreneurs, suggesting little propensity to grow.33 Informal
manufacturing—while an admirable expression of jugaad, a local word for clever work-arounds—
should not be actively promoted.
There are other segments of “industry” besides manufacturing that operate in the formal sector.
Formal-sector construction firms employ large numbers of workers. Indeed, formal-sector
construction jobs have grown just as much as informal ones in the last decade, together making
“other industry” the highest growing sub-sector in Figure 5.
Yet productivity in construction is low and dropping. As noted above, informal construction jobs
represent little more than a spillover from agriculture, where productivity can be insufficient to
support a livelihood. With such a low wage threshold to beat, construction projects can add still
more workers to a site though they add very little value.
The formal manufacturing sector presents a much more hopeful picture. It provides more formal
sector jobs than modern services (Figure 6). Output has been growing rapidly at 11 percent per
year from 2005 to 2012. Only modern services experienced faster output growth (Figure 5).34
Because the difference between the formal and informal sectors is so great, and because the
informal sector employs so many workers, conclusions drawn about Indian manufacturing as a
whole misrepresent the reality of the formal sector. For instance, manufacturing as a whole has
not seen much employment growth in the last decade. Employment in formal manufacturing, on
the other hand, has also grown impressively in the same period. An annual employment growth
rate of 5.3 percent is more than 1.5 times that of the non-agricultural economy as a whole.
Indeed, the manufacturing buoyancy depicted in Figures 3 and 4 derives almost entirely from
formal sector firms.
18Can “Make in India” Make Jobs?
Realistically, formal manufacturing suffers two critical shortcomings as an engine of mass job
creation. First, it is too small, and second, it is overly focused on capital-intense methods of
production. The first point is straightforward. If manufacturing as a whole is too small in terms
of GDP and employment, the formal sector is even smaller, at 11 percent and 3 percent
respectively.
The second point is more complex. Low employment implies high productivity in formal sector
manufacturing, but also reflects that Indian manufacturing has relied more heavily on capital
than labor for its growth. Indian firms operate in more capital-intensive industries than predicted
from the experience of other countries with similar labor supplies, development levels, and
institutional quality.35 For instance, the four largest manufacturing industries by output—
comprising over half of all manufacturing output—are also the four least employment-
intensive.36 Within the same industry, they use more capital and less labor than comparable firms
in other countries.37 At least through 2004, India’s labor intensity was declining, in contrast to
several other Asian economies.38
The reasons for the small size and capital intensity of formal-sector Indian manufacturing have
been widely documented.39 Among the most salient are inflexible labor regulations, poor
infrastructure, unhelpful government, and difficulty acquiring land (see Box 1). Hence, the
formal manufacturing sector has been constrained by many forces other than innate capabilities
and endowments of skill, labor, and capital. This suggests the capital-intensity is an adaptation
to unique factors in India, not best practice.
19Can “Make in India” Make Jobs?
Box 1. Outsourcing within India—Understanding Capital Intensity
One story behind capital intensity comes from research indicating that successful capital-
intensive formal-sector manufacturers often outsource many labor-intensive activities to
informal-sector firms.40 This allows them to keep workers off their books to avoid
exposure to further regulatory interference.
Another insight comes from the firm Teamlease, a special temp agency that provides a
permanent supply of contract workers to formal sector firms. The employees officially
work for Teamlease but work on the premises of the contracting firm. Similar to
arrangements with informal firms, Teamlease allows its clients to keep official headcounts
low. It has grown to one million employees, approximately equal to the number of
employees in firms engaged in processing meat and vegetables. (Note: food processing
should be a labor-intensive industry, but instead has below average labor intensity relative
to other Indian manufacturing segments.)
The owner of Teamlease, Manish Sabharwal, says his firm “should not exist” because
such services should not be needed.41 When labor regulations are relaxed, large firms
presumably absorb the activities (and labor) of their informal firm partners and contract
employees, to everyone’s benefit.
4. Where Is the Job Growth Potential?
From a macroeconomic and demographic perspective, policymakers should aim for two job
market outcomes. The first is to accommodate the continued shift of workers out of agriculture.
In this regard, almost any job they take will increase their productivity and income. Thus far the
economy has supported sufficient low-end jobs to sustain employment. The lack of prospects for
productivity growth in these uncompetitive, largely untraded sectors means this objective alone is
insufficient for the long-term health of the economy.
20Can “Make in India” Make Jobs?
The second objective is to shift the job structure to more competitive industries. Unlike
construction, for instance, manufacturing faces global competition. The necessity to improve
efficiency drives productivity growth and hence wages. When these industries obtain the size to
impact broader labor markets, they pull up wages and incomes across the economy. For this
reason growth economists label them “elevator industries.” They are an essential component of
the development process.
Once this quality was thought to belong exclusively to the formal manufacturing sector.
Countries like India have led the way in proving, however, that modern services can operate as
elevator industries in the same manner. As productivity improves, the gain is typically shared
through rising wages. These jobs should provide a path to future wage growth.
Firms in these sectors are also more likely to use formal employment arrangements, including
benefits. Relative to informal, low-end jobs, these jobs provide a greater degree of stability.42 For
the poor, who face many sources of uncertainty, job stability can bring tremendous benefits in
terms of planning and access to credit.
As mentioned at the start, economists have debated whether to promote services or
manufacturing to meet these two objectives. Further, India’s service sector has overshadowed
manufacturing for more than 100 years. Is there scope for change? Where should policymakers
focus their attention? Fortunately, this is not a zero-sum game. Both sectors hold some potential,
as reviewed below.
Services
As illustrated above, the modern services that offer the best jobs have not done so in large
quantities. Even formal sector jobs in traditional services, the largest source of those jobs,
constitute only about 6 percent of all jobs in the economy (Figure 6). Furthermore, almost half of
formal sector jobs in traditional services come from public administration and education, neither
likely to drive major productivity gains.
21Can “Make in India” Make Jobs?
Perhaps most important in the context of growing demographic pressure, job growth has been
much slower than output growth, and has been concentrated in segments requiring high-skill,
educated workers. If India is able to follow global trends in education progress, in 20 years it
should see a doubling of the number of people with the post-secondary education necessary to be
qualified for a professional job in the modern service sector (Figure 9). That would mean roughly
one-third of workers who enter the labor force between now and 2035 would be highly
educated.43 They will certainly not all find jobs in the modern service sector.
Figure 9. Indian Labor Force by Educational Attainment
*+,,+-./"
&!!" &!!"
%!!" 0123425" %!!"
/16-.7425"
$!!" $!!"
92+*425"
#!!" #!!"
.-"178643-."
!" !"
#!'!" #!'(" #!#!" #!#(" #!)!" #!)(" #!$!" #!$(" #!(!"
Note: This projection assumes India follows global educational trends and that the labor force participation rate by
education stays constant.
Source: Wittgenstein Centre for Demography and Global Human Capital, Wittgenstein Centre Data Explorer
Version 1.1, 2014, http://witt.null2.net/shiny/wittgensteincentredataexplorer/.
Looking forward at future job growth potential, four factors will impact the service sector’s
potential expansion: Domestic and export markets, reforms, and demographics.
1. Domestic market capacity
First and most importantly, India’s domestic market is the primary consumer of services, and
it remains largely undeveloped. Almost 80 percent of service sector growth from 2000 to
22Can “Make in India” Make Jobs?
2010 came from domestic final demand.44 As income levels rise and India’s middle class
develops, many new large markets for more sophisticated services will open wide. India’s
extremely fast growth of mobile phone services provides an excellent example. India’s
demand for services has grown faster than one-for-one with rising income. Globally the
share of income spent on services continues to rise, suggesting the trend in India will only
persist.45
Further, the capacity for expansion of technology into the Indian service sector is immense,
from providing high-tech logistics support in the trade and transport sector to computerizing
government operations. This will give the modern service sector a particularly fertile market
for expansion as the traditional economy matures. However, the net impact on employment
from this sort of expansion is questionable, since technology may displace workers.
2. Export market capacity
The export markets that earned software programmers and call centers their reputations will
determine the ability to leverage global markets for service sector growth. The US and
Europe (the market for about 90 percent of their exports, according to trade group Nasscom)
are saturated, growing slowly and courting competitors from countries like the Philippines,
Nigeria, and Mexico. Efforts thus far to diversify into new markets have not shown promise.
Despite weakness in export markets, modern services are the only sectors that have
maintained high growth rates during the economic malaise of the last two years. Extending
the trend of export-led growth may prove challenging in the future without significant
change, but the sector has beaten the odds thus far.
3. Reform impact
Modern services are the miracle sector that grew despite the adverse business environment, so
presumably their potential to benefit from further liberalization is lower than other sectors.
That is not to say that areas of finance could not benefit from policy change. Proposals by the
Modi government to abolish laws preventing women from working night shifts could
23Can “Make in India” Make Jobs?
improve hiring by call centers and other businesses working on foreign time zones. But no
policy barrier holds the potential to unleash a major new wave of growth.
Traditional services are another story. Improvements in the provision of core public sector
goods like infrastructure, law enforcement, and education could dramatically improve
transportation, trade, hospitality, and health care. Some efficiencies may be labor-reducing.
Presumably, however, the overall quality improvements that could be enabled would give a
big boost to overall growth.
4. Demographics
An adequate supply of skilled labor poses one potential limitation on growth. Despite the
education forecast cited above, the Confederation of Indian Industries’ India Skills Report
2014 cites research showing that the information technology industry will face a shortage of
3.5 million skilled workers by 2022.46 Wage costs in modern services have generally risen
faster than inflation, indicating difficulty acquiring adequate staffing.
However, modern services have proven many previous forecasts of labor shortages wrong.
Large employers have managed to develop the employees they need through in-house
training programs and collaboration with private educators. Further, the analysis above
suggests plenty of new educated workers will graduate in the next 20 years. Another way to
approach the question is through growth rates. The additional workers with post-secondary
education coming onboard over the next 20 years represents a 3 percent annual growth rate.
Over the past decade, modern services output grew at about three times faster than its
workforce. If the relationship between output and employment holds, the supply of educated
people can support a 9 percent growth rate in modern services output.
Overall, future services output growth will likely be driven by domestic growth. It may continue
to rise in share of GDP, as spending on services rises faster than one-for-one with income. That
is compatible with a falling share of agriculture in GDP. However, export markets are unlikely to
provide as much leverage as in the past, and little room exists for policy change to unleash a new
24Can “Make in India” Make Jobs?
wave of growth. Service sector growth is less likely to significantly exceed overall economic
growth. In this sense, the Indian service sector will look less like an outlier unless manufacturing
growth continues to underperform.
Manufacturing
The core policy debate on job growth in India centers on the potential of manufacturing to
provide large-scale quality jobs. The argument begins back with Simon Kuznets and the fact that
every developed country went through a period when manufacturing dominated output and
employment. In the last century manufacturing-led growth in Japan, South Korea, and Taiwan
was characterized by high investment ratios, small public sectors, export orientation, labor
market competition, and government intervention in economic matters.47 No other path to a
fully developed economy has been blazed, and those currently making the best progress, like
China, are following the same route.
Despite the fact that only one well-worn path exists, India sits so far off the path that it can be
difficult to imagine how it can reach it. Economies with a dominant service sector have not seen
manufacturing return to dominance. Further obscuring the vision of a manufacturing-led path
for India is the common mistake of examining India’s whole manufacturing sector, rather than
limiting the analysis to the formal sector. Since the inception of the Industrial Revolution,
competitiveness in manufacturing has meant scale, both in size and sophistication of firms.
India’s informal manufacturing sector holds little promise for the kind of rapid growth needed
for structural transformation. But as argued in Section 3, omitting informal firms from the
calculation completely changes the picture.
The strongest argument in favor of pursuing the manufacturing path is India’s labor force. Most
the economies that relied on manufacturing for development began with relatively poorly
educated, predominantly agricultural workforces. They started by developing labor-intensive
industries like textiles, toy making, and low-end electronics assembly, which capitalize on the
large, cheap, low-skill labor force.
25Can “Make in India” Make Jobs?
Indeed, India’s labor force appears well-suited to manufacturing employment at the bottom of
the value chain. About 33 percent of the labor force has no education, and therefore probably
remains unemployable for factory work. This proportion is expected to decline over time. On the
other hand, those with primary and secondary education—the prime labor pool for
manufacturing—should remain about 60 percent of the labor force for the foreseeable future
(Figure 9).
To capitalize on a labor force primed for large-scale, low-value chain manufacturing, labor-
intensive manufacturing will need to become much more competitive than it stands today.
Manufacturers will need to build large-scale operations tied into global supply chains.
Two major types of constraints face the formal manufacturing sector. The first is the policy
environment. As noted in Section 3, formal manufacturing is significantly more exposed to
adverse policies than the modern service sector. Further, it is much more reliant on the
government delivery of public goods like infrastructure. Presumably, removing these obstacles
could facilitate vigorous growth (see Box 2).
Box 2. Case Study: The Beneficial Impact of Removing Production Restrictions
Plenty of academic evidence indicates that measures like removing labor market
restrictions or improving infrastructure quality help firms grow faster.48 One study in
particular illustrates not just faster growth, but what that growth may look like for the
structure of industry.
Since the 1960s India has “reserved” certain products for small-scale industries by
restricting their production to firms below a certain asset size. Researchers Leslie
Martin, Shanti Nataraj, and Ann Harrison measure the impact of removing reservations
for different products between 1997 and 2007.49 They found that rather than allowing
…
26Can “Make in India” Make Jobs?
small-scale industries to grow, larger firms expanded in their place to produce those
goods and drove out the inefficient small-scale industries. But instead of a tale of woe,
the research found that districts more exposed to de-reservation experienced higher
employment and wage growth.
The survey data used in much of this paper would likely classify small-scale firms as part
of informal manufacturing. Interpreting the study the language used here, workers
benefited when reform allowed high-productivity formal-sector manufacturers to
replace low-growth, low-productivity informal firms.
Does this mean existing garment manufacturers, for instance, will vanish? Most
reservations for garment manufacturing have been removed. Despite operating at a
small, relatively inefficient scale, they compete in a global marketplace just like large
firms do. They thrive because they have found a niche in small-batch garments
requiring handwork like embroidery that is not easily done on a mechanized assembly
line.
There is no intrinsic reason domestic large-scale garment factories would pose any
greater threat to them than large operations in other countries. Rather, improvements in
the business climate—like fewer regulatory hassles or better infrastructure—would only
improve their advantage against direct competitors in other countries.
The second constraint is the adverse environment for new entrants to the global manufacturing
supply chain. Many observers argue the window for serious manufacturing growth in India has
closed for several reasons.
• One large advantage that competitors who have already established significant market
share enjoy over India is a highly favorable capital-labor ratio. The large amount of
capital investment East Asia received was a leading factor in its development of
27Can “Make in India” Make Jobs?
manufacturing. It has also accumulated years of invaluable experience India cannot so
easily replicate. Countries such as South Korea (40 years of manufacturing experience)
and China (25 years) have refined their processes in order to deliver a quality product at a
competitive price.50 Skeptics argue India would require a major shift in the amount of
FDI flowing into manufacturing to acquire both the capital and know-how to jump-start
a large export industry.
• Another advantage for established exporters is global supply chains, though the
arguments run in both directions. On one hand, some argue today’s exporters are already
well integrated in a way that makes new entry difficult. On the other hand, global supply
chains make manufacturers more nimble, able to shift operations quickly to the next
market to offer rock-bottom wages. Hence, in the absence of rapid development of
infrastructure and skills, manufacturing will prove fickle and fleeting.
• There is concern that the success of the service sector will impede the competitiveness of
manufacturing. For instance, Raguram Rajan and Arvind Subramanian (incidentally, now
both senior Indian government officials) worried back in 2006 that wages for skilled
workers have been driven too high.51 Nicknaming the phenomenon the “Bangalore Bug,”
they argued manufacturers cannot compete in low-skill industries with razor-thin
margins if they must pay high wages for their senior employees.
• Finally, manufacturing may no longer be the global growth engine it once was. Services
have been growing, not just as a share of global GDP, but also as a share of trade.52
These skeptics of the Indian manufacturing takeoff essentially argue that the gains from pursuing
greater manufacturing will not be as great as hoped. Fortunately, there are good reasons to
believe they can be overcome.
First, the basic premise of a manufacturing-led growth strategy is removing constraints to the
point that labor-intensive manufacturing becomes competitive. With the large, low-wage semi-
skilled labor force at hand, presumably that is not impossible. Once competitive, investment,
both foreign and domestic, should follow. Vietnam and Bangalore have recently succeeded on
exactly that basis.
28Can “Make in India” Make Jobs?
The flexibility of supply chains works in India’s favor as a new entrant. It must start off as the
low-wage leader to steal market share. As Chinese manufacturing becomes more expensive, firms
are looking for new, cheap labor forces.
Perhaps most importantly, India possesses an advantage that no other country besides China can
compete with: its potentially massive domestic market. Shifting operations to India not only
allows access to its labor force, but also provides a privileged position from which to access the
domestic market. For instance, the attractiveness of servicing the domestic auto market is a large
reason why many auto parts firms operate (capital-intensive) export-oriented operations from
India despite a difficult business climate. This bonus will help India cross cost thresholds more
easily, potentially overcoming other disadvantages like the Bangalore Bug.
Overall, improvements in the business climate through improved infrastructure development and
regulatory reform could dramatically change the viability of large-scale low-value manufacturing.
Hence, formal manufacturing could see a sharp rise in both output and employment growth. As
seen above, however, this is starting from a tiny base. Is it conceivable that formal manufacturing
could grow fast enough to provide meaningful help to India’s jobs problem? The next section
attempts to answer this question by simulating forecasts of several scenarios.
5. Simulations
The sector with the most potential to provide quality jobs in the future—formal sector
manufacturing—employs relatively few workers. The same is true for the next best option,
modern services. Even if a wave of reform unleashes the full growth potential for formal-sector
manufacturing, will that help India supply enough jobs for its workers? Can a large enough share
of workers expand in high-productivity sectors to push India up the ladder of development? The
answers to these questions are critical for helping Indian policymakers set realistic goals and
choose between competing policy priorities.
29Can “Make in India” Make Jobs?
A simulation can attempt to frame an answer by making simple assumptions about the future
evolution of the economy. The simulation presented here starts with a set of basic output growth
rates. It maintains a fixed relationship between output growth and employment growth to yield
employment growth. Beyond these two critical items, the simulation provides a glimpse at how
output and employment might be divided between sectors, as well as the impact of that division
on productivity growth.53
The first assumption to make regards output growth in each sector. As argued in the section
above, the formal manufacturing sector stands to gain more than others if appropriate policy
changes occur. Hence, it is reasonable to assume that output growth in that sector would rise
above its average since 1994 of 8.7 percent.
To guess at what might be possible, India can look at other Asian economies that experienced a
20-year boom in manufacturing growth (see Table 1). The historical experience helps provide
context to gauge the simulation results. For comparison, the table includes the Indian experience
of the past 20 years, although no significant boom occurred.
The growth rates and share of GDP reflect the entire manufacturing sector, not just the formal
sector, for which data are unavailable outside India. Korea initiated its boom with manufacturing
holding a very low share of GDP. It may therefore have had a much smaller informal
manufacturing sector than the other countries, making it a better model for predicting India’s
formal manufacturing sector. China has the strongest match with the story of a major wave of
reform opening new sectors to export-oriented growth. Malaysia and Thailand have more recent
experience with expanding manufacturing. Hence, there are reasons why each country’s
experience might be relevant for India.
30Can “Make in India” Make Jobs?
Table 1. Manufacturing Sector Performance, Selected Asian Nations
Annualized Growth Rate Share of GDP
(percent) (percentage points)
Start 10-year 20-year Initial 10-year 20-year
year rate rate share change change
Korea 1963 19 16 4 7 15
China 1978 11 13 20 2 15
Indonesia 1978 11 10 13 10 13
Malaysia 1985 13 10 15 10 13
Thailand 1985 13 9 21 8 15
India 1994 10 8 15 1 0
Note: As in the rest of the paper, growth rates in the table are compound annual growth rates.
Source: Marcel P. Timmer, Gaaitzen de Vries, and Klaas de Vries, Patterns of Structural Change in Developing
Countries, GGDC Research Memorandum (University of Groningen, July 2014),
http://www.ggdc.net/publications/ memorandum/gd149.pdf; Indian National Accounts data.
Notably, these countries sustained double-digit growth rates across 20 years. Other sectors in
these economies did not grow so fast (although services grew as fast in China as in India),
allowing manufacturing to pick up 13-15 percent of GDP across that period.
Scenario 1: National Manufacturing Policy
Scenario 1 focuses on the goal set forth by the Make in India campaign.54 This policy seeks to
raise manufacturing (formal and informal) to 25 percent of GDP and to create 100 million
manufacturing jobs by 2022.
The scenario begins by assuming that every sector except formal-sector manufacturing grows at
the same rate that it did from 1994 to 2012 (See Table A1 in the Appendix for details).55 Several
sectors might be expected to grow slower than their historical growth pattern. Informal
manufacturing may do so because it will face stronger competition from formal manufacturing,
and modern services may do so for the reasons elaborated in the previous section, such as slowing
export potential. However, both would benefit from greater domestic demand if formal
31Can “Make in India” Make Jobs?
manufacturing accelerates. Without a strong reason to expect the positive or negative factors to
dominate, the simulations maintain the historical pattern.56
By running these growth rates forward until 2022, the simulation produces GDP for every sector
except formal-sector manufacturing. Then it is simple to back out the growth rate for formal-
sector manufacturing necessary to meet the goal of a 25 percent share of GDP. Therefore,
Scenario 1 attempts to answer how fast formal manufacturing must grow to hit the Make in
India goal.
The scenario also produces employment figures assuming historical relationships between output
and employment. The one exception is formal manufacturing. The scenario assumes the high
level of manufacturing growth comes from reforms that unlock growth. Accordingly, reform is
assumed to help labor-intensive industries more than existing capital-intensive ones, causing
manufacturing growth to boost its employment-generating capacity.
Under the assumptions of the simulation, the manufacturing sector reaches 25 percent of GDP
by 2022 if the formal side of the manufacturing sector grows 21 percent per year (Table A2 in
the Appendix). That means the total manufacturing sector must grow at 18 percent per year.
Clearly this exceeds the growth experience of the set of manufacturing booms in Asia and the
Make in India manufacturing growth target of 12–14 percent. It may therefore not be realistic.
In addition, employment does not come close to the goal of 100 million new manufacturing jobs,
reaching only 26 million.
The source of the Make in India campaign targets, the National Manufacturing Policy of 2011,
allowed India 11 years to reach them. Since the boom has yet to begin, it might be sensible to
reset the clock to allow 11 years from 2014 for India to achieve the goals. The next scenario
presents a second simulation with the timetable revised accordingly.
In this case, formal manufacturing can push the total manufacturing share of GDP to 25 percent
by maintaining an average growth rate of 19 percent until 2025 (Table A3 in the Appendix).
32Can “Make in India” Make Jobs?
Korea achieved a 19 percent growth rate in the first 10 years of its boom, so this rate lies within
historical experience. However, manufacturing employment growth is only 38 million additional
jobs, so the employment goal remains a distant dream. Further, this scenario requires India’s
aggregate economy to grow at 11 percent per year, which exceeds even China’s exceptional
experience.
The conclusion of this simulation is that the Make in India goals—remaining silent for the
moment about how to achieve them—appear unrealistic. Even if the timetable is reset to be
achieved 11 years from now, the Make in India output goals push the boundaries of plausibility.
The employment goals are utterly beyond reach. Further, it would require manufacturing growth
to jump within the next year. It remains to be seen how such a large acceleration can be initiated
so rapidly.
Scenario 2: Comparison to No Reform
Another approach is to simulate a reasonable scenario for how the economy would evolve
without significant reforms. Comparing this to a reasonable reform scenario helps illustrate the
potential impact of reforms that promote a successful labor-intensive formal manufacturing
sector.
The starting point for a no-reform scenario is aggregate growth. IMF researchers estimate that
potential growth for the Indian economy in recent years lies in the 6–7 percent range. That is,
the economy can continue to grow at that rate under current conditions without provoking
higher inflation rates. The no-reform scenario therefore assumes the Indian economy will follow
the central value of 6.5 percent growth for the next 20 years.
To identify how that breaks down across sectors, the scenario assumes each sector will grow in
proportion to the 20-year historical rates (Table A1), but scaled down to match the new
aggregate growth rate.57 The no-reform scenario also maintains the historical relationships
between output and employment for all sectors, including formal manufacturing. Agriculture is
33You can also read


