CASE STUDIES
FROM INTEGRATING
   RENEWABLES
  INTO THE GRID
←
→
Page content transcription
If your browser does not render page correctly, please read the page content below
CASE STUDIES FROM INTEGRATING RENEWABLES INTO THE GRID
Acknowledgement

The development of this guideline was funded through the Sustainable Energy Industry Development
Project (SEIDP). The World Bank through Scaling Up Renewable Energy for Low-Income Countries
(SREP) and the Small Island Developing States (SIDSDOCK) have each provided funding to the PPA
as the Project Implementation Agency for the SEIDP. The guidelines have been developed by Global
Sustainable Energy Solutions with the support of Te Aponga Uira (TAU), Electric Power Corporation
(EPC) and Tonga Power Limited (TPL), and reviewed by PPA and SEIAPI Technical Committees.

  These guidelines have been developed for The Pacific Power Association (PPA) and the Sustainable
                      Energy Industry Association of the Pacific Islands (SEIAPI).

              They represent the latest industry practices for utilities in the Pacific Islands.

                                             © Copyright 2020

 While all care has been taken to ensure this guideline is free from omission and error, no responsibility
             can be taken for the use of this information in other renewable energy systems.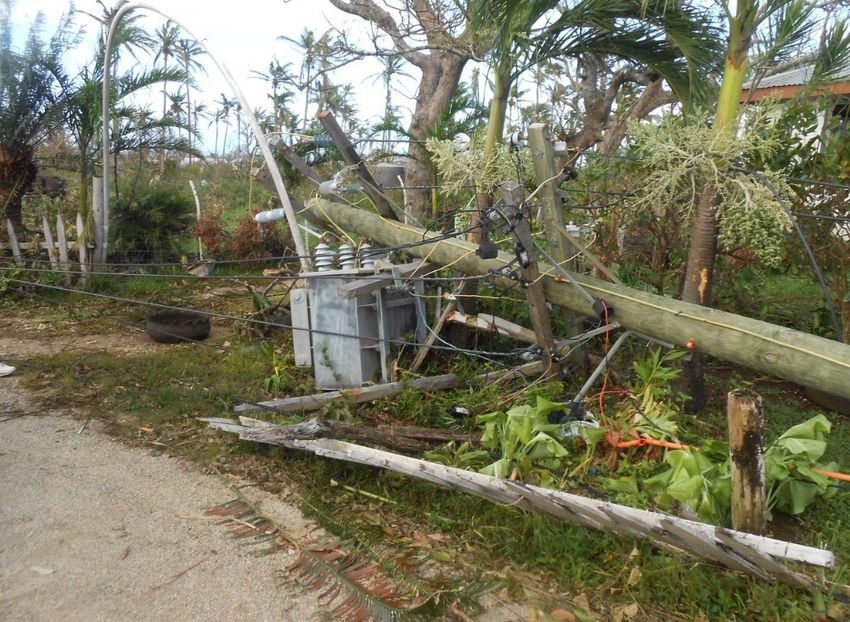
Table of Contents

1. Introduction........................................................................................................................................................................... 1

     1.1 Cook Islands........................................................................................................................................................ 1

     1.2 Samoa................................................................................................................................................................... 2

     1.3 Tonga..................................................................................................................................................................... 4

2. Case Study 1: Cook Islands..............................................................................................................................................6

     2.1 Grid Configuration and Existing Generation Capacity.............................................................................. 6

             2.1.1 Diesel Generators................................................................................................................................... 7

             2.1.2 PV Systems.............................................................................................................................................. 7

             2.1.3 BESS........................................................................................................................................................ 10

             2.1.4 Independent Power Producers (IPPs)............................................................................................. 11

     2.2 Lessons Learnt..................................................................................................................................................12
             2.2.1 Equipment Quality and Regulation.................................................................................................. 12

             2.2.2 Geographical Location........................................................................................................................ 12

             2.2.3 Personnel Training............................................................................................................................... 12

             2.2.4 Community Engagement.................................................................................................................... 13

     2.3 Operational Changes.......................................................................................................................................14

             2.3.1 Generation Dispatch Information..................................................................................................... 14

             2.3.2 Diesel Generator Controls.................................................................................................................. 14

             2.3.3 Spinning Reserve Methodology....................................................................................................... 14

             2.3.4 Tariff Structure...................................................................................................................................... 15

     2.4 Future Targets and Proposed Generation Capacity................................................................................15
3. Case Study 2: Samoa.............................................................................................................................................. 16

     3.1 Grid Configuration and Existing Generation Capacity............................................................................16

             3.1.1 Diesel Generators................................................................................................................................. 18

             3.1.2 Hydro Generators................................................................................................................................. 19

             3.1.3 PV Systems............................................................................................................................................ 20

             3.1.4 Wind Generators.................................................................................................................................. 22

             3.1.5 Biomass.................................................................................................................................................. 22

             3.1.6 BESS........................................................................................................................................................ 23

             3.1.7 Independent Power Producers (IPPs)............................................................................................. 24

     3.2 Lessons Learnt..................................................................................................................................................24

             3.2.1 Equipment Quality and Regulation.................................................................................................. 24

             3.2.2 Geographical Location........................................................................................................................ 24

             3.2.3 Personnel Training............................................................................................................................... 25

             3.2.4 Community Engagement.................................................................................................................... 26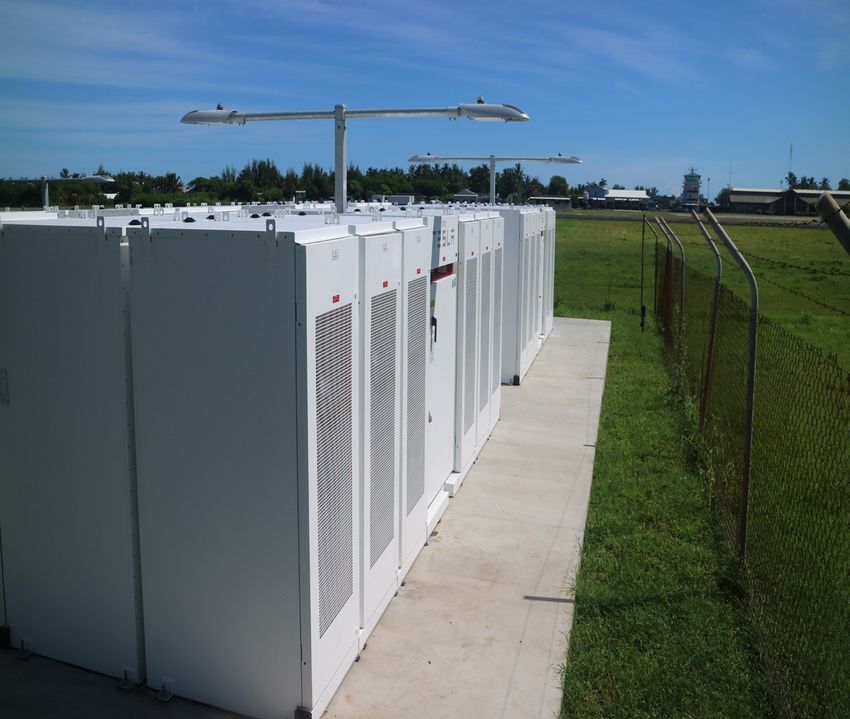
3.3 Operational Changes.......................................................................................................................................26

            3.3.1 Generation Dispatch Information..................................................................................................... 26

            3.3.2 Diesel Generator Controls.................................................................................................................. 27

            3.3.3 Spinning Reserve Methodology....................................................................................................... 27

            3.3.4 Tariff Structure...................................................................................................................................... 28

    3.4 Future Targets and Proposed Generation Capacity................................................................................29

4. Case Study 3: Tonga............................................................................................................................................... 30

    4.1 Grid Configuration and Existing Generation Capacity............................................................................30

            4.1.1 Diesel Generators................................................................................................................................. 32

            4.1.2 PV Systems............................................................................................................................................ 33

            4.1.3 Wind Generators.................................................................................................................................. 35

            4.1.4 Biomass.................................................................................................................................................. 36

            4.1.5 BESS........................................................................................................................................................ 36

            4.1.6 Independent Power Producers (IPPs)............................................................................................. 39

    4.2 Lessons Learnt..................................................................................................................................................39

            4.2.1 Geographical Location........................................................................................................................ 39

            4.2.2 Common Faults..................................................................................................................................... 40

            4.2.3 Personnel Training............................................................................................................................... 41

            4.2.4 Community Engagement.................................................................................................................... 41

    4.3 Operational Changes.......................................................................................................................................42

            4.3.1 Generation Dispatch Information..................................................................................................... 42

            4.3.2 Diesel Generator Controls.................................................................................................................. 44

            4.3.3 Spinning Reserve Methodology....................................................................................................... 45

            4.3.4 Tariff Structure...................................................................................................................................... 45

    4.4 Future Targets and Proposed Generation Capacity................................................................................46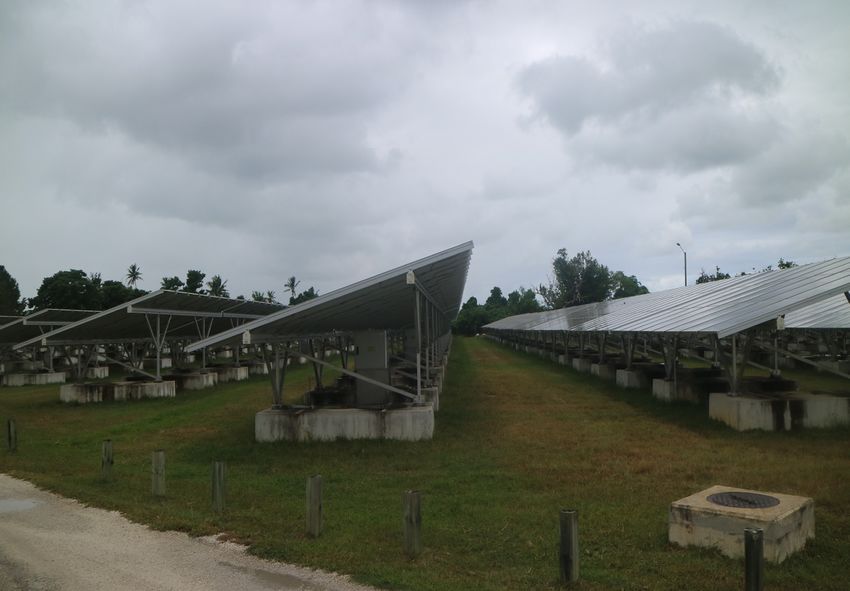
List of Figures

Figure 1: Map of Cook Islands.................................................................................................................................... 1

Figure 2: Map of Samoa............................................................................................................................................... 2

Figure 3: Location of Generation Assets - Upolo Island...................................................................................... 3

Figure 4: Map of Tonga................................................................................................................................................. 4

Figure 5: Tonga Renewable Energy Project (TREP))............................................................................................ 5

Figure 6: Rarotonga 11kV SLD.................................................................................................................................. 6

Figure 7: TAU PV Systems.......................................................................................................................................... 8

Figure 8: Map of Solar Locations in Rarotonga...................................................................................................... 9

Figure 9: TAU EV Charging Station......................................................................................................................... 10

Figure 10: Rarotonga BESS Project Airport South............................................................................................. 11

Figure 11: Upolo Network SLD................................................................................................................................ 16
Figure 12: Generation Capacity of Samoa............................................................................................................ 17

Figure 13: Production FY 2018/2019..................................................................................................................... 18

Figure 14: Apolima Solar Array................................................................................................................................ 20

Figure 15: Vaiete Solar Array.................................................................................................................................... 21

Figure 16: BESS at Fiaga Power Station............................................................................................................... 23

Figure 17: Tongatapu SLD (Satellite View)........................................................................................................... 30

Figure 18: Tonga Electricity Consumption 2017/18 vs. 2018/19................................................................... 31

Figure 19: Portfolio of Energy Generation (%) from 2018/19 FY................................................................... 31

Figure 20: Renewable Generation 2017/18 vs. 2018/19................................................................................. 32

Figure 21: Maama Mai Solar Plant.......................................................................................................................... 34
Figure 22: li'o Manumataonga Wind Farm............................................................................................................ 36

Figure 23: 0.5 MW BESS at Popua Power Station............................................................................................. 38

Figure 24: Damage Caused by Cyclone Ian.......................................................................................................... 40

Figure 25: Nuku’alofa Network Upgrade Project................................................................................................. 41

Figure 26: January Daily Load Curves.................................................................................................................... 42
List of Tables

Table 1: Cook Islands Diesel Generation Capacity.................................................................................................7

Table 2: Cook Islands Renewable Energy Sector Project PV Systems.............................................................8

Table 3: Cook Islands Renewable Energy Sector Project BESS....................................................................... 10

Table 4: Electricity Production by Island/Source.................................................................................................. 17

Table 5: Samoa Diesel Generators........................................................................................................................... 18

Table 6: Samoa Hydro Generators........................................................................................................................... 19

Table 7: PV Systems in Upolu and Savai’i............................................................................................................. 21

Table 8: Samoa Wind Generators........................................................................................................................... 22

Table 9: Upolo Spinning Reserve Requirement.................................................................................................... 27

Table 10: Daily Fixed Charge and Variable Rate for 100 Largest Customers.............................................. 28

Table 11: Network Cable Lengths........................................................................................................................... 30
Table 12: Tonga Diesel Generation Capacity........................................................................................................ 32

Table 13: Tonga PV Systems.................................................................................................................................... 33

Table 14: Tonga Wind Generators........................................................................................................................... 35

Table 15: Tonga BESS................................................................................................................................................. 37

Table 16: Tonga IPPs................................................................................................................................................... 39

Table 17: Frequency Ranges..................................................................................................................................... 44

Table 18: Allowed Voltage Variations..................................................................................................................... 44
List of Abbreviations

A summary of the main acronyms and terms used in this document is listed below:

ADB		         Asian Development Bank
BESS		        Battery Energy Storage System
CBD		         Central Business District
CIREC		       Cook Islands Renewable Electricity Chart
EPC		         Electric Power Corporation
EU		          European Union
FY		          Fiscal Year
GCF		         Green Climate Fund
GWh		         Gigawatt hour
IPP		         Independent Power Producer
JICA		        Japan International Cooperation Agency
km		          kilometre
kW		          kilowatt
kWp		         kilowatt-peak
m		           meter
MFAT		        Ministry of Foreign Affairs and Trade (New Zealand)
MW		          Megawatt
NA		          Not Applicable
NSDP		        National Sustainability Development Plan
O&M		         Operation & Maintenance
OIREP		       Outer Island Renewable Energy Project (Tonga)
PPA		         Power Purchase Agreement
PSEP		        Power Sector Expansion Project (Samoa)
PV		          Photovoltaic
RE		          Renewable Energy
SCADA		       Supervisory Control and Data Acquisition
SESP		        Samoa Energy Sector Plan
SHS		         Solar Home System
SLD		         Single Line Diagram
TAU		         Te Aponga Uira
TBC		         To Be Confirmed
TERM		        Tonga Energy Road Map
TOP		         Tongan Pa'anga
TPL		         Tonga Power Limited
UNDP		        United Nations Development Programme
Currency Equivalents

(As of 23 June 2020)

Currency units:

United States dollar/s (US$),

New Zealand dollar/s (NZ$),

Samoan tala (WS$),

Tongan pa’anga (T$)

US$1 = NZ$1.55

NZ$1 = US$0.65

US$1 = WS$2.67

WS$1 = US$0.37

US$1 = T$2.27

T$1 = US$0.44
1. Introduction

1.1      Cook Islands
The Cook Islands is located in the South Pacific Ocean northeast of New Zealand, covering a land area
of 240 km² and a population of 19,000. The archipelago is comprised of 15 islands, 12 of which are
inhabited, divided into two distinct groups: the Northern Group and the Southern Group (Figure 1).
Rarotonga, the largest island and located in the Southern group, contains the capital city Avarua and
over 70% of the resident population.

                Figure 1: Map of Cook Islands (Source: Central Intelligence Agency World Factbook)

Approximately 90% of electricity demand is on Rarotonga, the most visited island with a large tourism
industry, whilst the remaining 10% is divided between the smaller outer islands. Te Aponga Uira
(TAU), a government-owned power utility, is responsible for the generation, distribution and retailing of
electricity on Rarotonga. The power utility has two operating divisions, Generation and Network, with
a renewable energy (RE) unit forming a subunit of Network. In Aitutaki, the second most visited island,
the electricity supply is operated by Aitutaki Power Supply (APS), a part of the Aitutaki Island Council
administration. Other islands are managed by island councils or island administrations.

In 2012, approximately 99% of power generation in the Cook Islands was sourced from diesel, and
the corresponding fuel costs equated to $29.8 million, or 25% of the country’s total imports. With
electricity being generated from imported diesel fuel, the Cook Islands become vulnerable to the risks
of a fuel supply which is unreliable, problematic and expensive due to international oil price volatility.
To combat this, the Government established a Renewable Energy Development Division (REDD) in
2011 to manage the Cook Islands Renewable Electricity Chart (CIREC) implementation plan, a strategy
outlining the steps to achieve 50% electricity provided by RE by 2015, and 100% by 2020. The CIREC
is in alignment with the policy targets and metrics articulated in the National Sustainability Development
Plan (NSDP) to ensure access to affordable, reliable, sustainable and modern energy. The CIREC is being
implemented through the Cook Islands Renewable Energy Sector Project (CIRESP), established in 2014
and co-financed by the ADB and various donors. A priority was placed on the outer islands as they
are more isolated, and with the exception of Rarotonga which is more complex due to the significantly
larger electricity demand, the electricity needs of all inhabited islands are now met by renewable
sources. The contribution from distributed renewable generation in Rarotonga has steadily increased
to the current grid limit of 16%, and TAU aims to increase renewable energy contribution to 70% of its
customer demand by 2020/21. The shift in Government policy towards renewable energy has so far

1 | Case Studies from Integrating Renewables into the Grid
been a success, reducing the precarious reliance on importing diesel for electricity generation, increasing
efficiency both in electricity supply and use, improving access, reducing environmental impacts and
enhancing energy security, while ensuring the sector remains financially viable in the long term.

1.2     Samoa

Samoa, officially the Independent State of Samoa and until 1997 known as Western Samoa, is located in
the Pacific Ocean between Fiji and French Polynesia covering a land area of 2,842km2 and a population
of over 197,000. Samoa, which shares the Samoan archipelago with American Samoa, consists of nine
islands, four of which are inhabited. The two largest and most populated of these inhabited islands are
Savai’i and Upolu, followed by Manono and Apolima which are situated in the strait between the two
main islands (Figure 2). Upolu is the main island, second largest in size, and contains the capital city
Apia.

                Figure 2: Map of Samoa (Source: Central Intelligence Agency World Factbook)

Electric Power Corporation (EPC) is an autonomous government owned corporation responsible for the
generation, transmission, distribution, and selling of electricity in Samoa since its establishment in 1972.
EPC plays a crucial role in the development of Samoa’s economy and operates under the energy sector
alongside other government bodies, striving to provide efficient, affordable and reliable electricity supply
in order to achieve the sector goal of a sustainable energy supply. EPC began by supplying electricity
exclusively to the Apia township on Upolu, however they now provide power to 98% of the population
of Samoa. A renewable energy (RE) unit was set up in 2007 to manage and develop projects associated
with RE activities such as wind, solar, hydro and bio-energy. This includes initiating high-quality
research and analysis and providing actual project implementation support to increase Samoa’s use of
environmentally friendly renewable sources of energy, and reduce reliance on imported fuels.

While Samoa has a negligible impact on climate change, it is likely they will be greatly affected by
the consequences in the future. Further, the global financial crisis (GFC) of 2008/09 highlighted their
vulnerability to fuel prices as electricity prices dramatically increased in response to foreign markets.
Samoa is therefore taking a proactive approach to increase its renewable energy generation and reduce
its greenhouse gas emissions. The Government announced a commitment to achieve a 100% renewable
energy contribution target for electricity generation by 2025, in line with the previous Samoa Energy
Sector Plan (SESP) vision of “improved quality of life for all” in 2012-2016, and updated vision of
“sustainable and affordable energy for all” for 2017-2022.

                                                             Case Studies from Integrating Renewables into the Grid | 2
Structural reforms included the establishment of the Energy Division within the Ministry of Finance
whose focus is on the coordination of the implementation of the SESP. EPC’s RE unit was responsible
for the Samoa Power Sector Expansion Project (PSEP) from 2008 to 2016 to implement various
improvements such as improving the supply of electricity, construction of a new power station to
increase generating capacity to meet growing demand, increasing capacity of transmission and
distribution power lines, and a new Supervisory Control And Data Acquisition (SCADA) system. In
addition, there are a growing number of RE projects approved to be undertaken under the support
of Government with development partners cooperation (Figure 3), as well as investments by the
private sector through Power Purchasing Agreements (PPAs). In 2014, EPC secured grant funding
for the Renewable Energy Development and Power Sector Rehabilitation Project, which involved
the rehabilitation of three hydro stations that sustained the most damage during the flooding of
Cyclone Evan in 2012, and the construction of three new hydro power stations. The Island Resilience
Partnership (IRP) and GridMarket are supporting Samoa as energy advocates and advisors, to assist in
their accelerated transition to renewable energy and resilient infrastructure. Additionally, the Improving
the Performance and Reliability of RE Power System in Samoa (IMPRESS) project was introduced in
2017 to improve sustainable and cost-effective utilisation of indigenous renewable energy resources for
energy production in Samoa over a five-year period. Overall, these projects are designed to ensure the
future supply of electricity and provide for the expected growth in demand.
Figure 3: Location of Generation Assets - Upolo Island (Source: EPC)
3 | Case Studies from Integrating Renewables into the Grid1.3 Tonga
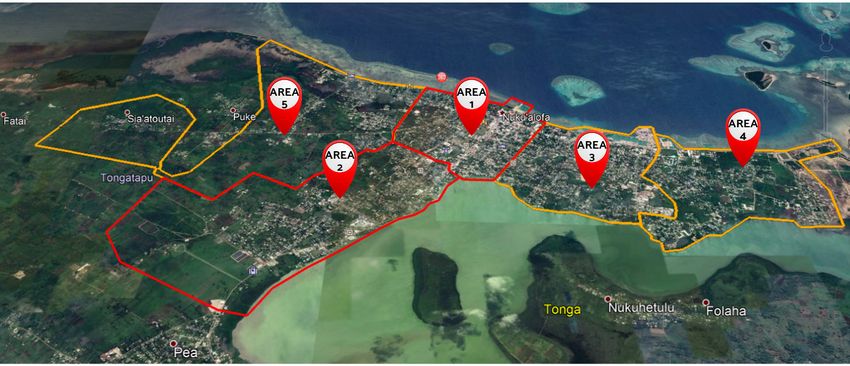
Tonga is a unique Polynesian Kingdom in the Pacific Ocean between Hawaii and New Zealand, covering
a land area of 747km2 and a population of 105,525. The archipelago is comprised of over 170 islands
and made up of four major island groups: Tongatapu group in the south, Ha’apai group in the middle,
and Vava’u and Niuas groups in the north (Figure 4). Tongatapu is the main island, largest in size and
containing the capital city Nuku’alofa.
Figure 4: Map of Tonga
36 of the islands are inhabited and excluding Tongatapu, are all relatively small in terms of population
and electricity consumption. Tonga’s electricity sector was re-structured in 2008 when the Government
established the Electricity Commission (EC) through the Electricity Act 2007, and purchased the
electricity assets from a privately owned entity. Tonga Power Limited (TPL) operates under a strict
regulatory framework through the Electricity Concession Contract (ECC) in which tariffs, operational
efficiency benchmarks, consumer service standards and penalties are specified between the EC, the
Government and TPL. TPL’s core business is generating, distributing and retailing electric power to more
than 24,000 customers across a four-grid system within Tongatapu, Ha’apai, Vava’u and ‘Eua. The major
objectives of TPL are to provide a safe, reliable, affordable and sustainable electricity supply throughout
Tonga, maximize shareholder value while maintaining prudent levels of exposure to operational and
financial risks, and ensure sustained downward pressure on electricity tariffs. In the other smaller
islands, electricity is obtained through diesel generation or small/medium solar home systems.
In 2009, the Government of Tonga approved a goal of 50% of electricity to be generated from
renewable energy sources by 2020. The overarching government strategy to reach this goal is the
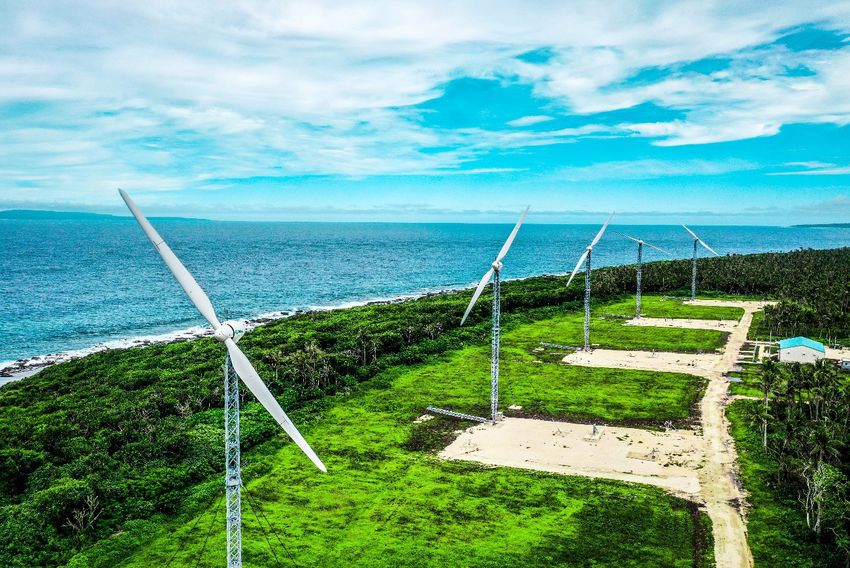
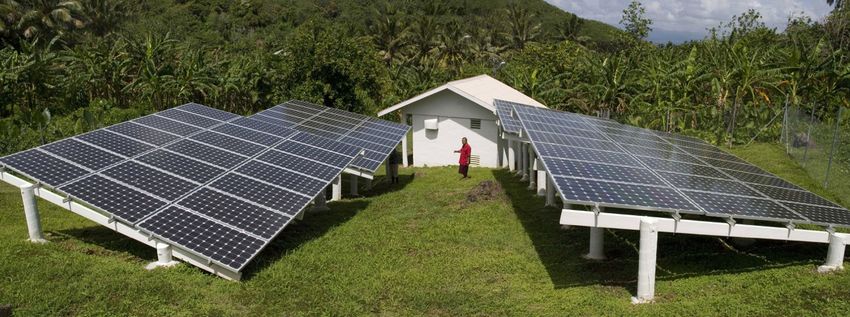
Tonga Energy Road Map (TERM), under which several projects including the Tonga Renewable Energy
Project (TREP) (Figure 5) and the Outer Island Renewable Energy Project (OIREP) have been developed
and funded. The TERM for 2010-2020 outlines the improvements required to reach the government’s
2020 50% target, and covers petroleum supply chain initiatives and renewable energy projects. There
have also been important energy efficiency, network upgrade and network resilience initiatives under
TERM such as the Tonga Village Network Upgrade Project (TVNUP), Nuku’alofa Network Upgrade
Project (NNUP), Outer Islands Energy Efficiency Project (OIEEP) and Cyclone Ian Recovery Project
(CIRP), without which the networks would be highly unreliable and a significant barrier to incorporating
renewable energy.
Case Studies from Integrating Renewables into the Grid | 4The TREP is a central and pivotal component of the TERM, and the Government of Tonga has
established a high-level taskforce to implement TERM chaired by the Prime Minister. The TREP aims
to help Tonga move away from fossil fuels and shift to renewables. The project will deliver utility-scale
storage systems to provide base load response and grid stability, paving the way for more renewable
energy integration in the main island, while green mini-grids will be installed in the outer islands. While
stabilising the grid, this project will particularly address the intermittency of variable renewable energy
sources, thus laying the foundation for private sector investments in renewable energy in Tonga. The
main objectives of the OIREP are to help reduce the Kingdom’s heavy reliance on imported fossil fuels
for power generation while also increasing electricity accessibility for new users. For the twelve-month
period of July 2018 – June 2019, fuel saving from renewable energy was approximately 1.6 million litres,
equivalent to T$3,442,043 in cost savings passed directly to consumers.
Figure 5: Tonga Renewable Energy Project (TREP)
5 | Case Studies from Integrating Renewables into the Grid2. Case Study 1: Cook Islands
2.1 Grid Configuration and Existing Generation Capacity
All inhabited islands in the Cook Islands currently have centralised power supplies, providing single-
phase (230V) or three-phase (415V) through a distribution grid to most residential and commercial and
industrial customers.
TAU’s customer base of almost 6,000 customers is serviced by over 290 km of cabling across the grid
network and 80 substations. Distributed renewable generators are scattered throughout the distribution
network and contributes to overall generation. In June 2017, there was a total 3.6MW of distributed
grid-connected solar photovoltaic (PV) generators around the island, consisting of a mix of TAU-owned
and private-owned facilities. The average peak load is 5.1MW and an annual consumption of 28GWh.
TAU anticipates load growth averaging 1.4% annually over the medium term.
Rarotonga has an 11 kilovolt (kV) network divided into 6 high voltage (HV) feeders (Figure 6):
• West Coast Feeder (WCF);
• Seaport Feeder (SF);
• Avarua City Center Feeder (ACCF);
• Airport Feeder (AIRF);
• Cross Line Feeder (CLF); and
• East Coast Feeder (ECF).
The distribution network comprises 90km of 11kV underground cables and 200km of 415V low voltage distri-
bution lines.
Figure 6: Rarotonga 11kV SLD
Case Studies from Integrating Renewables into the Grid | 62.1.1 Diesel Generators
TAU currently has 7 diesel generators in operation at the Avatiu Power Station in Rarotonga, with a
combined installed capacity of approximately 12.3MW. Five of the generators, each with a capacity
rating of 1.6MW, were installed in 2016. They have fast responding engines, which are necessary
to provide base load, spinning reserve, and maintain overall system stability with the integration of
highly intermittent PV and wind generation. These generators are also fitted with computerised engine
management systems, which further improve the capability to work with the PV systems and the
existing engines.
Table 1: Cook Islands Diesel Generation Capacity
Number Installed Total Capacity (MW)
5 8
1 2.7
1 0.6
Biofuel is considered a potential diesel substitute and will be tested by TAU to determine if it is a
commercially viable option to increase RE contributions further. Engine-driven generators will always
be required as backup even for a 100% renewable grid, however if the engines can be run on biofuel,
they will be ‘renewable’ as well. TAU intends to test the market in terms of supply availability, delivery
systems, pricing and feasibility.
Although all inhabited islands, excluding Rarotonga, have achieved at least 95% of their electricity
being supplied by PV-battery hybrid mini-grid systems, diesel generator backup systems are still in
place to guarantee energy security. These systems were installed in the six Northern Group islands
(Manihiki, Nassau, Palmerston, Penhryn, Pukapuka and Rakahunga) in 2014/15 for the Northern Group
Renewable Energy Project, and five Southern Group islands (Atiu, Mitiaro, Mangaia, Mauke and Aitutaki)
in 2018/19 for the CIRESP. These systems are discussed further in section 2.1.2.
2.1.2 PV Systems
PV is currently installed across all twelve of the country’s inhabited islands, and is the primary
contributor to RE generation. Centralised PV-battery-diesel hybrid systems provide over 95% of the
electricity needs from renewable resources in the six Northern islands, as well as five of the Southern
islands.
The ‘Te Huira Natura Ki Te Pae Tokerau’, or Northern Group Renewable Energy Project, has provided
solar mini-grid systems to meet the electricity demand of the six Northern Group islands of Manihiki,
Nassau, Palmerston, Penhryn, Pukapuka, and Rakahunga to align with the CIREC. The project included
the delivery of eight mini-grid PV solar with battery storage and diesel backup systems, commissioned
in 2014/15, on the six islands, with a total output of 1.126MWh per annum. Each system is designed to
supply up to 95% of annual of the electricity needs for the villages they connect to and deliver power to
more than 230 homes and public buildings. Previously all the islands, with the exception of Pukapuka
which had its rooftop solar replaced with a solar diesel grid network, were reliant on old generators
and expensive imported diesel, and power was only provided at certain periods during the day. The
project was implemented by the New Zealand MFAT and involved the design, supply, construction
and installation of the solar arrays. All of the Northern group islands now have access to a continuous
reliable electricity supply supported by a diesel back-up system, which guarantees energy security.
In 2014, the CIRESP was established to build PV plants in the islands of the Southern Group,
implemented by the ADB in two phases. The first phase encompassed the outer islands of Atiu, Mitiaro,
Mangaia and Mauke converting from diesel power supply to PV–battery hybrid systems, operating at
95% renewable energy with diesel backup. These four islands have a combined installed capacity of
1,246kW PV systems (Table 2) and battery storage, further discussed in section 2.1.3. The subprojects
at Mitiaro and Mauke include new power stations and high-speed diesel backup generators whilst the
more modern existing diesel power stations on Mangaia and Atiu have been retained. The addition of
these four systems equates to an annual savings of approximately 360,000 litres of diesel and 960
tonnes of carbon dioxide emissions.
7 | Case Studies from Integrating Renewables into the GridTable 2:Cook Islands Renewable Energy Sector Project PV Systems
Island Year Installed Capacity
Mitiaro 2018 159kW
Mauke 2018 228kW
Mangaia 2018 477kW
Atiu 2018 413kW
Aitutaki 2019 1000kW
The second phase included initiatives on the remaining two islands, Aitutaki and Rarotonga, which are
more complex due to the larger populations and higher power demands. As such, the power systems
required upgrading to increase levels of renewable energy generation, and provide control systems and
battery storage technology to manage high levels of renewables. The subprojects resulted in the two
islands increasing their use of renewable energy to almost 25% by using fully integrated PV–battery–
diesel hybrid systems. In Aitutaki, an additional PV system was installed together with 300kW high
speed diesel generator, containerised battery energy storage system (BESS) and upgraded switchgear
and controls. The subproject for Rarotonga included the installation of BESS, further discussed in
section 2.1.3. The Renewable Energy Sector Project will result in a reduction in annual diesel usage of
approximately 1.26 million litres, reducing carbon dioxide emissions by approximately 2,793 tons per
year.
Rarotonga presently sustains over 450 individual RE generators plugged into the grid, driven by a
diesel-powered generation plant at Avatiu. TAU estimates it will require 18MW of PV in its mix of
generators in order to reach 70% RE contribution levels. Currently there is 3.6MW of PV installed,
consisting of 1.068MW net metered, 1.711MW Independent Power Producers (IPPs) and 862kW
TAU owned (Figure 7).
Figure 7: TAU PV Systems
Case Studies from Integrating Renewables into the Grid | 8The PV systems installed in Rarotonga are well spread around the island (Figure 8), which is beneficial
for the grid by helping to reduce voltage rises and overloading the feeders.
Figure 8: Map of Solar Locations in Rarotonga
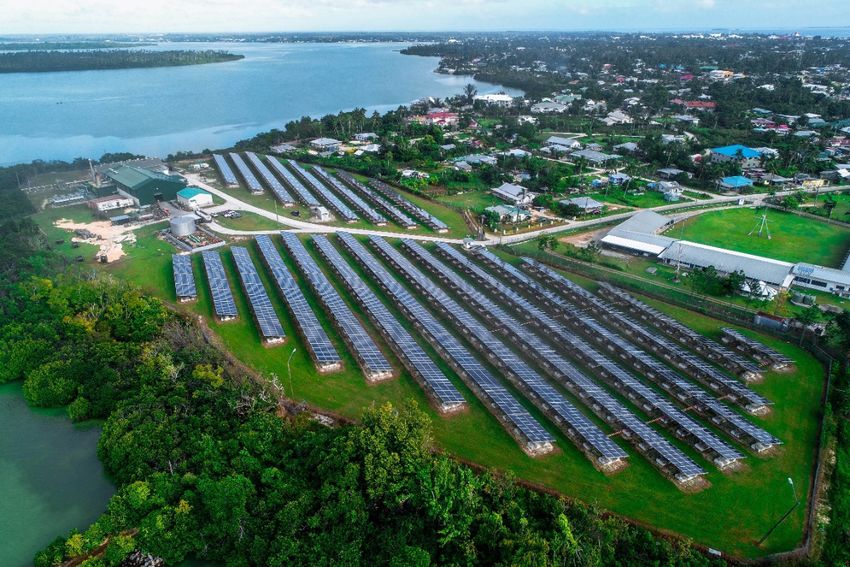
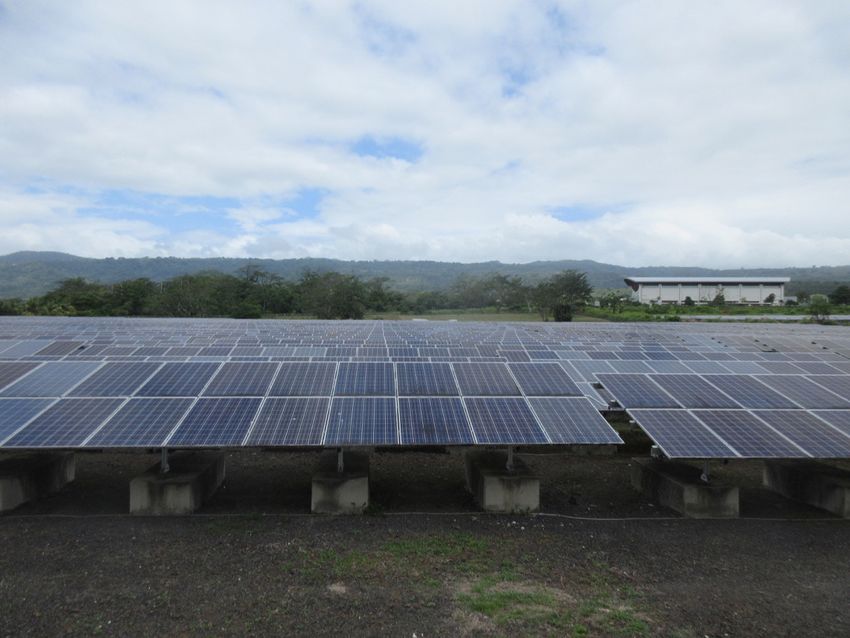
The largest PV system in Rarotonga contributing to the CIREC is the “Te Mana o Te Ra” (Power from
the Sun), also known as the Rarotonga International Airport Solar Project. The project was completed
in 2014 and involved the construction of a 961kWp PV solar facility on the Rarotonga grid at the
airport. The project was implemented by MFAT in alignment with the CIREC and NSDP, and is enough
to provide 5% of Rarotonga’s electricity needs, expected to reduce diesel fuel consumption by 400,000
litres each year.
In the future, TAU intends to install an additional 3MW of PV to match its storage projects, and the
remaining capacity to be derived from the private sector in the future. Private sector engagements will
be managed by PPAs, in addition to a small allocation of scaled customer PV systems.
The Government has also been investigating RE options for road transportation on Rarotonga, as
the transport sector accounts for 43% of the total emissions in Cook Islands. Electric Vehicles (EVs)
will increase the demand for electricity moving forward, with on island EV transport steadily growing
and showing potential with over 40 EV owners on Rarotonga as well as several in Aitutaki. TAU is
investigating the benefits of a range of charging infrastructure for Rarotonga, including the value
they may add when the Rarotonga power system via renewable energy contributions would benefit
from EV loads and minimise curtailment, without adding significant cost. On full charge an EV can
travel approximately 130 kilometres, four times around Rarotonga. In 2016, TAU took delivery of six
electric vehicles (two pickups, two vans and two bikes) which were imported from China. In 2017, TAU
launched their 10kW PV Solar Project, Rarotonga’s first electric vehicle charging station located at the
head office carpark in Avarua (Figure 9). Previously, EV owners could only charge their EV on their own
premises by plugging their car into an adapter and into a home wall socket. The modules at the facility
will reduce fossil fuel consumption by approximately 4,600 litres per year.
9 | Case Studies from Integrating Renewables into the GridFigure 9: TAU EV Charging Station
2.1.3 BESS
The intermittent nature of RE based electricity generation such as PV modules and wind turbines can
affect the stability of the grid and possibly require the utility operator to maintain a diesel generator
spinning reserve. With storage, the levels of penetration of renewables, both in power and energy, can
continue to increase. Cook Island’s ambitious 100% target of renewable penetration will not be reached
without energy storage as it is a critical means of integrating RE into the network. The integration of
BESS has allowed all inhabited islands excluding Rarotonga to reach 95% of the electricity needs from
renewable resources. TAU placed a hold on private sector RE installations at the end of 2015 due to the
network reaching its capacity to absorb further solar generation, and battery storage was considered
as the next step. The first installations are to provide time-shifting storage, with additional grid-stability
support storage to follow. To reach 70% RE contribution levels, TAU estimates it will require 25MWh
of storage tied to PV generators. TAU will have commissioned 14.5MWh of BESS in 2019/20 and
connected with its PV plants. The remaining is expected to be coupled with private PV installations and
managed by PPAs.
In 2014, the CIRESP was established to build PV plants in the islands of the Southern Group as
introduced in section 2.1.2. The first phase encompassed the outer islands of Atiu, Mitiaro, Mangaia
and Mauke converting from diesel power supply to PV–battery hybrid systems which have a combined
installed battery capacity of 8.4MWh (Table 3).
Table 3: Cook Islands Renewable Energy Sector Project BESS
Island Year Installed Rated Output Battery Capacity
Mitiaro 2018 0.072MW 1.1MWh
Mauke 2018 0.09MW 1.4MWh
Mangaia 2018 0.216MW 3.4MWh
Atiu 2018 0.162MW 2.5MWh
Aitutaki 2019 500kW 502kWh
Rarotonga 2019 1MW 4MWh
Rarotonga TBC 2.6MW 10.5MWh
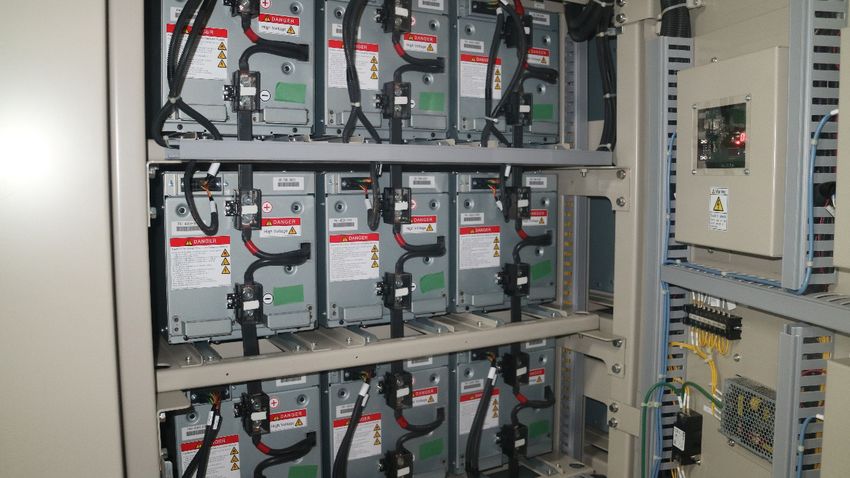
Case Studies from Integrating Renewables into the Grid | 10In 2019, phase two of the CIRESP began which included a containerised BESS installed with the new
1MW PV system at the power station in Aitutaki, and BESS connected to the Rarotonga grid. In 2017,
Australian renewables company MPower secured the contract to install a BESS with a rated output of
1MW and battery capacity of 4MWh, which will help utilise load shifting and curtailment to provide firm
output and allow 2MW of additional solar PV installation. The system, added to the Te Mana o Te Ra PV
facility, will reduce annual diesel usage by approximately 1.26 million litres, approximately 2,793 tons
of carbon dioxide emissions per year. In 2018, New Zealand electricity distributor Vector Powersmart
Ltd signed a contract with the Cook Islands Government to provide TAU with the two large utility scale
battery storage facilities to be located adjacent to the Rarotonga International Airport, to be coupled
with 2MW of solar farms in close proximity. The BESS to be installed is the “Rarotonga BESS Project
Airport South” (Figure 10).
Figure 10: Rarotonga BESS Project Airport South
Vector subcontracted Tesla Inc in partnership with TAU, Cook Islands Government, and GCF to install
the Tesla Powerpack 2 with a rated output of 2.6MW and battery capacity of 10.5MWh. This system
will provide load shifting to offset renewable generation and grid-stabilization to manage the impact
of fluctuations in generation on the grid, so as to permit more renewable energy generation to be
integrated while maintaining power quality and system reliability. This will also minimise the severity
and frequency of events that cause low load at the power station and minimise any curtailment of solar
PV facilities that may be necessary to maintain grid stability.
2.1.4 Independent Power Producers (IPPs)
IPPs are privately owned power plants, an entity which owns facilities to generate electric power for sale to
utilities and end users. In the renewable energy industry, IPPs are typically large-scale (greater than 1MW
capacity), however due to the smaller energy demand and land ownership limitations in comparison to other
countries, in Cook Islands these are households or businesses which are much smaller in size. PV systems up
to 2kW are net metered, and those 2kW or above are considered IPPs. TAU currently manages a combined
1.711MW of IPPs, the largest being 100kW, with most PV systems typically 21kW due to the size of the land
available on a ¼ acre property.
11 | Case Studies from Integrating Renewables into the Grid2.2 Lessons Learnt
2.2.1 Equipment Quality and Regulation
There is currently no regulatory system in place for equipment in the Cook Islands, and as a result
the regulation environment and equipment quality are not up to certification and standards. Products
chosen to be used in systems are often imported as they have the cheapest price, and whilst systems
appear to work when inspected after their installation, there is still a failure rate of equipment
highlighting the need for more regulation.
The most common equipment TAU has experienced having failure issues is inverters. One issue involved
half of their 39 SMA inverters, where the internal relays were malfunctioning and all needed to be
replaced. The inverters were only 3 years old at the time, the poor quality suspected to be a result of
the sudden boom in PV, and manufacturers needing to meet demand. Another issue is that if an inverter
fails and requires replacing, the same product is usually no longer available and the customer may have
to purchase a new inverter which is not compatible. For example, previous inverters were rated at 20kW
however new inverters were rated at 25kW, which resulted in busbars burning out as the systems were
not designed for the different sized inverter. The systems required upgrading as there was no tolerance
in the design for upsizing, the cabling required changing to match the new inverter. A possible solution
to this issue is to enforce all systems to have cables and switchgear designed for 25 to 50% oversize,
and enforce that all installed inverters have passed IEC and AS/NZS 4777 requirements or included on
lists such as Australia’s Clean Energy Council approved inverters.
2.2.2 Geographical Location
Like many countries in the Pacific, Cook Islands faces challenges based on its geographic isolation. The humid
and tropical climate of Cook Islands has also an impact on installed equipment, including:
• High failure rates of inverters due to water ingress. Additionally, the original contractor no longer
exists so they cannot be held accountable.;
• Corrosion issues on the Insulation Piercing Connectors (IPCs) on the cable connection in the
overhead systems;
• N-Power freight container required painting because it was too rusty; and
• Inverters at the power station having issues with mud wasps, resulting in having to be cleaned.
The physical characteristics of the country also make it particularly vulnerable to the effects of a
changing global climate, in particular the number of cyclones, which have had a devastating impact
on the economy, environment, homes and livelihoods of the Cook Islands people. This has required
TAU and outer islands to undertake proactive measures in order to increase their resilience to extreme
weather events, reduce loss of power, and allow the network to return to a normal state of operation
faster. Following the aftermath of Cyclone Pat in 2010 which destroyed the majority of Aitutaki’s
electricity grid such as distribution and transmission lines, the country has further increased the
amount of underground cables installed in the network, as well as designing systems with more robust
materials.
2.2.3 Personnel Training
Whilst there are competent licenced electricians present in the Cook Islands, few are sufficiently trained
to install renewable energy systems. TAU have identified that more training is required in this industry,
involving repetitive and practical training as the students are predominantly kinesthetic (hands-on),
rather than visual learners who can understand simply through reading text. Incorporating exercises
such as fault-finding training where they learn to fix common issues and gain a diagnostic ability will
benefit them much more than simply providing manuals and resources, which are often forgotten. The
ideal approach would be to have a model system setup in Rarotonga where faults can be simulated.
The staff also need to be encouraged to continuously keep up-to-date by reading manuals, preferably
with visual images, as there is lack of motivation to do so if a system is working well. By making minor
adjustments, some issues can be avoided by taking preventative control of the systems. TAU is currently
collaborating with ADB and global company Ecotech to run training sessions.
Case Studies from Integrating Renewables into the Grid | 12The importance of personnel training has been emphasised by the issues involving one of TAU’s
installed systems, the MPower 1MW/4MWh BESS installed at the Mana o Te Ra PV facility. An
oversight during the design phase resulted in a control system in which the inverter and battery were
not able to communicate with each other due to language differences, and it was difficult for the TAU
team to diagnose the issue. The installed system would work for one or two days at a time before a
failure would occur, with numerous failures occurring it took a long time to get the system operating. It
was determined that the cooling system was contributing to the failures and the system shut down due
to overheating, and the installed equipment have very small tolerance levels for each of the components.
The complexity of determining which of the different devices and equipment available in the market
are compatible is a key area in which TAU staff need to be trained, without having to rely solely on the
contracted system designer.
Another key issue with training is the lack of expertise available in the outer islands. There is a common
assumption that the level of knowledge in rural areas and outer islands is the same as the main island
of Rarotonga, however these electricians are usually only trained for two weeks which is not sufficient
to learn the adequate skills involved. In some cases, there have also been communication barriers with
technical issues on the outer islands, requiring training in the native language Maori or basic language.
Even if remote monitoring access is available for the systems in the outer islands, there must still be
a supervisor physically present in case any issues arise. Further, there is the issue that those with
expertise will choose to leave rural areas in the hopes of obtaining a higher salary in urban areas.
TAU has recognised those who may be more willing to stay are those who are older and want to stay
with their families. The worker should also be employed on a permanent basis to inspect the systems,
rather than only when an issue arises and needs fixing, incentivising them to keep up with training and
become invested in learning how to operate and maintain systems.
2.2.4 Community Engagement
In an effort to reduce diesel consumption, the government introduced a net-metering policy in 2009 to
stimulate the growth of rooftop PV and encourage renewable energy development from commercial
and residential customers. The policy provided economic incentives to customers interested in grid-
connected renewable energy installations under 10kW capacity, allowing for credits to accumulate over
a period of 12 months from the excess energy fed back into the grid. The response from the public was
overwhelming, partly fuelled by the 2011 announcement to go “100% renewable” by 2020, and by
the end of January 2012 59 projects were installed with a total capacity of 288kW. However, due to
network safety and power quality concerns, TAU was required to issue an amended net-metering policy
in 2011 to limit the individual installed capacity to under 2kW. A process of assessment and approval
by TAU is now mandatory before any grid-connected PV project can proceed. This has resulted in a
strained relationship between TAU and its customers, as the utility is blamed for not carefully planning
the policy. Residents connecting new systems also question why they are not eligible to receive the
same benefits that were previously available, putting pressure on both the government and TAU, who
must bear the economic burden. The lesson from this is that perhaps the Pacific Islands are not an ideal
environment for a net-metering policy, and when designing new policies in the future, the utility should
ensure they are not too generous. However, the high cost of electricity is still driving the high demand
of PV installations, particularly for businesses where energy costs are significant. Even without net-
metering benefits, many grid-connected PV systems are still considered viable.
Despite the fact that PV systems have been operating in Cook Islands since 2014, there still remains
the common misconception that solar energy is cheap or free. There is an assumption that there should
be reduced energy costs because of the reduction in diesel, however the size of savings could be
affected by the overall increase in energy consumption and by requirements for the tariff charged to
meet depreciation of the assets. The community needs to understand that there is a cost involved to
have a reliable supply of power, and this message must be clearly conveyed with the increase in number
of renewable energy projects. For example, as a result of the increasing demand of residential grid-
connected PV systems, TAU purchased 50 new lead-acid batteries in order to assist in grid-stability.
However, these all experiences failures due to overloading of the network, and had to be returned to
the manufacturer for testing. An additional cluster was suggested to be built to account for the growth,
as the diesel was then required to run full-time as spinning reserve. There was a miscommunication
with the community, as they were not told these could not be discharged less than 50%. TAU have
recognised the importance of this issue, and have set up a 2kW PV system with storage featuring zero
export to demonstrate and educate the contractors/installers and the public.
13 | Case Studies from Integrating Renewables into the GridMore customer outreach and awareness programs will need to be introduced in the future in order to
sustain a positive relationship with the community.
2.3 Operational Changes
2.3.1 Generation Dispatch Information
TAU, in its ongoing role of managing island wide stability and reliability of electricity to all grid
connected customers, requires an advanced and dynamic control system that will synchronise all
network assets to match the customer consumption patterns instantaneously. The load shape in
Rarotonga is relatively flat, with the highest loads occurring on rainy summer days. The load shape has
a typical early morning peak driven by commercial and residential loads, followed by a second peak at
approximately 8pm driven by residential air-conditioning and other evening loads.
A well-functioning Supervisory Control and Data Acquisition (SCADA) system is an important
foundation element of control, especially as generation becomes increasingly distributed. In 2016,
SCADA was first introduced during the automation of the Avatiu Power Station and installation of
high-speed diesel generators. The airport PV system installation was subsequently interconnected to
the SCADA system, enabling live monitoring and control of the site from Avatiu Power Station control
centre via a fibre optic link to issue command signals. The current primary function of the system is
the acquisition of operational data. The SCADA system is expected to evolve to include key distributed
elements as required to support TAUs expanding electricity supply network.
A project to install a new hybrid power control system and upgrade the existing SCADA system at the
Avatiu Power Station and the TAU central office was put out for tender in 2018. The control system
coupled with a communications network is expected to be installed over the coming year, following
which new IPPs will be able to be installed and connected to the grid network, allowing Rarotonga
to go beyond the existing RE limit. System modelling software, such as PowerFactory used by TAU,
is essential to forecast new renewable energy generators being added to the grid, and ensure that
accurate information is obtained to confirm if a system will overload the feeder. All future renewable
energy generators must be able to receive and adhere to control commands from the central power
station via the power system controller, including curtailment. This will allow the entire power system to
maintain system reliability and delivery to all customers connected to the TAU power network.
2.3.2 Diesel Generator Controls
Stability of the grid is critical as TAU’s centralised diesel generation of power at Avatiu Power Station
may be impacted by the island-wide spread of solar generation sources. The two energy sources are
essentially incompatible (one fixed and managed – the other intermittent and unconstrained) unless
a sophisticated system of enabling and control is applied, along with advanced communications
technology.
In 2016, TAU upgraded 8MW of its diesel generators to high-speed diesel generators. These generators
are necessary to provide base load, spinning reserve, and maintain overall system stability with the
integration of highly intermittent PV and wind. There are usually four of these high-speed diesel
generators in operation to maintain the spinning reserve. The aim for the future is that once there is
enough confidence in the battery energy storage systems, is will be possible to turn off all the diesel
generators.
2.3.3 Spinning Reserve Methodology
TAU has a spinning reserve policy that provides uninterrupted power supply in case the largest
generator trips. Currently the average system peak demand is 5.1MW, reaching as high as 5.6MW
in February, experienced during the day when air conditioners are being used. The peak demand is
expected to be further reduced due to recent PV installations and the on-going energy efficiency
program. With the total available capacity TAU can keep up with the n-2 criterion. However, there are
issues to be addressed to ensure long-term power supply quality.
Case Studies from Integrating Renewables into the Grid | 14You can also read