Cavan County Council Draft Cavan Housing Strategy 2022-2028
←
→
Page content transcription
If your browser does not render page correctly, please read the page content below
Cavan County
Council
Draft Cavan Housing Strategy 2022-2028

  KPMG FA
  March 2021

  Cavan HNDA 2022-2028

  © 2020 KPMG, an Irish partnership and a member firm of the KPMG network of independent member firms affiliated with KPMG International
                                   Cooperative ("KPMG International"), a Swiss entity. All rights reserved.

                                              Document classification: KPMG Confidential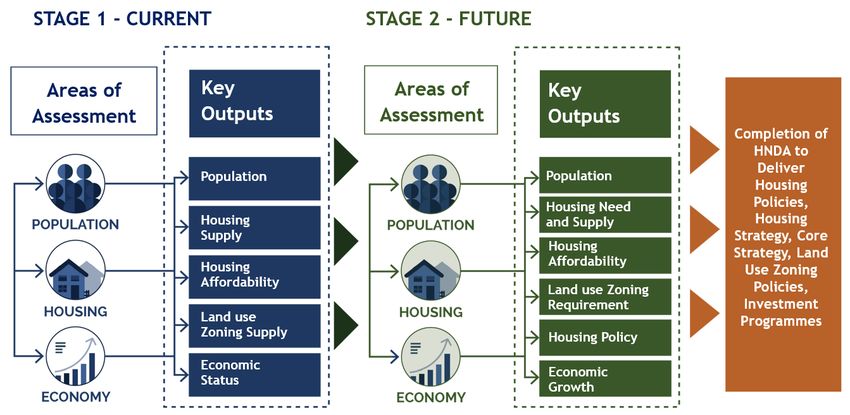
Cavan County Council
Cavan HNDA 2022-2028
December 2020

Contents
1        Introduction                                                          1
1.1      Overview                                                               1
1.2      Housing Strategy / HNDA – Guiding Principles                           2
1.3      Methodology                                                            2
1.4      Housing Need Demand Assessment (HNDA)                                  1
1.5      Housing Supply Target Methodology for Development Planning             2

2        Current Context: Review and Analysis of Existing Supply
         and Needs                                                             3
2.1      Population                                                             3
2.2      Existing Housing Stock and Supply                                      5
2.2.1          Housing Stock and Composition                                    5
2.2.2          Housing Tenure                                                   6
2.2.3          Housing Permissions                                              7
2.2.4          Social Housing Stock                                             8

3        Housing Needs in Cavan                                                10
3.1      Introduction                                                          10
3.1.1          Overview                                                        10
3.1.2          Approach                                                        10
3.1.3          Section 28 Guidelines on Household Demand                       12
3.2      Key Inputs: HNDA and Affordability Assessment                         14
3.2.1          Future Population                                               14
3.2.2          Future Households                                               14
3.2.3          Economic Outlook                                                14
3.2.4          Income Analysis                                                 16
3.2.5          Central Bank Rules and Mortgage Capacity                        19
3.2.6          Analysis of Historic Ownership Market                           20
3.2.7          Analysis of Historic Private Rental Market                      23
3.3      Assessment of Needs                                                   25
3.3.1          Ownership                                                       25
3.3.2          Private Rental                                                  31
3.3.3          Summary of Projected Needs during the Plan Period               33
3.4      HNDA Components                                                       35
3.4.1          Household Composition                                           35
3.4.2          Household Tenure                                                37
3.4.3          Dwelling Type                                                   39

Appendix 1 Housing Strategy - 1 June 2022                                       i
                                      © 2022 KPMG. All rights reserved.
                                  Document classification: KPMG Confidential
Cavan County Council
Cavan HNDA 2022-2028
December 2020
3.4.4 Single Rural Dwellings 41
3.4.5 Specialist Provision 44
4 Meeting Housing Requirements in Cavan 45
4.1 Overview 45
4.2 Social Housing Supply and Demand 45
4.2.1 Existing Social Housing Needs 45
4.2.2 Delivery Methods and Targets 48
5 Conclusion 49
Appendix 1 Housing Strategy - 1 June 2022 ii
© 2022 KPMG. All rights reserved.
Document classification: KPMG ConfidentialCavan County Council
Cavan HNDA 2022-2028
December 2020
1 Introduction
1.1 Overview
This Housing Strategy has been prepared by KPMG Future Analytics on the behalf of
Cavan County Council to meet the statutory requirements set out under Section 94 of
Planning and Development Act, 2000 (as amended). Under Part V of the Act, each
planning authority must prepare a Housing Strategy which will cover the period of its
Development Plan. In this instance, the Cavan County Development Plan spans 2022-
2028. Each strategy must have regard to the proper planning and sustainable
development of the area and must address the overall supply of housing within the
administrative boundary of the Local Authority. The Housing Strategy also addresses
relevant provisions contained within the Housing (Miscellaneous Provision) Act, 2009
and the Urban Regeneration and Housing Act 2015.
The purpose of the Housing Strategy is to ensure that the proper planning and
sustainable development of the county provides for the housing of the existing and future
population of the area in the manner set out in the Strategy.
The key objectives of the Housing Strategy are:
• To identify the existing need and likely future demand for housing in the area of
the County Cavan Development Plan.
• To ensure Cavan County Council provides for the development of sufficient
housing to meet projected future demand over the lifetime of the County
Development Plan.
• To ensure that sufficient zoned lands are provided to meet the needs of different
households of all types and tenures.
The Housing Strategy is a critical component of the County Development Plan and plays
a key role in translating national housing policies and housing supply responses to the
local level. The Housing Strategy informs the policies and objectives of the Development
Plan and provides details in relation to housing provision and its location and
requirements for different house types, sizes and tenures and the requirements for
residential zoned land. In order to ensure that the plan-making system is supported by a
robust methodology to inform policies and funding initiatives around housing and
associated land requirements, the NPF has introduced a new requirement for each Local
Authority to develop a Housing Need Demand Assessment (HNDA) which must underpin
and support the preparation of housing strategies and all related housing policy outputs.
The HNDA for County Cavan, as elaborated in Section 1.2 and 1.3, provides a robust
evidence base to inform decision-making around the current and future housing supply
and investment in housing related infrastructure and services, the location and
requirements for different house types, sizes and tenures and the requirements for
residential zoned land.
Appendix 1 Housing Strategy - 1 June 2022 1
© 2022 KPMG. All rights reserved.
Document classification: KPMG ConfidentialCavan County Council
Cavan HNDA 2022-2028
December 2020
1.2 Housing Strategy / HNDA – Guiding Principles
An evidence-based and future-proofed methodological approach has been adopted to
ensure that the County Cavan Housing Strategy meets the housing needs of the county
and its residents while remaining consistent with local, regional and national guidelines.
Chapter 3 of this Development Plan identifies and reviews the key legislative and policy
instruments relevant to the delivery of County Cavan’s Housing Strategy 2022-2028. The
Strategy is underpinned by a HNDA which provides a robust baseline to inform and guide
policies and objectives under the Cavan County Development Plan 2022-2028.
Ireland’s economic recovery over the past decide has led to ongoing challenges around
fluctuations in the supply, demand and price of housing nationally. It has also led to
opportunities, with a greater mix of house types and tenures diversifying Ireland’s
housing market. Aside from the traditional home-ownership model, rental
accommodation will play a greater role in the provision of housing nationally and indeed
across Cavan.
The HNDA incorporates a range of socio-economic and demographic data to analyse
current levels of demand and supply within Cavan’s housing sector, and projects for
future need over the lifetime of the Development Plan. It incorporates demand across
different tenures, including owner-occupied, the rental sector and social housing and
provides estimates of future housing needs based on employment growth, income levels
and affordability in the housing market.
1.3 Methodology
This Section provides an overview of the key components involved in the development
and application of the HNDA model. There are three components to the modelling that
have been undertaken by KPMG Future Analytics on behalf of Cavan County Council as
shown in Figure 1.1. This is further supported by the baseline analysis of the existing
situation that is presented in Section 2.
Figure 1-1: Overview of the HNDA Modelling
Housing Housing Analysis
Population
Supply and Rental and
Projections
Targets Affordability Implications
The first component of the modelling explores projected population scenarios for County
Cavan to the end of the plan period. The NPF sets out projected population targets to
2040 as well as in key intermediary years 2026 and 2031.
The second component in conjunction to population projections is the determination of
Housing Supply Targets as required by the Section 28 Guidelines. This is established
through the calculation of the Housing Supply Target for the plan period for County
Cavan in accordance with the ‘Housing Supply Target Methodology for Development
Planning’ DHLGH guidelines (December 2020), as described in Sections 1.5 and 3.1.3.
Appendix 1 Housing Strategy - 1 June 2022 2
© 2022 KPMG. All rights reserved.
Document classification: KPMG ConfidentialCavan County Council
Cavan HNDA 2022-2028
December 2020
This provides plan period targets and annualised figures for housing demand that have
been analysed in the HNDA.
The third component relates to an assessment of housing and rental affordability. This
assessment supports the identification of social (and affordable) housing needs for the
local authority during the plan period with the relevant information presented in Sections
3.2 and 3.3
Following this, analysis has been undertaken in relation to specific requirements of the
housing demand as set out in the Section 28 Guidelines in relation to the existing market
forces, composition, tenure, dwelling type as well as single rural dwellings and specialist
provision. This information is presented in Section 3.4.
Section 4 provides an overview of how Cavan County Council meets housing
requirements across the county whilst Section 5 provides a summary of the key Strategy
outputs.
Appendix 1 Housing Strategy - 1 June 2022 3
© 2022 KPMG. All rights reserved.
Document classification: KPMG ConfidentialCavan County Council
Cavan HNDA 2022-2028
December 2020
1.4 Housing Need Demand Assessment (HNDA)
Under Section 94 (1) (a) of the Planning and Development Act 2000 (as amended), each
planning authority “shall include in any development plan a strategy for the purpose of
ensuring that proper planning and sustainable development of the area of the
development plan provides for the housing of the existing and future population of the
area in the manner set out in the strategy”.
This must account for:
• the existing need and the likely future need for housing;
• the need to ensure that housing is available for persons who have different levels
of income;
• the need to ensure that a mixture of house types and sizes is developed to
reasonably match the requirements of the different categories of households, as
may be determined by the planning authority, and including the special
requirements of elderly persons and persons with disabilities, and;
• the need to counteract undue segregation in housing between persons of
different social backgrounds.
In order to ensure that the plan-making system is supported by a robust methodology to
inform policies and funding initiatives around housing and associated land requirements,
the NPF has introduced a new requirement for each Local Authority to develop a Housing
Need Demand Assessment (HNDA). The HNDA will support the preparation of housing
strategies and all related housing policy outputs, e.g. city and county development plans,
local area plans, traveller accommodation plans etc.
The NPF indicates that the purpose of the HNDA tool is to:
• Assist local authorities to develop long-term strategic views of housing need
across all tenures.
• Provide a robust evidence base to support decisions about new housing supply,
wider investment and housing related services that inform an overall national
housing profile.
• Inform policies about the proportion of social and affordable housing required,
including the need for different types and sizes of provision.
• Provide evidence to inform policies related to the provision of specialist housing
and housing related services.
The NPF notes that HNDAs are designed to give broad, long run estimates of what future
housing need might be, rather than precision estimates. The Framework must be logical,
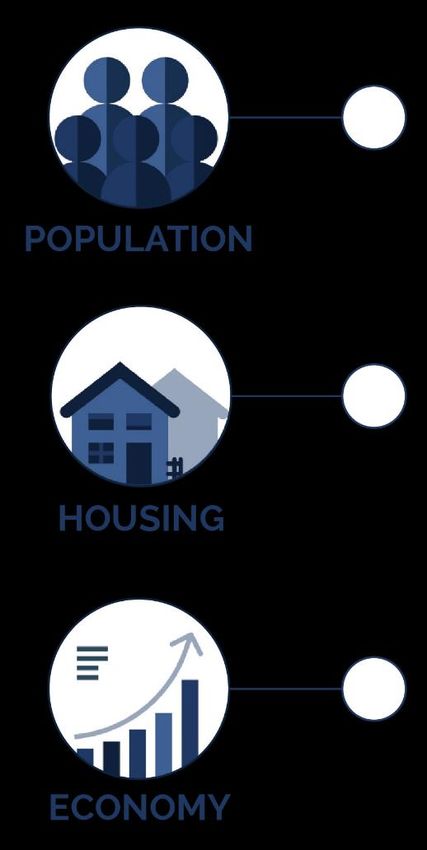
sequential and allow for updating, monitoring and evaluation. The HNDA undertaken as
part of this Development Plan spans two key stages – current and future outlook; and
assesses three core areas: Population, Housing and Economy. These are set out in
figure 1.2 below. The sequential steps involved in the development and application of
this HNDA model is then presented in Section 3.1.2.
Appendix 1 Housing Strategy - 1 June 2022 1
© 2022 KPMG. All rights reserved.
Document classification: KPMG ConfidentialCavan County Council
Cavan HNDA 2022-2028
December 2020
Population – Growth, Trends, Composition, Socio-
Economic Profile; Geographical Distribution
Housing Supply and Demand – Location (Identification
of Pressure Areas), Composition (1 Person, 2 Person,
etc. Households), Tenure (Owner Occupier, Private
Rented, Social), Type (Detached, Semi-Detached,
Apartment), Density (Units Per Hectare), Size (1
Bedroom, 2 Bedroom, etc.), Vacancy/Occupancy,
Specialist Provision (Disabled, Care Support –
Dependent/Independent Living, Temporary -
Homelessness, Travelling)
Economic Standing and Economic Growth, Income
Levels (Gross, Net), House Price Values, Sales and
Levels, Rental Values and Levels, Financial
Regulation (Central Bank Macro-Prudential Rules)
Figure 1-2: HNDA Assessment Areas. Source: KPMG Future Analytics
The methodological approach to the HNDA undertaken as part of the Cavan Housing
Strategy 2022-2028 is summarised in figure 1.3 below. The process will enhance how
acute and unmet demand for housing is identified before it arises. It provides a robust
assessment of regional and localised influences, such as population and migration, in
quantifying needs and demands. The key evidence inputs which drive the model are:
1. Demographic trends, affordability trends and wider economic trends.
The use of economic forecasting or econometric work underpins this section. Data
requirements include household composition/projections, house prices, rents, number of
first-time buyers (FTBs) and loan to value (LTV) mortgage rates, economic activity and
employment rates, etc.
2. Housing Stock Profile Pressures (and existing need) and management issues.
This involves undertaking a detailed profile of local housing stock and stock pressures,
including local authority housing, to identify the main pressures relating to supply and
demand, ineffective stock and overall condition as well as priorities for future stock
management. Information is required on dwelling size, dwelling type, dwelling condition
and stock pressures (occupancy/under occupancy stock turnover, etc.).
3. Estimating Future Housing Need and Demand. This is broken down into: owner
occupation, private sector, below market rent and social rent.
Appendix 1 Housing Strategy - 1 June 2022 2
© 2022 KPMG. All rights reserved.
Document classification: KPMG ConfidentialCavan County Council Cavan HNDA 2022-2028 December 2020 Figure 1.3: HNDA Methodological Approach Appendix 1 Housing Strategy - 1 June 2022 1
Cavan County Council
      Cavan HNDA 2022-2028
      December 2020

1.5   Housing Supply Target Methodology for Development Planning
      As outline in Chapter 2, the NPF is based on demographic and econometric projections
      undertaken by the Economic and Social Research Institute (ESRI) in 2017. Following
      publication of the NPF in 2018, the NPF ‘Roadmap’ circular was issued to all planning
      authorities, setting out projected county population ranges for 2026 and 2031. As part of
      the development plan process, planning authorities must demonstrate the manner in
      which their core strategy and other elements of the plan are consistent with the
      established NPF Roadmap population projections for their local authority area.

      In order to strengthen the relationship between national and regional population
      projections and their integration into the development planning process at local authority
      level, the Department commissioned the ESRI to further develop work previously
      undertaken for the NPF. The findings of the ESRI work were published as a research
      paper on Structural Housing Demand at County Level in December 2020. Following
      publication of this, the ‘Housing Supply Target Methodology for Development Planning:
      Guidelines for Planning Authorities issued under Section 28 of the Planning and
      Development Act, 2000 (as amended)’ was published.

      This ESRI research applies the projection model to four different development scenarios:

      — Baseline – projecting a ‘business as usual’ scenario which is based on current trends
          and medium-term projections for the Irish economy;
      — NPF 50:50 City – consistent with the NPF strategy;
      — High Migration – incorporating assumptions around high international migration flows
          into Ireland based on higher economic growth than the baseline; and
      — Low Migration – incorporating assumptions around lower international migration
          flows into Ireland based on lower economic growth than the baseline.

      The ESRI research model is intended to enable structural household demand levels for
      each local authority area to be set out under the four different scenarios for each year to
      2040. The Section 28 Guidelines state that “The NPF 50:50 City scenario is broadly
      consistent with the National Planning Framework strategy and consequently, the 2018
      NPF ‘Roadmap’ document”. As such, the Section 28 Guidelines further indicate that this
      is the recommended housing demand scenario to be used by planning authorities in their
      planning functions in order to plan for the provision of housing to meet projected levels
      of demand in their administrative area, in accordance with the NPF strategy.

      Thus, planning authorities must now demonstrate the manner in which their core strategy
      and other elements of the plan are consistent with the established NPF Roadmap
      population projections for their local authority area and accordingly, with the related NPF
      50:50 City housing demand projection scenario identified by the ESRI. Deviation from
      this scenario, the Guidelines state, must be evidence-based and consistent with these
      guidelines.

      The Guidelines set a methodology for the application of population and housing
      projections into Local Authority plan processes. The calculation of the housing supply
      targets for County Cavan is detailed in Section 3.1.3.

      Appendix 1 Housing Strategy - 1 June 2022                                                2
                                              © 2022 KPMG. All rights reserved.
                                          Document classification: KPMG Confidential
Cavan County Council
Cavan HNDA 2022-2028
December 2020
2 Current Context: Review and Analysis of Existing
Supply and Needs
This section presents a concise overview of the existing population and housing context
in County Cavan. This includes the current demographic, housing, and socio-economic
baseline across the county.
2.1 Population
Census 2016 results show that Ireland’s population stood at 4,761,865 in April 2016, an
increase of 173,613 (3.8%) since April 2011. County Cavan is located within the Northern
and Western Regional Assembly (NWRA) area, a region with approximately 18% of
Ireland’s total population. As the RSES notes, this can be considered a relatively low
proportion of the overall population considering the geographical size of the region.
However, the past two decades (between 1996 and 2016) has seen the region grow by
an additional 179, 960 persons. In particular, the period between 2002 to 2006 saw a
growth rate of 7.8% in the region, while the following period between 2006 and 2011 saw
a growth of 7.9%.
County Cavan saw a population increase of 4% (+2993 persons) between 2011 and
2016, as the population increased to 76,176 from 73,183. However, there are significant
variances in population trends across the county. Population change across the various
settlements is set out in Table 2.1.
Table 2-1: Population Growth 2011-2016
Settlement 2011 2016 2011-2016
Growth Rate %
Cavan Town 10,205 10,914 6.9%
Ballyjamesduff 2,568 2661 3.6%
Bailieborough 2,530 2683 6.0%
Kingscourt 2,326 2499 7.4%
Virginia 2,282 2648 16.0%
Cootehill 2,123 1853 -12%
Belturbet 1407 1369 -2.7%
Mullagh 1,137 1348 18.0%
Ballyconnell 1061 1105 4.1%
Ballinagh 766 936 22.1%
Killeshandra 364 388 6.5%
Arva 380 411 8.1%
Appendix 1 Housing Strategy - 1 June 2022 3
© 2022 KPMG. All rights reserved.
Document classification: KPMG ConfidentialCavan County Council
Cavan HNDA 2022-2028
December 2020
Kilnaleck 384 393 2.3%
Shercock 384 588 53.1%
Ballyhaise 620 711 14.6%
Lough Gowna 161 149 -7.4%
Blacklion 229 194 -15%
Butlersbridge 282 276 -2%
Swanlibar 211 207 -1.8%
Rest of the County 43,763 44,843 2.5%
Total for County Cavan 73,183 76,176 4.0%
The NWRA region, as a whole, remains a rural region. Each county has a majority in
rural areas, with Leitrim the highest on 89%. Sligo is the most urban county, with 39% of
its population living in such areas, however, this is significantly lower than the state
average of 62%. According to the CSO’s parameters, a total of 23,258 people (30.5%)
were living in urban settlements in Cavan in 2016. 52,918 (69.5%) were living in smaller
towns and villages, as well as in the rural remainder of the county. In 2011, census results
showed a distribution between the urban and rural population as 30% and 70%
respectively. Thus, the urban/ rural split has remained relatively stable over this period,
with a marginal increase in the urban population.
The Census 2016 results show that Ireland’s population has been getting steadily older
since the 1980s. In 2016, 37.2% of the Irish population were aged 45 and over, compared
with 34.4% in 2011 and 27.6% in 1986. As is the case in the rest of Ireland, the NWRA
has an ageing population, with the average age of the population standing at 37.9 in
2016. The average age of Cavan’s inhabitants is 36.7 years old, lower than the national
average age of 37.4. 13.7% of the county population were over 65 years old in 2016, in
contrast to state figure of 13.4%. 23.1% of Cavan’s population is aged under 14. In total,
the number of children of pre-school age (0-4) is 5,725 (7.5%). 9,678 (12.7%) are of
primary school going age (5-12) and a further 6,596 (8.6%) are of secondary school
going age (13-18). An extended age profile of the county is presented in figure 5 below.
The total age dependency ratio for County Cavan in 2016 was 58.4%1, as demonstrated
in Table 2.2. Nationally, this figure stood at 52.7%.
1Dependents are defined for statistical purposes as people outside the normal working age of 15-64.
Dependency ratios are used to give a useful indication of the age structure of a population with young (0-
14) and old (65+) shown as a percentage of the population of working age (15-64).
Appendix 1 Housing Strategy - 1 June 2022 4
© 2022 KPMG. All rights reserved.
Document classification: KPMG ConfidentialCavan County Council
Cavan HNDA 2022-2028
December 2020
85+
80-84 Female % Male %
75-79
70-74
65-69
60-64
55-59
50-54
Age Group
45-49
40-44
35-39
30-34
25-29
20-24
15-19
10-14
5- 9
0-4
-10.0% -8.0% -6.0% -4.0% -2.0% 0.0% 2.0% 4.0% 6.0% 8.0% 10.0%
Table 2-2: Dependency Ratios
Young Total
0-14 15-64 Over 65 Old Age
Age Ratio Dependency
years years years Ratio (%)
(%) Ratio (%)
Cavan 17,622 48,090 10,464 36.6% 21.7% 58.4%
2.2 Existing Housing Stock and Supply
2.2.1 Housing Stock and Composition
Census 2016 results record a total housing stock of 33,585 units in County Cavan, which
represents a marginal decrease of 126 units on 2011 levels. The number of vacant units
in 2016 stood at 4,829 (excluding holiday homes and those dwellings deemed to be
temporarily absent). The 2011 Census data does not distinguish between categories of
vacancy and indicates that there were 7,867 unoccupied dwellings in 2011. In contrast,
the 2016 data illustrates the number of temporarily absent dwellings, unoccupied holiday
homes and other vacant dwellings. For comparison purposes, the total number of vacant
dwellings across these three categories in 2016 is 6,660. As such, there is an overall
decline in the number of vacant dwellings of 1,207 between 2011-2016. This indicates
Appendix 1 Housing Strategy - 1 June 2022 5
© 2022 KPMG. All rights reserved.
Document classification: KPMG ConfidentialCavan County Council
Cavan HNDA 2022-2028
December 2020
the existing vacant stock absorbing much of the growing need for housing in the county.
A summary of the information on the existing housing stock is provided in Table 2.3.
Table 2-3: Occupancy Status
Unoccupied
Housing Temporarily
County Holiday Vacancy % Vacancy2
stock Absent
homes
County
33,585 1046 785 4829 14.3%
Cavan
Household size cohort represents the number of people per households. More than half
(51.7%) of households in Cavan in 2016 had just one or two persons living in that
household as illustrated Table 2.4, however this generally compares to the national
figures on household size cohorts.
Table 2-4: Household Size Cohort
No. People per Households Persons Households % Persons
Household %
1-person household 6683 6683 24.8 8.9
2-person household 7227 14,454 26.9 19.2
3-person household 4327 12,981 16.1 17.2
4-person household 4358 17,432 16.2 23.2
5+ person household 4304 23,735 16.0 31.5
Total 26,899 75,285 100 100
Compositionally, there were 26,899 households and an average household size of 2.80,
which is marginally higher than the national rate of 2.75. 94.2% of households comprised
of a house or bungalow while 4.1% resided in apartments in 2016. At a national level,
12% of all occupied households in Ireland were apartments.
2.2.2 Housing Tenure
Home ownership remains the dominant tenure in Cavan with 71.5% of households within
this category in 2016 (compared to a State average of 67.6%). 31.7% of households pay
a mortgage. 15.6% of households were in the private rental market; an increase of 7%
or 278 households since 2011. 8.6% (2302) of households in the county resided in social
housing.
2The percentage vacancy rate provided is based on ‘Other Vacancy’ category as a percentage of total
housing stock and excludes vacant holiday homes and those temporarily absent.
Appendix 1 Housing Strategy - 1 June 2022 6
© 2022 KPMG. All rights reserved.
Document classification: KPMG ConfidentialCavan County Council
Cavan HNDA 2022-2028
December 2020
Table 2-5: Tenure
Households Persons Households % Persons %
Social Housing 2302 5822 8.6% 7.7%
Rented (Privately) 4171 11625 15.6% 15.5%
Owner Occupied 19164 55162 71.5% 73.4%
(All)
Household Occupancy type is a dataset compiled by the CSO that showcases the
composition of an area’s housing stock. It can be broadly separated into five distinct
categories: Owner Occupied with no mortgage; owner occupied and paying a mortgage;
private rental; rented from either a local authority of a voluntary body, which can be
referred to as social housing; and occupied free of rent. The total number of households
recorded in the NWRA region was 308,151. In Cavan, this stood at 26,806.
Table 2-6: Occupancy Type
County Owner Owner Rented Rented Rented Occupi Not Total
Cavan occupie occupie from from from ed free stated
d with d no private Local volunta of rent
mortga mortga landlor Authorit ry body
ge ge d y
(No. 8507 10,657 4171 2169 133 511 658 26,806
households)
Of this total, 71.5% of households are either ‘’owner occupied with mortgage’’ or ‘’owner
occupied with no mortgage’’. This is by far the largest type within the NWRA region, with
a comparable percentage total of 71.3% of all households. Compared to the State
average of 67.6%, the region has more homeowners proportionately.
2.2.3 Housing Permissions
Section 3.4.4 describes in detail the number of granted planning applications in County
Cavan between 2006 and 2019 by units. 41.7% of these relate to houses and apartments
via development scheme applications while 58.3% relate to one-off dwellings. Over
recent years (2016 - 2019), on average, 58.5% of granted applications were for one off
dwellings, while approximately 41.5% were for houses and apartments via development
scheme applications.
Appendix 1 Housing Strategy - 1 June 2022 7
© 2022 KPMG. All rights reserved.
Document classification: KPMG ConfidentialCavan County Council
Cavan HNDA 2022-2028
December 2020
2.2.4 Social Housing Stock
In accordance with Section 9 of the Housing Act 1988, housing authorities are required
to undertake an assessment of housing need in their administrative area. The social
housing stock of Cavan County Council as of March 2021 is as follows:
Social Housing Stock, Cavan No. of Units
2107
Directly owned
RAS 410
441
HAP
AHB 88
Leasing (AHB owned or leased) 110
LA Direct Leased 15
Approved Housing Bodies – AHB’s
AHB’s provide social housing and are formed for the purpose of relieving housing need
and the provision and management of housing. They are established by a voluntary
management board to benefit the community in which they are based and are approved
and funded by the Department of Housing, Planning and Local Government. Housing
cooperatives can provide both social rented housing and housing to purchase. Housing
cooperatives are self-help and jointly owned member/user housing associations or
societies. Projects undertaken may be in response to the needs of the elderly, people
with disabilities, homeless persons or families and single people on low incomes. Some
housing associations may be formed to specialise in meeting a particular housing need,
others develop with broader aims. The specific housing services offered will depend on
the aims or concerns of the members, the needs of tenants as well as the financial and
other resources available for both capital costs and ongoing management running costs.
In December 2019, DHPLG issued a Circular (Housing Circular 40/2019) directing all
local authorities to commence the establishment of a Local Authority and Approved
Housing Body Housing Delivery Forum to represent their local authority area. This
Circular followed a series of consultations events with local authorities and AHBs as well
as detailed engagement with the CCMA Housing and Building Committee and the Irish
Council for Social Housing. The overall objective is for each local authority to establish
a local AHB forum to involve the key AHBs that are active in its area. The key concerns
to be considered by the AHB forum are as follows:
• Agree and implement a Protocol for local authority/AHB engagement on the
Delivery of Housing
• Review delivery targets under Rebuilding Ireland to monitor delivery and identify
opportunities
• Agree and implement a Protocol to co-ordinate the provision of the additional
support services available from those AHBs that work with households
experiencing acute issues (homelessness, disability etc)
• To monitor and improve operational issues including the allocation process,
agreeing rents etc
• Bring to the attention of the Department/CCMA/national AHB Forum, strategic or
national issues that require agreement or solutions at the Departmental/CCMA
level
A list of AHB’s active in Co. Cavan is set out below:
Appendix 1 Housing Strategy - 1 June 2022 8
© 2022 KPMG. All rights reserved.
Document classification: KPMG ConfidentialCavan County Council
Cavan HNDA 2022-2028
December 2020
• Cluid Housing
• Respond Housing
• Tuath Housing
• Oaklee Trust Housing
• North and East Housing Association
• iCare Housing
• Home for Life Limited Partnership
• Co-operative Housing Ireland
• Clanmil Housing Association Ireland
Appendix 1 Housing Strategy - 1 June 2022 9
© 2022 KPMG. All rights reserved.
Document classification: KPMG ConfidentialCavan County Council
Cavan HNDA 2022-2028
December 2020
3 Housing Needs in Cavan
3.1 Introduction
3.1.1 Overview
This chapter sets out the relevant demographic, economic and social inputs along with
estimates for the projected population, households and associated needs relating to
housing during the plan period as set out in Section 1.3. Specifically, this chapter
demonstrates how the Section 28 Guidelines along with the various demographic and
market factors have been considered as part of the assessment of future housing needs
and demands.
3.1.2 Approach
An overview of the process for the HNDA modelling and relevant sections within this
chapter is provided in Table 3-1.
Table 3-1: Approach to the HNDA Modelling and Affordability Assessment
Step Objective Method Relevant subsection
1 Determination of Determination of annual population during
Annual Population the strategy period based on established
Section 3.2.1
Projections projection targets (the latter in this
instance).
2 Determination of Determination of pre-plan total
Housing Supply households based on latest CSO
Targets and completions data and estimation of
Household housing completions prior to plan period.
Demand Sections 3.1.3 and 3.2.2
Determination of plan period housing
supply targets (HST) and annual housing
targets based on Section 28 Guidelines
4 Calculation of Calculation of estimated distribution of
Estimated household disposable incomes for the
Distribution of established deciles (by the CSO) based
Household on the weekly and annualised disposable
Disposable incomes at national level and adjusted for
Incomes the local authorities based on application
of an “inflator” or “deflator” rate.
5 Calculation of Calculation of estimated distribution of
Average Annual annual disposable household incomes per Section 3.2.4
Household decile during the strategy period based on
Disposable Income the preceding step and application of a
Distribution forecast GDP growth rate.
6 Calculation of Calculation of estimated distribution of
Average Monthly monthly disposable household incomes
Household per decile during the strategy period
Disposable Income based on the preceding step and
Distribution application of a forecast GDP growth rate.
Appendix 1 Housing Strategy - 1 June 2022 10
© 2022 KPMG. All rights reserved.
Document classification: KPMG ConfidentialCavan County Council
Cavan HNDA 2022-2028
December 2020
Step Objective Method Relevant subsection
7 Determination of Calculation of the estimated distribution of
Distribution of Total household units for each decile
Anticipated throughout the strategy period as well as
Households the distribution of housing units in the
State from the Household Budget Survey
(by the CSO).
Section 3.2.4
8 Determination of Calculation of the estimated distribution of
Distribution of additional anticipated households
Additional annually during the strategy period as well
Anticipated as the distribution of housing units in the
Households State from the Household Budget Survey
(by the CSO).
9 Calculation of Calculation of projected house price
Projected House bands based on the percentage split of
Price Bands the established (by the DHPLG) eight Section 3.2.6
price bands and a projected annual price
increase or decrease.
10 Calculation of Calculation of the approximate affordable
Mortgage Capacity house price per decile per year based on
of Households the application of the “Annuity Formula”.
This is based on the determination of an
“Affordability Threshold”, a “Loan to Value
Ratio”, an “Annual Percentage Rate
(APR) - Interest Rate”, a “Monthly
Percentage Rate (MPR) - Interest Rate”, Section 3.3.1
and the determination of a “Loan Term
(Years/Months)”.
11 Calculation of Based on the application of the “Annuity
Projected Needs Formula”, calculate the housing
for Ownership affordability for each of the 10 household
deciles.
12 Calculation of Calculation of the households that will not
Projected Needs meet the affordability criteria to privately
for Private Rental rent a home during the plan period with
respect to the number of households that
cannot qualify for a mortgage. Section 3.3.2
13 Calculation of Based on the determination of additional
Projected Social households required, the projected house
(and Affordable) price bands and the housing affordability,
Housing Need calculate the number of households not
meeting the “Affordability Criteria”. This
informs the necessary provision of social
(and affordable) housing units within both
local authorities. Section 3.3.3
14 Historic Data Calculation of historic intercensal change
Analysis and for private household tenure, cohort sizes
Approximate and dwelling type to determine annualised
Sections 3.4.1, 3.4.2 and
Projection of change. This informs the basis of an
3.4.3
Tenure, Size annual rate of change for which additional
Cohort, and anticipated households can be roughly
Dwelling Type.
Appendix 1 Housing Strategy - 1 June 2022 11
© 2022 KPMG. All rights reserved.
Document classification: KPMG ConfidentialCavan County Council
Cavan HNDA 2022-2028
December 2020
Step Objective Method Relevant subsection
forecasted for household tenure, cohort
sizes and dwelling type.
15 Analysis of Single Analysis CSO Granted Permissions data
Rural Dwellings to determine distribution of rural one-off
dwellings. Section 3.4.4
16 Analysis of Analysis of specialist provision County
Specialist Provision Cavan using current and historic waiting
lists by ‘basis of need’ to highlight the
change in trends within the categories of
financial need, disability, homeless or
other need. Section 3.4.5
3.1.3 Section 28 Guidelines on Household Demand
As set out in Section 1.5, this chapter has considered the Section 28 Guidelines provided
by the Department. Specifically, the household demand during the plan period has been
considered during the implementation period of the plan. As such, where 2022 and 2028
are referred to herein this relates to the second half of 2022 and the first half of 2028
only (rather than the full calendar years and this has been indicated by an Asterisk (*)
throughout this chapter).
The Section 28 Guidelines explore the Housing Supply Target in order to establish a
Household Demand during the plan period. This has been modified to reflect the plan
period specifically as presented in Table 3-2 and Table 3-3 respectively.
Table 3-2: Projected Housing Demand in County Cavan for the plan period (Source:
Department, Modified)
Total
2022* – 2028* Description Reasoning
Households
NPF scenario projection for
ESRI NPF 50:50
household demand from the
A Scenario household 4,597
baseline year 2017 to the end of the
demand 2017-2028 H1
plan period (2018 H1)
Housing supply from the baseline
Actual housing supply year to 2020 as well as forecasted
B 941
2017-2022H1 supply to the start of the plan period
(2022 H1)
Part 1
Number of overcrowded, concealed
households and homelessness.
Homeless households
C 46 Overcrowding is based on people
and unmet demand
living in the house compared to the
number of rooms.
Plan housing demand for the plan
D Plan housing demand 3,702 period 2022H1-2028H1 as
determined by A-B+C.
Appendix 1 Housing Strategy - 1 June 2022 12
© 2022 KPMG. All rights reserved.
Document classification: KPMG ConfidentialCavan County Council
Cavan HNDA 2022-2028
December 2020
Cavan County Council qualifies for adjustment to converge with the baseline
Qualification for E because the NPF 50:50 Scenario demand is lower than the Baseline and the
plan period goes beyond the year of convergence.
E Adjustment to facilitate NPF 50:50 and ESRI convergence by 2026 end
ESRI Baseline
ESRI Baseline demand until NPF
E1 household demand 4,554
Convergence year
2017-2026
ESRI NPF 50:50 NPF 50:50 Scenario demand from
E2 Scenario household 630 convergence year to plan period
demand 2027-2028 H1 end
Part 2
Mid-point of ESRI NPF Mid-point of scenarios at
E3 50:50 and ESRI 4,361 convergence year 2026 as
Baseline 2017-2026 determined by ((A-E2) +E1)/2
Adjusted plan housing demand
Adjusted total demand for the plan period 2022H1-
E4 3,996
2017-2028H1 2028H1 as determined by (E2+E3-
B)+C.
Cavan County Council does not qualify for an additional 25% on the basis that
Qualification for F
actual supply (B) is near or exceeds unadjusted demand (D) captured in Part 1.
Item E4 in Table 3-2 and Item E in Table 3-4 (text in bold in both tables) sets out the
housing demand that has been determined through baseline convergence in County
Cavan and as such, the total housing demand over the plan period is determined to be
3,996 households or 666 households per annum.
Table 3-3: Summary of Housing Demand in County Cavan during the plan period
(Source: Department, Modified)
Demand Total Households Annual Households
NPF 50:50 City Scenario plan
3,702 617
period demand
Adjusted demand under Part 2
3,996 666
(E) – Baseline Convergence
Adjusted demand under Part 3 (F) Cavan County Council does not qualify for an additional 25% on the
– Baseline Convergence +25% basis that actual supply is near or exceeds unadjusted demand
captured in Part 1.
Appendix 1 Housing Strategy - 1 June 2022 13
© 2022 KPMG. All rights reserved.
Document classification: KPMG ConfidentialCavan County Council
Cavan HNDA 2022-2028
December 2020
3.2 Key Inputs: HNDA and Affordability Assessment
3.2.1 Future Population
The future population has been determined from the targets as set out in the NPF
Implementation Roadmap. The population over the plan period has been interpolated
between the baseline (2016) target years (2026 and 2031).
The projected population for County Cavan throughout the plan period is outlined in
Table 3-4 (with further details in relation to how this is applied across the tiers of
settlement hierarchy outlined in Section 3.8.1 of the Core Strategy). The population of
County Cavan is projected to increase by 4,730 people during the plan period to a total
of 85,900 by 2028.
Table 3-4: Overview of projected population throughout the plan period
2022 2023 2024 2025 2026 2027 2028
Projected Population 81,170 82,003 82,835 83,668 84,500 85,200 85,900
Growth (absolute) 832 832 832 832 832 832 832
Growth (relative) 1.04% 1.03% 1.02% 1.0% 0.99% 0.83% 0.82%
3.2.2 Future Households
The estimation of the projected number of households was undertaken with respect to
the housing demand during the plan period as set out in the Section 28 Guidelines (i.e.
Table 1 therein by the Department). Specifically, the total housing demand during the
plan period was determined to be 3,996 households and this equates to 666 additional
households per annum during the plan period (with 333 additional households
specifically for 2022 and 2028 as they relate to half years only).
Table 3.5 illustrates the projected housing demand throughout the plan period along with
the annual housing demand for County Cavan.
Table 3-5: Overview of Total and Annual Housing Demand throughout the Plan Period
2022* 2023 2024 2025 2026 2027 2028*
Projected Households 28,173 28,839 29,505 30,171 30,837 31,503 31,836
Growth (absolute) 333 666 666 666 666 666 333
Growth (relative) 1.2% 2.3% 2.3% 2.2% 2.2% 2.1% 1.0%
3.2.3 Economic Outlook
The local and regional economy is a critical facet of the housing market needs and
incomes which can impact on demand and supply. In order to understand the longer-
term economic outlook, particularly in relation to how household incomes may change
over time, forecasted growth rates in relation to Gross Domestic Product (GDP) have
been considered. It should be noted that the bespoke analysis on economic outlook,
income (Refer to Section 3.2.4) and consideration of the macroprudential rules (refer to
Section 3.2.5) was undertaken in October – December 2020 and is based on the
approach as described herein. As such, this is separate to the analysis undertaken by
Appendix 1 Housing Strategy - 1 June 2022 14
© 2022 KPMG. All rights reserved.
Document classification: KPMG ConfidentialCavan County Council
Cavan HNDA 2022-2028
December 2020
the ESRI and Department that has supported the development of the Section 28
Guidelines3.
The following documents have been reviewed as part of this work to understand GDP
growth:
• Economic Research paper published by Davys in May 20204; and
• Summer 2020 Economic Forecast published by the European Union in July
20205;
• Q3 2020 Economic Outlook published by IBEC in October 20206;
• Economic Quarterly published by the ESRI in October 20207;
• Q4 2020 Quarterly Bulletin published by the Central Bank of Ireland in October
20208;
• Budget 2021 published by the Government of Ireland in October 20209; and
• IMF Outlook in October 202010.
Further, it should be noted that this Strategy has been prepared during the COVID-19
pandemic which is ongoing at the time of writing and publication. As such, prioritisation
in relation to future forecasted GDP growth has been given to those data sources that
are reflective of this and the latest economic insight in that regard. The following GDP
growth rates have therefore been applied herein for those reasons as set out in Appendix
4:
• 2020: -3.7% GDP growth (i.e. contraction of the economy) which is the average
of the economic forecasts that have been determined from the average of those
forecasts from Davys, the ESRI, Central Bank, Department of Finance and
European Union that reflect the ongoing COVID-19 pandemic.
• 2021: 3.4% GDP growth which aligns with the latest Davys, Department of
Finance and European Union forecasts (i.e. the only datasets for next year that
reflects the ongoing COVID-19 pandemic).
• 2022: 4.5% GDP growth which aligns with the Department of Finance forecast11
• 2023: 3.5% GDP growth which aligns with the Department of Finance forecast
3 The economic analysis undertaken by the ESRI and the Department was not made available during the
preparation of this Housing Strategy.
4 https://static.rasset.ie/documents/news/2020/05/new-econ-forecast-may-27th.pdf
5https://ec.europa.eu/info/business-economy-euro/economic-performance-and-forecasts/economic-
forecasts/summer-2020-economic-forecast-deeper-recession-wider-divergences_en
6 https://www.ibec.ie/influencing-for-business/economy-and-tax/quarterly-economic-outlook-q3-2020
7 https://www.esri.ie/system/files/publications/QEC2020AUT_0.pdf
8https://www.centralbank.ie/publication/quarterly-bulletins/quarterly-bulletin-q4-
2020?utm_medium=website&utm_source=CBI-homepage&utm_campaign=qb4&utm_content=44110
9https://www.gov.ie/en/speech/063d4-budget-speech-by-the-minster-of-finance-paschal-
donohoe/#macroeconomic-outlook
10 https://www.imf.org/en/Countries/IRL#countrydata
11 This forecast was issued by the Department of Finance in advance of the COVID-19 pandemic;
however, it is considered reflective of their anticipated return to pre-pandemic levels of output as set out in
the April 2020 document from the Department of Finance.
Appendix 1 Housing Strategy - 1 June 2022 15
© 2022 KPMG. All rights reserved.
Document classification: KPMG ConfidentialCavan County Council
Cavan HNDA 2022-2028
December 2020
• 2024: 2.8% GDP growth which aligns with the Department of Finance forecast12.
• 2025 onwards: 2.5% GDP growth which aligns with the Department of Finance
forecast.
3.2.4 Income Analysis
Disposable income is the amount of income, after tax is deducted, that is available for
spending and saving. It functions as an important measure of the ability of a household
to purchase their own home (i.e. housing affordability). The weekly and annual
disposable incomes at national level from the CSO’s Household Budget Survey (from
2015-2016) have been adjusted to local authority level based on application of
“inflator/deflator” rate. The same methodology was applied separately to the average
annual disposable incomes of households to determine mortgage capacity given Central
Bank Rules (refer to Section 3.2.5).
The Average Annual Disposable Income for County Cavan from the CSO’s County
Incomes and Regional GDP was €17,802, therefore a county deflator of 0.828 has been
applied (on the basis of a national average annual disposable income of €21,495)13. The
Average Annual Gross Income for County Cavan from the CSO’s County Incomes and
Regional GDP was €23,925, therefore a county deflator of 0.818 has been applied (on
the basis of a national average annual disposable income of €29,239)14.
As noted above, disaggregation into ten income segments or 'deciles' has been
undertaken to represent the proportion of households in County Cavan within each decile
at the time of the survey. Table 3.6 indicates that in 2017 after taxes, about one third of
the households in County Cavan (i.e. the first three deciles) have an average annual
disposable income of up to €20,384 or the equivalent of €1,669 per month.
12 The LTV limit requires one to have a minimum deposit before you can get a mortgage. First-time buyers
are allowed up to 90% LTV, meaning they are required to provide a minimum deposit of 10% upfront for
any property.
13 The measure of price inflation/deflation in an area (i.e. County Cavan in this instance), relative to the
national measure at that time
14 Section 93 of the Planning and Development Act 2000, defines 'affordability' as "a person who is in need
of accommodation and whose income would not be adequate to meet the payments of a mortgage for the
purchase of a house to meet his or her accommodation needs because the payments calculated over the
course of a year would exceed 35% of that person's annual income net of income tax and pay related
social
insurance..."
Appendix 1 Housing Strategy - 1 June 2022 16
© 2022 KPMG. All rights reserved.
Document classification: KPMG ConfidentialCavan County Council
Cavan HNDA 2022-2028
December 2020
Table 3-6: Calculation and distribution of weekly and annual household disposable incomes in County Cavan (Source: CSO,
Modified)
Average Average Assumed Adjusted
Average Cavan Average
Weekly Weekly Percentage Annual Average Percentage of
Annual Cavan Annual
Disposable Disposable Change from Percentage Weekly Households in
Income Range Disposable County Disposable
Income (State) Income (State) 2009-2010 to Income Disposable Each Category
Income (State) Deflator Income (€)
(€) (2009- (€) (2015- 2015-2016 Increase from Income (State) (State)
(€) (2017) (2017)
2010) 2016) 2010 to 2016 (€) (2017)
1st Decile 188.91 197.40 4.5% 0.90% 199.17 9.83% 10,357.06 0.828 8,577.55
2nd Decile 300.98 324.40 7.8% 1.56% 329.45 10.57% 17,131.32 0.828 14,187.88
3rd Decile 431.28 465.86 8.0% 1.60% 473.33 10.47% 24,613.19 0.828 20,384.23
4th Decile 549.20 593.56 8.1% 1.62% 603.15 10.44% 31,363.73 0.828 25,974.92
5th Decile 669.46 725.85 8.4% 1.68% 738.08 10.25% 38,380.05 0.828 31,785.73
6th Decile 802.56 865.88 7.9% 1.58% 879.54 9.94% 45,736.24 0.828 37,878.00
7th Decile 972.03 1,026.46 5.6% 1.12% 1,037.96 9.62% 53,973.69 0.828 44,700.12
8th Decile 1,183.82 1,215.55 2.7% 0.54% 1,222.07 9.65% 63,547.44 0.828 52,628.94
9th Decile 1,472.66 1,473.25 0.0% 0.01% 1,473.37 9.61% 76,615.14 0.828 63,451.39
10th Decile 2,289.38 2,229.05 -2.6% -0.53% 2,217.30 9.62% 115,299.70 0.828 95,489.31
Total 5.0% 1.0% 100.00%
Appendix 1 Housing Strategy - 1 June 2022 17Cavan County Council
Cavan HNDA 2022-2028
December 2020
To inform the forward projection of affordability in County Cavan during the plan period,
the baseline income has been inflated annually using forecasted growth rates in relation
to Gross Domestic Product (GDP). The forecasted GDP rates have considered the
household disposable incomes for 2016 from the CSO’s Household Budget Survey along
with historic and the latest forecasted GDP growth rates during the plan period (Refer to
Section 3.2.3 for further detail).
Based on the current economic outlook and as described in detail in Appendix 4, GDP
growth of 8.2% and 5.5% was considered during 2018 and 2019 respectively whilst 3.7%
decline is expected during 2020, 3.4% growth in 2021 and 4.5% GDP growth in 2022.
The key outputs of this (i.e. the forecasted annual average disposable household income
during the plan period) are shown in Table 3.7. A notable difference in average annual
disposable incomes across each of the 10 deciles is evident for each year during the
plan period.
Table 3-7: Average annual household disposable incomes per decile in County Cavan
(Source: CSO, Modified)
Year 2022 2023 2024 2025 2026 2027 2028
% Growth 4.50% 3.50% 2.80% 2.60% 2.60% 2.60% 2.60%
1st Decile €10,188 €10,545 €10,840 €11,122 €11,411 €11,708 €12,012
2nd Decile €16,852 €17,442 €17,931 €18,397 €18,875 €19,366 €19,869
3rd Decile €24,212 €25,060 €25,761 €26,431 €27,118 €27,824 €28,547
4th Decile €30,853 €31,933 €32,827 €33,680 €34,556 €35,455 €36,376
5th Decile €37,755 €39,076 €40,171 €41,215 €42,287 €43,386 €44,514
6th Decile €44,991 €46,566 €47,870 €49,115 €50,392 €51,702 €53,046
7th Decile €53,095 €54,953 €56,492 €57,961 €59,468 €61,014 €62,600
8th Decile €62,513 €64,701 €66,512 €68,241 €70,016 €71,836 €73,704
9th Decile €75,367 €78,005 €80,189 €82,274 €84,414 €86,608 €88,860
10th Decile €105,634 €109,331 €112,392 €115,315 €118,313 €121,389 €124,545
Given the context provided and information as outlined above (i.e. Calculation of Average
Annual Household Disposable Income Distribution), the incomes have been scaled to
provide the monthly (rather than annual) estimates of disposable income per household
in each decile during the plan period as described in Table 3.8.
Table 3-8: Average monthly household disposable incomes per decile in County Cavan
(Source: CSO, Modified)
Year 2022 2023 2024 2025 2026 2027 2028
1st Decile €849 €879 €903 €927 €951 €976 €1,001
2nd Decile €1,404 €1,454 €1,494 €1,533 €1,573 €1,614 €1,656
3rd Decile €2,018 €2,088 €2,147 €2,203 €2,260 €2,319 €2,379
4th Decile €2,571 €2,661 €2,736 €2,807 €2,880 €2,955 €3,031
5th Decile €3,146 €3,256 €3,348 €3,435 €3,524 €3,616 €3,710
6th Decile €3,749 €3,881 €3,989 €4,093 €4,199 €4,308 €4,421
7th Decile €4,425 €4,579 €4,708 €4,830 €4,956 €5,084 €5,217
8th Decile €5,209 €5,392 €5,543 €5,687 €5,835 €5,986 €6,142
9th Decile €6,281 €6,500 €6,682 €6,856 €7,034 €7,217 €7,405
10th Decile €8,803 €9,111 €9,366 €9,610 €9,859 €10,116 €10,379
Appendix 1 Housing Strategy - 1 June 2022 18
© 2022 KPMG. All rights reserved.
Document classification: KPMG ConfidentialCavan County Council
Cavan HNDA 2022-2028
December 2020
3.2.5 Central Bank Rules and Mortgage Capacity
The Central Bank have put measures in place that restrict the maximum quantum of
funds that consumers can borrow to purchase a home. These measures have been set
through the implementation of loan-to-value (LTV)15 and loan-to-income (LTI)16 limits. It
has therefore been analysed whether households could qualify for a mortgage under
these rules that would enable them to purchase a house in the lowest price band.
The key variables used to determine whether households in a decile can qualify for a
mortgage are therefore:
• LTV ratio of 0.90;
• a maximum LTI ratio of 3.5; and
• the upper value of the first house price band for that year.
As such if a household does not have sufficient income to meet the Central Bank rules
(i.e. 3.5 times their gross income is less than 90% of the value of purchase a house in
the lowest projected price band for that year), they do not qualify for a mortgage that
would enable them to purchase a home. Mortgage capacity (i.e. maximum LTI based on
gross household income) is illustrated per decile per year during the plan period in Table
3-9.
Table 3-9: Mortgage capacity of households per decile (€) in County Cavan based on
Central Bank Rules where red highlights insufficient income to meet these rules (Source:
CSO, Central Bank of Ireland, Modified)
Year 2022 2023 2024 2025 2026 2027 2028
1st Decile € 35,335 € 36,572 € 37,596 € 38,573 € 39,576 € 40,605 € 41,661
2nd Decile € 59,113 € 61,182 € 62,895 € 64,530 € 66,208 € 67,929 € 69,696
3rd Decile € 85,751 € 88,753 € 91,238 € 93,610 € 96,044 € 98,541 €101,103
4th Decile €112,213 €116,140 €119,392 €122,496 €125,681 €128,949 €132,301
5th Decile €142,630 €147,622 €151,755 €155,701 €159,749 €163,903 €168,164
6th Decile €176,342 €182,514 €187,625 €192,503 €197,508 €202,643 €207,912
7th Decile €215,422 €222,962 €229,205 €235,164 €241,278 €247,552 €253,988
8th Decile €262,693 €271,887 €279,500 €286,767 €294,223 €301,872 €309,721
9th Decile €335,045 €346,771 €356,481 €365,749 €375,259 €385,016 €395,026
10th Decile €549,005 €568,220 €584,130 €599,317 €614,900 €630,887 €647,290
15 The LTV limit requires you to have a minimum deposit before you can get a mortgage. First-time buyers
are allowed up to 90% LTV, meaning they're required to provide a minimum deposit of 10% upfront for any
property.
16 The LTI limit restricts the amount of money you can borrow to a maximum of 3.5 times your gross
income.
Appendix 1 Housing Strategy - 1 June 2022 19
© 2022 KPMG. All rights reserved.
Document classification: KPMG ConfidentialYou can also read