CCAA STATISTICAL BULLETIN 2018
←
→
Page content transcription
If your browser does not render page correctly, please read the page content below
VIL AVIATION
                                  CI             A
                              N

                          O

                                                  UT
                        RO

                                                    HO
                    CAME

                                                      RITY
                                                  UE
                      AU
                         TO
                                                      I

                                                 Q
                              RI                 UT
                                   TE
                                        AERONA

CCAA STATISTICAL BULLETIN

2018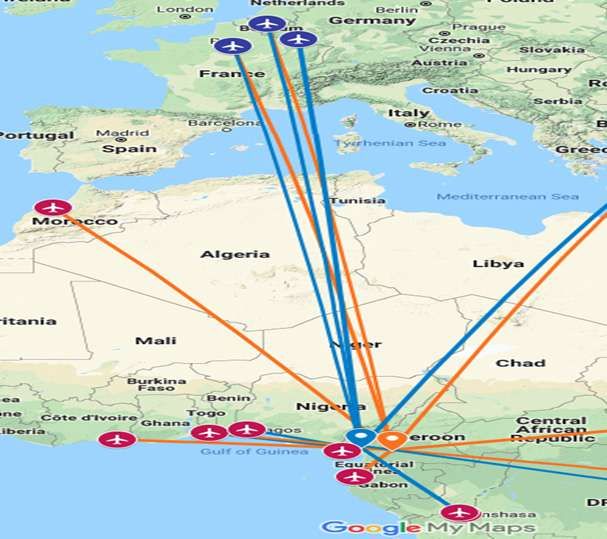
VIL AVIATION
                   CI             A
               N
           O

                                    UT
         RO

                                      HO
     CAME

                                        RITY
                                    UE
       AU

          TO
                                        I
                                   Q

               RI                   T
                    TE
                         AERON   AU

STATISTICAL BULLETIN
      CCAA N°8

CCAA STATISTICAL BULLETIN 2018 EDITION

                           OUR MOTTO

                           A : ACTION

                             E : EQUITY
                                       VIL AVIATION
                                     CI             A
                                 N
                             O

                                                    UT
                           RO

                    R : RESPONSABILITY
                                                      HO
                       CAME

                                                        RITY
                                                    UE
                         AU

                            TO
                          I :RINTEGRITY       I
                                                   Q

                              IT E       A UT
                                   AERON

                        E : TEAM SPIRIT

                        I : INNOVATIVE

CAMEROON CIVIL AVIATION AUTHORITY                              i
CCAA STATISTICAL BULLETIN 2018 EDITION

REPUBLIQUE DU CAMEROUN                                                   VIL AVIATION
                                                                                                                REPUBLIC OF CAMEROON
                                                                       CI
    Paix - Travail - Patrie                                        N                  A                          Peace - Work - Fatherland

                                                               O

                                                                                       UT
                                                             RO
     ..............................                                                                                 ..............................

                                                                                         HO
                                                         CAME
   AUTORITE AERONAUTIQUE                                                                                     CASMEROON CIVIL AVIATION AUTHORITY

                                                                                           RITY
        ..............................                                                                              ..............................

                                                                                       UE
                                                           AU
                                                              TO
                                                                                           I

                                                                                      Q
                                                                   RI                 UT
                                                                        TE
                                                                             AERONA

                                                         FOREWORD

       In the interest of defining the impact of air transport in the economic de-
      velopment of Cameroon in general, and in the perspective of achieving the
      performance objectives of our sector of activity, the CCAA produces annually
      a statistical bulletin elaborated after exploitation of data collected at the air-
      ports of Cameroon.
                                                 VIATI Statistical Bulletin contains infor-
                                             IL ACCAA’s
       In this regard, the 2018 edition ofIVthe
                                        C             ON
      mation on aircraft movements,Npassenger flows      and
                                                         A   volume of cargo recorded
      under Cameroon skies during the year 2018.
                                                     O

                                                                                                  UT
                                                   RO

                                                                                                    HO

        Like the previous editions, this one is in line with our ongoing goals of reporting
                                               CAME

      on the evolution of air transport through a broad set of data needed to unders-
                                                                                                      RITY

      tand the air transport sector performance over the period 2016-2018.
        In view of the analyzes carried out, there is an increasing trend during the
      triennium, despite a slight deceleration in 2018. In this respect, we can say that
                                                                                                  UE
                                                 AU

      the air transport sector is doing
                                     TO well
                                                          I
                                                                                                  Q

                                        R I my specialU Tthanks
        Above all, I would like to express                       to all the partners who,
                                           TE       A
                                              AERON
      through the information provided, made this publication possible. My encou-
      ragement also goes to the agents who every day collect information on the
      airport platforms, as well as those of the General Directorate who, through de-
      dication to work, made this publication possible.
       My wish is that this bulletin will be useful to all the administrations that will make
      use of it and contributes to the achievement of our growth objectives.

         							 THE DIRECTOR GENERAL,

         					                                                         Mrs. AVOMO ASSOUMOU Paule Epse KOKI

          ii                                                                                   CAMEROON CIVIL AVIATION AUTHORITY
CCAA STATISTICAL BULLETIN 2018 EDITION

                             PUBLICATION TEAM

   Publication Director :

   					- Mrs. AVOMO ASSOUMOU Paule épse KOKI

   Publication Advisor :

   					- Mr. ALLABIRA MAMADOU

   Editorial Director :

   					- Mr. AKKUM Ritzentelar

   Editor-in-Chief :

   					- Mr.      AVIATITheodore
               VILPENYIN
             CI          ON
           N                A
   Editor:
                                  O

                                                 UT
                                RO

                                                   HO
                            CAME

   					- Mrs. GAMGO Camille Épse BILÉ
                                                     RITY

   Technical assistant:

   					- Mr. FOKOU KOUTSING Hervé Narcisse
                                                 UE
                              AU

   Design/Printing:              TO
                            I
                                                Q

                         UT           RI
          TE           A
              A E R O N SERVICES
   					- Ets SALEOMIR

  Conscious of the fact that this publication is the result of multiple contribu-
tions, the authors would like to thank all those who made this publication pos-
sible thanks to their criticism and valuable advice.
 This Bulletin contains the most recent statistics of the civil aviation sector in
Cameroon for the year 2018 at the time of writing.
 For information regarding the contents of this publication, please contact the
Prospective Service of the Air Transport Division at the CCAA.

CAMEROON CIVIL AVIATION AUTHORITY                                             iii
CCAA STATISTICAL BULLETIN 2018 EDITION

                                            TABLE OF CONTENTS
FOREWORD              ..........................................................................................................................ii
PUBLICATION TEAM .............................................................................................................iii
TABLE OF CONTENTS.......................................................................................................... ....iv
LIST OF TABLES.........................................................................................................................v
LIST OF GRAPHICS..................................................................................................................v
ABSTRACT...............................................................................................................................vi
I.          AIR TRAFFIC PERFORMANCE IN CAMEROON IN 2018.............................................1
       1.   Aircraft movements ..................................................................................................1
       2.   Passenger traffic.........................................................................................................2
       3.   Freight and mail traffic...............................................................................................4
II.         EVOLUTION OF AIR TRANSPORT IN THE TRIENNIUM 2016-2018................................5
A.          Evolution of aircraft movements...............................................................................5
       1.   Aircraft movements according to the direction of flights......................................5
       2.   Aircraft movements per type Iof  L AVIATIO
                                          VIflight......................................................................6
                                       C                     N
       3.   Aircraft movements per route                        A
                                     N segment...................................................................7
                                                 O

                                                                                        UT
                                               RO

B.          Evolution of passenger traffic....................................................................................8
                                                                                          HO
                                           CAME

       1.   Passenger traffic on arrival and departure.............................................................8
                                                                                            RITY

       2.   Passenger traffic by route segment..........................................................................9
       3.   Passenger traffic per airline....................................................................................12
C.          Evolution of freight and mail traffic.........................................................................13
                                                                                        UE
                                               AU

       1.                             T arrival and departure of planes.................................14
            Freight and mail traffic on
                                                      O                                  I
                                                                                      Q

                                                          R      T
                                          IT Eof flight.................................................................14
       2.   Freight and mail traffic by type                AU    AERON
       3.   Freight and mail traffic by route segment .............................................................16
III.        PERFORMANCE OF CAMEROONIAN AIRPORTS......................................................16
       1.   Airport performance in terms of aircraft movements...........................................17
       2.   Airport performance according to passenger flows............................................18
       3.   Airport performance according to freight and mail traffic..................................20
APPENDIX..............................................................................................................................22
A.          Evolution of airport traffic in Cameroon between 2017 and 2018.......................22
B.          International passenger traffic per airline via the international airports of Douala
and Yaoundé-Nsimalen in 2018........................................................................................23
C.          Breakdown of traffic by airport per type of flight in 2018....................................24
D.          Breakdown of airport traffic per route segment in 2018....................................25
E.          Evolution of airport traffic in Cameroon between 2016 and 2018.......................26
F.          Domestic lines by airport in Cameroon.................................................................27
G.          Direct lines served from Cameroon........................................................................28

      iv                                                                          CAMEROON CIVIL AVIATION AUTHORITY
CCAA STATISTICAL BULLETIN 2018 EDITION

                                                      LIST OF TABLES
Table 1 : Average number of passengers per flight according to the airport and the
nature of the flight in 2018.... ................................................................................................3

Table 2 : Passenger traffic on departure and arrival between2016 and 2018................9

Table 3 : Average number of passengers transported per route segment between 2016
and 2018.................................................................................................................................11

Table 4 : Passenger Traffic by Route Segment Between 2016 and 2018........................11

Table 5 : International passenger traffic transported by airline via Douala and Yaoundé-
Nsimalen international airports in 2018……………………………............…………………..12

Table 6 : Average Number of Passengers per Flight by Airport and Route Segment in
                                                            VI     L AVIA   TIO
                                                        CI
2018........................................................................................................................................19
                                                                                  N
                                                                                         A
                                                         N
                                                  O

                                               LIST OF GRAPHICSS
                                                                                         UT
                                                RO

                                                                                           HO
                                            CAME

                                                                                             RITY

Chart 1 : Breakdown of aircraft movements per type of flight in 2018............................2
Chart 2 : Distribution of the number of passengers according to their nature in 2018.......2
Chart 3 : Distribution of Freight and Mail per route Segment in 2018 (tons).....................4
                                                                                          UE
                                                AU

Chart 4 : Evolution of aircraft movements
                                 T        at arrival and departure of flights between
                                                       O                                  I
                                                                                       Q

                                              RI                             T
                                                  T             E AERONAU
2016 and 2018.........................................................................................................................6
Chart 5 : Evolution of aircraft movements per type of flight between 2016 and 2018.........6
Chart 6 : Evolution of aircraft movements per route segment from 2016 to 2018..........7
Graphic 7 : Evolution of departing and arriving passenger traffic between 2016 and 2018
.................................................................................................................................................. 9
Chart 8 : Evolution of passenger traffic by route segment between 2016 and 2018.........10
Chart 9 : Evolution of freight and mail traffic at departure and arrival between 2016 and
2018........................................................................................................................................14
Chart 10 : Distribution of Freight and Mail per flight type in 2018....................................15
Chart 11 : Evolution of freight and mail traffic by routed segment between 2016 and
2018........................................................................................................................................16
Chart 12 : Evolution of airplane movements by airports between 2016 and 2018.......17
Chart 13 : Evolution of passenger flow per airport between 2016 and 2018.................18
Chart 14 : Evolution of airport freight and mail traffic between 2016 and 2018.....................21

CAMEROON CIVIL AVIATION AUTHORITY                                                                                                             v
CCAA
                CCAA STATISTICAL
                     STATISTICAL BULLETIN
                                 BULLETIN 2018
                                          2018 EDITION
                                               EDITION

                                    ABSTRACT
  It has been observed that air traffic improved during the triennium 2016-2018.
In fact, the number of passengers increased from 1,374,179 to 1,911,114 divi-
ded between 1,069,967 international passengers, 452,350 passengers on do-
mestic routes and 388,797 passengers in transit. This represents an average an-
nual evolution of around 17.93%.

 Several factors contributed to this development, including the development
of new domestic routes that resulted in a better aircraft load factor, which in-
creased from an average of 49 passengers in 2017 to 57 passengers in 2018.

  In the same light, the positive evolution of passenger traffic is due to the deve-
lopment of internal lines and the improvement in the respect for schedules by
the national airline Camair-Co, the development of airport infrastructure and
equipment, the improvement of civil       AVIATI safety and security measures as
                                      VIL aviation
                                    CI           ON
                                  N                 A
well as the signing of numerous air agreements whose exploitation has contri-
                                O

                                                    UT
                              RO

buted to the development of the flow of passengers on the international and
                                                      HO
                          CAME

national network.
                                                        RITY

  This increase is reflected, among other things, by a positive evolution in the
number of passengers arriving and departing, which rose respectively from
                                                    UE

787,653 in 2016 to 1,105,686 inT 2018 for the former and 586,526 in 2016 to 805,428
                            AU

                                O                     I
                                                   Q

in 2018 for the latter. The total Rnumber
                                    IT E           U T passengers increased from
                                            of terminal
                                               N A
1,148,056 in 2016 to 1 522 317 in 2018.A E R O

  On the other hand, freight and mail transported to/from Cameroon over the
period 2016-2018 had a downward trend, with an average annual growth rate
of -06.49%. Indeed, after having significantly depreciated over the 2016-2017
period (22,372.95 tons), i.e. -12.28% compared to the 2016 figures (25,505.62),
the growth rate of the quantity of freight and mail dropped again between
2017-2018 (22,301.26 tons) by a rate equal to -00.32%.

   From the analysis of the performances of the various airports, it is clear, among
other things, that the Douala airport is the most sollicited for international flights
and freight transport, that of Yaoundé-Nsimalen the most prolific for national
flights and that the airport of Maroua-Salak records the highest load factors.

 vi                                              CAMEROON CIVIL AVIATION AUTHORITY
CCAA STATISTICAL BULLETIN 2018 EDITION
I. AIR TRAFFIC PERFORMANCE IN CAMEROON IN
2018
The data on the movement of aircraft, as well as those on the movement of
persons and goods in 2018, show that the airline sector is performing.
VIL AVIATION
CI A
N
O
UT
RO
HO
CAME
RITY
UE
AU
1. Aircraft movements
TO
I
Q
RI UT
TE A
In terms of aircraft movement, 33,634 ON
A E Rmovements were recorded at Came-
roonian airports, a daily average of 92 movements with an hourly average of
02 aircraft movements per hour. However, these trends indicate a lower per-
formance of national airports compared to international airports. As an illustra-
tion, the Bafoussam and Ngaoundéré airports recorded an average of 01 daily
movements, compared with 47 and 28 daily movements respectively for the
Douala and Yaoundé-Nsimalen airports, all types of flights combined.
During this period, aircraft movements in Cameroon were largely dominated
by scheduled commercial flights, which recorded 26,277 aircraft movements,
followed respectively by non-commercial and non-scheduled commercial
flights, which each accounted for 5,698 and 1,659 movements.
According to data from ASECNA, about 27,886 overflights were recorded in
Cameroon in 2018.
CAMEROON CIVIL AVIATION AUTHORITY 1CCAA STATISTICAL BULLETIN 2018 EDITION
Chart 1 : Breakdown of aircraft movements per type of flight in 2018Fulego et;
Source : CCAA.
2. Passenger traffic VIL AVIATION
CI A
N
According to the traffic of persons, the year 2018 recorded 1,911,114
O
UT
RO
passengers distributed as follows:
HO
CAME
RITY
- 1,069,967 passengers for international flights ;
- 452,350 passengers for domestic flights ;
- 388,797 passengers in transit.
UE
AU
TO of passengers according to their nature in 2018
Chart 2 : Distribution of the number I
Q
RI UT
TE A
AERON
Source : CCAA.
Almost all of this traffic is made up of passengers on commercial flights
(98.98%); which consist mainly of passengers on scheduled commercial flights
(97.83%) and non-scheduled commercial flights (01.15%). Passengers on non-
commercial flights account for a commercial flights account for a very margi-
nal share of all persons transported by air (01.02%).
2 CAMEROON CIVIL AVIATION AUTHORITYCCAA STATISTICAL BULLETIN 2018 EDITION
From these data, it appears that an average of 57 passengers are transported
per aircraft movement at the national level. This trend varies considerably when
assessed by airport and type of flight. As an illustration, the following passenger
averages are observed for the following airports:
- 98 passengers in Maroua-Salak against 27 passengers in Bafoussam for
regular commercial flights;
- 34 passengers in Garoua against 09 passengers in Douala for non-
scheduled commercial flights;
- 13 passengers in Ngaoundéré against 03 passengers in Bamenda for non-
commercial flights.
Table 1 : Average number of passengers per flight according to the airport and the
nature of the flight in 2018
Airports Nature of Flight Aircraft Passenger Traffic Average
Movements Passenger Number
Regular Commercial 480 12 790 27
Bafoussam Non Regular Commercial 12 84 7
Non Commercial
VIL AVIATION72 503 7
Total CI 564 A 13 377 24
N
O
Regular Commercial 387 10 715 28
UT
RO
Non Regular Commercial 4 4 1
HO
CAME
Bamenda
Non Commercial 308 1 027 3
RITY
Total 699 11 746 17
Regular Commercial 15 771 1 060 237 67
Non Regular Commercial 215 2 035 9
Douala
Non Commercial 1 351 298 0
UE
AU
Total TO 17 337 1 062 570 61
TI
Q
RI U
Regular Commercial TE A570 52 630 92
AERON
Non Regular Commercial 130 4 383 34
Garoua
Non Commercial 2 208 57 0
Total 2 908 57 070 20
Regular Commercial 254 24 825 98
Non Regular Commercial 427 7 181 17
Maroua-Salak
Non Commercial 990 12 360 12
Total 1 671 44 366 27
Regular Commercial 243 13 342 55
Ngaoundéré Non Regular Commercial 24 61 3
Non Commercial 128 1 714 13
Total 395 15 117 38
Regular Commercial 8 572 695 117 81
Yaoundé- Non Regular Commercial 847 8 136 10
Nsimalen
Non Commercial 641 3 615 6
Total 10 060 706 868 70
CAMEROON CIVIL AVIATION AUTHORITY 3CCAA STATISTICAL BULLETIN 2018 EDITION
Airports Nature of Flight Aircraft Passenger Average
Movements Traffic Passenger Number
Regular Commercial 26 277 1 869 656 71
General Non Regular Commercial 1 659 21 884 13
Non Commercial 5 698 19 574 3
Total 33 634 1 911 114 57
Source : CCAA. 2018
3. Freight and mail traffic
Freight and mail traffic recorded 22,301.26 tonnes in 2018. This flow is largely
dominated by those originating from the international route segment beyond
the Central African Economic and Monetary Community (CEMAC) which ac-
counts for 92.22% of the total amount of freight and mail. The traffic of frei-
ght and mail transported at the national level and towards CEMAC represent
06.21% and 01.57% respectively. IVIL AVIATIO
C N
N A
O
UT
RO
Chart 3 : Distribution of Freight and Mail per route Segment in 2018 (tons)
HO
CAME
RITY
UE
AU
TO
TI
Q
RI U
TE
AERONA
Source : CCAA.
On the other hand, freight and mail traffic per aircraft movement averages
00.66 tonnes at the general level, largely below the average amount of freight
and mail transported by aircraft via the international route beyond CEMAC
(01.82 tonnes) and above those transported by aircraft movement at national
level (00.09 tonnes) and to/from CEMAC (00.05 tonnes).
4 CAMEROON CIVIL AVIATION AUTHORITYCCAA STATISTICAL BULLETIN 2018 EDITION
II. EVOLUTION OF AIR TRANSPORT IN THE TRIENNIUM
2016-2018
The analysis of the evolution of the statistics of the sector over the period 2016-
2018, in connection with the movements of aircraft, people and goods is
necessary to identify the improvement on the air traffic performance over time.
A. Evolution of aircraft movements
The movement of aircraft in Cameroon during the last three (03) years (2016-
2018), analyzed under the prism of landings and takeoffs, the type of flight and
the route segments, makes it possible to highlight the explanatory factors of
the good performances recorded by the evolution of flights over the period
designated above.
VIL AVIATION
CI A
N
O
UT
RO
HO
CAME
RITY
UE
AU
TO
TI
Q
RI U
TE
AERONA
1. Air craft movements according to the direction of
flights
Between 2016 and 2018 aircraft movements recorded an average annual
growth rate of 09.44%, from 28,081 movements in 2016 to 33,634 movements in
2018 (landings and take-offs). However, there is a deceleration during the last
period, between 2017-2018, which recorded an annual growth rate of 01.08%.
CAMEROON CIVIL AVIATION AUTHORITY 5CCAA STATISTICAL BULLETIN 2018 EDITION
Chart 4 : Evolution of aircraft movements at arrival and departure of flights between
2016 and 2018
Source : CCAA.
The good performance observed in the movements of flights in Cameroon
VIL AVI2017-2018,
at the order of 01.08% over the Iperiod ATIO
N
can be attributed to the
C
N
growth of non-commercial flights, which over Athe same period recorded an
O
UT
RO
average growth rate of 71.27%, from 3,327 flights to 5,698 flights. This good
HO
CAME
performance, coupled with that already recorded during the previous period
RITY
(18.50% between 2016 and 2017), brings the average annual growth rate of
aircraft movements to 09.44%.
Chart 5 : Evolution of aircraft movements per type of flight between 2016 and 2018
UE
AU
TO
TI
Q
RI U
TE
AERONA
Source : CCAA.
Further analysis of this evolution during the period 2017-2018 reveals that
while the reduction in the number of domestic scheduled commercial flights
and non-scheduled commercial flights is leading this growth, this is driven by
the dynamism of non-commercial flights and international flights.
6 CAMEROON CIVIL AVIATION AUTHORITYCCAA STATISTICAL BULLETIN 2018 EDITION
On average, the 92 daily movements of airplanes recorded at Cameroon
airports can be broken down into 05 non-scheduled commercial flights, 16
non- commercial flights and 72 commercial flights, for Yaoundé-Nsimalen and
Douala international airports.
The upsurge of non-commercial flights in connection with the crises and eco-
nomically stricken areas (Far-North, North-West and South-West) is linked mostly
to humanitarian and military activities, which justifies the evolution exponential
growth in such flights.
3. Aircraft movements per route segment
Despite the slight decrease in the number of domestic flights in the last period
2017-2018 (-10.71%), the good performance all flights is due to the increase in
the number of international flights to both the CEMAC (07.31%) beyond CE-
MAC (17.80%).
The poor performance of domestic VIATI this past year contributed to the
VIL Aflights
CI ON
drop in the average performanceN A
of flights recorded so far. Indeed, aircraft
O
movements rose by 18.50% between 2016-2017 and 01.08% between 2017-
UT
RO
HO
2018, which translates into an average annual growth rate of 09.44% over the
CAME
RITY
triennium 2016-2018.
Chart 6 : Evolution of aircraft movements per route segment from 2016 to 2018
UE
AU
TO
TI
Q
RI U
TE
AERONA
Source : CCAA.
In general, an average of 42 daily aircraft movements was recorded at the
national level for domestic flights, 19 aircraft movements to/ from CEMAC and
31 aircraft movements for the international network beyond CEMAC. The hour-
ly average of flights for both domestic and international flights represent 02
movements per hour.
CAMEROON CIVIL AVIATION AUTHORITY 7CCAA STATISTICAL BULLETIN 2018 EDITION
The growth observed in the movements of international flights can be attri-
buted to the special air services and extra cargo frequencies operated by cer-
tain regional carriers like Ethiopian Airline and Kenya Airways at the Yaoun-
dé-Nsimalen airport. On the other hand, the contraction observed in domestic
flights can partly be explained by the difficulties encountered during the period
considered by the national airline Camair-Co.
B. Evolution of passenger traffic
Passenger traffic experienced a boom in the course of 2016 to 2017. However,
the lower traffic performance observed over the 2017-2018 period compared
to the previous year resulted in a decrease in the growth rate of the number
of people who took the plane as a means of transportation. This evolution of
passenger flows in Cameroon over the 2016-2018 triennium can best be un-
derstood from an analysis of the nature of passengers, the movement of air-
craft, types of flights, route segments as well as per the airline company.
VIL AVIATION
CI A
N
O
UT
RO
HO
CAME
RITY
UE
AU
TO
TI
Q
RI U
TE
AERONA
1. Passenger traffic on arrival and departure
In 2018, passenger traffic registered a general increase of 10.80% over the
previous year, reaching 1 911 114 passengers in 2018, compared to 1 724 845
passengers carried in 2017. This increase, although considerable, is much lower
than the previous year’s growth of 25.52% (2016-2017). This translates into an
average annual growth rate of 17.93% for the last triennium. However, the
8 CAMEROON CIVIL AVIATION AUTHORITYCCAA STATISTICAL BULLETIN 2018 EDITION
exponential evolution between 2016 and 2017 resulted from the positive situa-
tion regarding the Women AFCON organized in Cameroon in 2017.
Graphic 7 : Evolution of departing and arriving passenger traffic between 2016 and
2018
Source : CCAA.
An in-depth analysis of the positive trend in the number of people using the
airplane as a means of transport reveals that it is equally due to the significant
contribution of the number of passengers in transit.
VIL AVIATION
CI A
N
Table 2 : Passenger traffic at departure and arrival between2016 and 2018
O
UT
RO
Year Nature of passenger Landings Take-off Total
HO
CAME
Direct 525 414 586 526 1 111 940
RITY
2016 In transit 262 239 0 262 239
Total 787 653 586 526 1 374 179
2017 Direct 653 234 730 652 1 383 886
In transit 340 959 0 340 959
UE
AU
Total
TO 994 193
TI
730 652 1 724 845
Q
RI U
T E 716 889
2018 Direct AERONA 805 428 1 522 317
In transit 388 797 0 388 797
Total 1 105 686 805 428 1 911 114
Source : CCAA.
Indeed, when we proceed to a decomposition of the passengers according
to their nature, we note that the evolutionary tendency of the passengers consi-
dered at landing is similar to that of the passengers taken in their entirety. The
average annual growth rate for passengers in transit is 21.76% for the 2016- 2018
triennium, compared to 30.02% and 14.03% respectively for the 2016-2017
and 2017-2018 periods.
2. Passenger traffic by route segment
Between 2017 and 2018, the increase in the number of passengers transported
on the domestic network (32.49%) and at the international level
CAMEROON CIVIL AVIATION AUTHORITY 9CCAA STATISTICAL BULLETIN 2018 EDITION
excluding CEMAC (13.20%) largely offset the sharp drop of -21, 76% of the
number of people traveling by aircraft to/ from the CEMAC countries.
Chart 8 : Evolution of passenger traffic by route segment between 2016 and 2018
Source : CCAA.
The positive evolution of passenger traffic is due to the development of
internal lines and the improvement of respect for slots by the national airline
IL AVIAT
Camair-Co, the development ofVairport infrastructure
IO and equipment, the
CI N
A
improvement of security measures
N and the security of civil aviation and the
O
signing of numerous air agreements whose exploitation has contributed to the
UT
RO
HO
CAME
development of the flow of passengers on the international and national
RITY
network.
UE
AU
TO
TI
Q
RI U
TE
AERONA
It is important to note that while the average number of passengers per mo-
vement of an airplane as a whole has risen over time, not all of its components
have grown to the same extent if we refer to the table below. First of all, it can
be noted that the average number of passengers per movement
10 CAMEROON CIVIL AVIATION AUTHORITYCCAA STATISTICAL BULLETIN 2018 EDITION
of an aircraft with respect to the domestic network has grown rapidly to be
substantially equal to that which is transported to/ from CEMAC. Then, it can
be noted that this average number experienced a saw tooth evolution for the
CEMAC road segment. Lastly, the average number of people transported to/
from the international network beyond CEMAC has slightly depreciated.
Table 3 : Average number of passengers transported per route segment between
2016 and 2018
Year National CEMAC International General
2016 19 33 100 49
2017 25 54 99 52
2018 37 39 95 57
Source : CCAA.
Several factors contributed to this evolution, in particular the development of
new interior routes and the loyalty of customers of Camair-Co, given the ame-
lioration in the regularity of its flights and respect of its schedules.
IVIL AVIATION
C A
In addition, the growth in theNnumber of air passengers over our study period
O
UT
is mainly due to the increase in passengers in transit regardless of the segment
RO
HO
CAME
of road and the majority of direct passengers, except for direct passengers to
RITY
/ from the international networks beyond CEMAC in 2017 compared to 2016
(- 02.27%) and direct passengers to / from the CEMAC sub-region network over
the period 2017-2018 (-31.21%); which have contributed to reducing the good
UE
flow of air passengers in Cameroon.
AU
TO
I
Q
RI U T Between 2016 and 2018
Table 4 : Passenger Traffic by TERoute A
Segment
AERON
Year Nature of Passenger National CEMAC International Total
Direct 173 101 174 265 764 343 1 111 709
2016 In transit 52 791 39 124 170 324 262 239
Total 225 892 213 389 934 667 1 373 948
Direct 337 464 299 451 746 971 1 383 886
2017 In transit 87 112 53 141 200 706 340 959
Total 424 576 352 592 947 677 1 724 845
Direct 452 350 205 989 863 978 1 522 317
2018 In transit 110 173 69 864 208 760 388 797
Total 562 523 275 853 1 072 738 1 911 114
Source : CCAA.
In addition, the increase in the number of passengers at the national level is
due to the development of internal lines and the improvement of the respect
of the hours of flight by the company Camair-Co.
CAMEROON CIVIL AVIATION AUTHORITY 11CCAA STATISTICAL BULLETIN 2018 EDITION
3. Passenger traffic per airline
During 2018, about 18 scheduled commercial airlines operated air services
to/from the Cameroon destination. As in previous years 2016 and 2017 inter-
national air transport activity was largely dominated by European companies
serving the Cameroon destination, with Air France topping the list with 18.86%
of market share for departing passengers followed by Brussels Airlines (15.47%).
However, some regional airlines such as Ethiopian Airlines, Asky Airlines, and
even the national airline Camair-Co, in view of the intensification of their ac-
tivities in Cameroon, now surpass Turkish Airways that has retrograded to the
6th place in terms of share of international passenger traffic transported from
Cameroon.
Table 5 : International passenger traffic transported by airline via Douala and Yaoun-
dé-Nsimalen international airports in 2018
AVIATI
CIVIL
Total Passengers ON Share of traffic per Co.
Airline company (DOUALA +NNSIMALEN) A (%)
O
UT
RO
Arrival Departure Total Arrival Departure Total
HO
CAME
Air France 102 605 104 416 207 021 20,24% 18,86% 19,52%
RITY
Brussels Airlines 82 689 85 644 168 333 16,31% 15,47% 15,87%
Turkish Airlines 32 115 38 161 70 276 06,34% 06,89% 06,63%
Camair-Co 22 447 52 547 74 994 04,43% 09,49% 07,07%
UE
Ethiopian Airlines 70 330 74 130 144 460 13,87% 13,39% 13,62%
AU
TO
I
Q
Royal Air Maroc 27 038 28 280
R 55 318 05,33% 05,11% 05,22%
IT E A UT
Kenyan Airways 30 144 31 963 A62
ER O N 05,95%
107 05,77% 05,86%
ASKY Airlines 44 003 44 333 88 336 08,68% 08,01% 08,33%
Air Cote d'Ivoire 27 334 27 575 54 909 05,39% 04,98% 05,18%
CEIBA Int 13 761 15 425 29 186 02,71% 02,79% 02,75%
Cronos Airlines 6 370 5 463 11 833 01,26% 00,99% 01,12%
Rwandair 29 604 33 797 63 401 05,84% 06,11% 05,98%
Karinou Airlines 737 828 1 565 00,15% 00,15% 00,15%
AFRI JET 3 329 3 012 6 341 00,66% 00,54% 00,60%
South African Airlines 53 91 144 00,01% 00,02% 00,01%
Trans Air Congo 6 496 6 466 12 962 01,28% 01,17% 01,22%
Congo Airways 106 94 200 00,02% 00,02% 00,02%
Others 7 755 1 292 9 047 01,53% 00,23% 00,85%
TOTAL 506 916 553 517 1 060 433 100,00% 100,00% 100,00%
Source : CCAA.
12 CAMEROON CIVIL AVIATION AUTHORITYCCAA STATISTICAL BULLETIN 2018 EDITION
In fact, the implementation of the ongoing business recovery plan of the na-
tional flag bearer, Camair-Co is beginning to yield fruits. Similarly, the other do-
minant regional airlines such as Rwandair, Kenya Airways, Royal Air Maroc and
Air Côte d’Ivoire continue to tighten their grip on the air services market in
Cameroon.
VIL AVIATION
C. Evolution of freight
N and mailA traffic
CI
O
UT
RO
Freight and mail traffic to/ from Cameroon over the period 2016-2018 has been
HO
CAME
declining, at an average annual rate of -06.49%. Indeed, after having depre-
RITY
ciated sharply over the 2016-2017 period (-12.28%), the growth rate of the volume
of freight and mail via Cameroon airports decreased again between 2017-2018
(-00.32%). The fall in the level of freight and mail traffic can be well understood by
UE
AU
approaching it according to Tthe O direction of the aircraft
I movement, the type of
Q
RI U T
flight and the segment of the routes. TE
AERONA
CAMEROON CIVIL AVIATION AUTHORITY 13CCAA STATISTICAL BULLETIN 2018 EDITION
1. Freight and mail traffic on arrival and departure of
planes
Freight and mail traffic to/ from Cameroon on arrival and departure recorded
a reverse trend between 2016-2018. Indeed, while the quantity of freight and
mail arriving from Cameroon has experienced a positive evolution of about
51.15% average annual growth rate, that of the quantity of freight and mail
departing from Cameroon experienced a negative evolution of -26.27%.
Chart 9 : Evolution of freight and mail traffic at departure and arrival between 2016
and 2018
VIL AVIATION
CI A
N
O
UT
RO
HO
CAME
RITY
Source : CCAA.
UE
AU
TO
TI amount of freight and mail
Q
A slightly downward trend was
R I observed in Uthe
TE A
A E R O N 2017-2018. However, good results
transported to / from Cameroon between
were recorded from 2016 to 2017 as a result of the improvement in cargo lan-
ding activities in Cameroon and the rehabilitation of the equipment for the han-
dling of freight at the international airport of Douala, the country’s first gateway.
The growth in the volume of freight unloaded reflects the reality that Cameroon
imports more than it exports.
2. Freight and mail traffic by type of flight
The amount of freight and mail transported through regular commercial flights
continues to evolve. Most of the freight and mail traffic was covered by the lat-
ter, with a rate of 93.18% in 2018 against 06.82% for non-scheduled flights.
14 CAMEROON CIVIL AVIATION AUTHORITYCCAA
CCAA STATISTICAL
STATISTICAL BULLETIN
BULLETIN 2018
2018 EDITION
EDITION
Chart 10 : Distribution of Freight and Mail per flight type in 2018
Source : CCAA.
However, it is important to note that while the number of scheduled com-
mercial flights largely exceeds those of non-scheduled commercial traffic, the
AVIATI
average amount of cargo and Cmail IVILtransported
ON per flight for non- scheduled
N A
flights (00.92 tonnes) is higher than that of regular flights (00.79 tonnes). The main
O
UT
RO
companies that operate regular cargo flights are DHL, Cargo-Lux and Allied Air.
HO
CAME
RITY
UE
AU
TO
TI
Q
RI U
TE
AERONA
CAMEROON CIVIL AVIATION AUTHORITY 15CCAA STATISTICAL BULLETIN 2018 EDITION
3. Freight and mail traffic by route segment
The poor performance recorded by freight and mail traffic to/from Came-
roon over the 2016-2018 triennium can be analysed from the mixed perfor-
mance of the freight and mail traffic observed at each of the route segments.
Indeed, the good performance of freight and mail traffic to/from the interna-
tional routes in general compared to previous years (101.84% towards CEMAC
and 11.81% beyond CEMAC between 2017-2018), permitted to cover the poor
performance of the domestic network which experienced an alarming regres-
sion of -63.60%.
Chart 11 : Evolution of freight and mail traffic by routed segment between 2016 and
2018
VIL AVIATION
CI A
N
O
UT
RO
HO
CAME
RITY
Source : CCAA.
UE
AU
TO
I
Q
R I that between
However, it is important to note U T2017-2018 there was a reversal
TE A
AERON
of the trend compared to the period 2016-2017, when the domestic network
experienced a positive evolution of 2,149.37% and the international networks
recorded -08.92% for the CEMAC route segment and -26.85% for the internatio-
nal routes beyond CEMAC.
III. PERFORMANCE OF CAMEROONIAN AIRPORTS
The good performance observed in air transport in Cameroon throughout
the period 2016-2018, can best be apprehended through an analysis of the
performance of various airports. In this regard, a review of airport results will be
conducted in terms of aircraft movements, passenger flows, and cargo and
mail traffic.
16 CAMEROON CIVIL AVIATION AUTHORITYCCAA STATISTICAL BULLETIN 2018 EDITION
1. Airport performance in terms of aircraft movements
VIL AVIATION
The good performance recorded CI by aircraft Amovements in Cameroon was
N
observed across the various airports. Indeed, beyond the predominance of the
O
UT
RO
international airports of Douala and Yaoundé-Nsimalen, the poor performance
HO
CAME
RITY
in 2018 of airports such as Ngaoundéré and Bafoussam is offset by the good
prowess of Yaoundé-Nsimalen, Garoua, Maroua-Salak and Bamenda airports.
Chart 12 : Evolution of airplane movements by airports between 2016 and 2018
UE
AU
TO
TI
Q
RI U
TE
AERONA
Source : CCAA.
The increase in the number of aircraft flights in general and the number of
flights at Yaoundé-Nsimalen, Maroua-Salak and Bamenda airports in particular
is due, among other things, to the amilitary and humanitarian operations un-
dertaken in the crisis affected regions of Far North, North West and South West.
CAMEROON CIVIL AVIATION AUTHORITY 17CCAA STATISTICAL BULLETIN 2018 EDITION
2. Airport performance according to passenger flows
The increasing number of passengers registered by the aviation sector in Ca-
meroon is the result of the good progress observed at almost all Cameroonian
airports, except Maroua-Salak. The low performance at this airport can be justi-
fied by the reduction of Camair-Co’s activities to the airport due to operational
difficulties related to its fleet.
Nevertheless, we first observe the dominance of the Douala airport in terms of
passenger transported via the international routes. This is followed by the pre-
eminence of Yaoundé-Nsimalen airport in terms of passenger transported at
the national level. Lastly, it appears that most of the passengers in transit were
recorded at these two international airports.
The highest rate of traffic was recorded at the Douala International Airport,
VIL AVIATION This airport has shown strong
located in the economic capital CI of Cameroon.
A
N
growth in passenger traffic in recent years with a market share equal to 55.02%
O
UT
RO
of total traffic in Cameroon. This performance is followed by that of the Yaoun-
HO
CAME
de-Nsimalen international airport, which coverage a rate of 36.12% in 2018.
RITY
Chart 13 : Evolution of passenger f low per airport between 2016 and 2018
UE
AU
TO
TI
Q
RI U
TE
AERONA
Source : CCAA.2018
Apart from the flights operated by the national airline company Camair-Co,
the international airports of Garoua and Maroua-Salak do not receive regular
commercial flights. The bulk of passengers transported via these airports are
18 CAMEROON CIVIL AVIATION AUTHORITYCCAA STATISTICAL BULLETIN 2018 EDITION
domestic passengers. International passengers on this route are generally pil-
grims traveling for the HAJJ in Saudi Arabia as well as also passengers on milita-
ry and humanitarian flights and sometimes flights from the CEMAC sub- region.
This is the reason why Garoua airport registers 03.55% and that of Maroua-Salak
02.79% of total traffic recorded in Cameroon in 2018.
Given the increase in the number of passengers compared to the evolution
of the number of flights per airport in general and that of Douala in particular,
two observations emerge:
- The load factor per aircraft is increasingly important;
- Airplanes landing at international airports have greater capacity.
For example, the average number of passengers per domestic flight for the
Douala airport increased from 22 in 2016 to 41 in 2018, and the same average
number for an international flight in terms of Yaounde-Nsimalen airport has in-
VIL A
creased from 15 in 2016 to 50 in 2018 VIA
for TIOCEMAC route segment and 91 in
the
CI N
N segments. A
2016 to 107 in 2018 for other route
O
UT
RO
Table 6 : Average Number of Passengers per Flight by Airport and Route Segment in
HO
CAME
2018
RITY
Aircraft Movements
Airports Route Segment Year 2016 Year 2017 Year 2018
National 16 14 24
Bafoussam
UE
CEMAC - - -
AU
TO
International - I - -
Q
RI UT
National TE - ONA 21 17
AER
Bamenda CEMAC - - -
International - - -
National 22 19 41
Douala CEMAC 38 66 40
International 108 87 89
National 9 16 20
Garoua CEMAC 2 7 6
International - 190 61
National 25 43 30
Maroua-Salak CEMAC 43 12 16
International 13
National 24 26 42
Ngaoundéré CEMAC 28 5 5
International - - -
National 22 35 48
Yaoundé-Nsimalen CEMAC 15 18 50
International 91 119 107
CAMEROON CIVIL AVIATION AUTHORITY 19CCAA STATISTICAL BULLETIN 2018 EDITION
Aircraft Movements
Airports Route Segment Year 2016 Year 2017 Year 2018
National 19 25 37
General CEMAC 33 54 39
International 100 99 95
Source : CCAA.
The evolution of the number of passengers at the Douala International Air-
port in 2018 to 1,062,570 passengers, suggests that if the trend is maintained,
during the year 2022, this airport will surpass the maximum capacity of Terminal
Passengers, noted as 1 500 000 passengers annually. The expected growth in
passenger flows during the upcoming African Cup of Nations (AFCON) in 2021
Cameroon could greatly induce this incapacity.
VIL AVIATION
CI A
N
O
UT
RO
HO
CAME
RITY
UE
AU
TO
TI
Q
RI U
TE
AERONA
3. Airport performance according to freight and mail
traffic
The factors justifying the slight drop of freight and mail traffic to/from Came-
roon between 2017-2018 could be analysed in detail.
The rehabilitation of freight terminals at our various international airports, these
have not been accompanied by a rise in the volume of cargo transported. For
this reason, exogenous factors such as export policy, sector taxation and many
other aspects will be analysed as part of cargo impact studies.
20 CAMEROON CIVIL AVIATION AUTHORITYCCAA STATISTICAL BULLETIN 2018 EDITION
Chart 14 : Evolution of airport freight and mail traffic between 2016 and 2018
Source : CCAA.
The peak highlighted by the chart above in 2018 at the Garoua International
Airport in terms of freight is notably due to the intensification of infrastructure
AVIATI
IVIL
works in preparation to host the CAFCON. ONof the materials and equipment
Most
N A
used for the rehabilitation of the sporting infrastructures were obviously trans-
O
UT
RO
ported by air.
HO
CAME
RITY
In view of the declared capacity of the airport terminals of the different air-
ports, it is observed that the infrastructures dedicated to freight at airports still
remain very largely underutilized. This suggests that this market segment repre-
UE
AU
TO
sents a niche and that its valuation is likely to induce a ripple effect on the
I
Q
RI U T
related activities of the agriculturalT E industry,
A E R O N Awhose imports are dependent on
the availability of fruit docks and refrigerated spaces within airports.
In this regard the CCAA has put in place an enlarged committee in charge of
elaborating a strategy for the development of air freight.
CAMEROON CIVIL AVIATION AUTHORITY 21CCAA STATISTICAL BULLETIN 2018 EDITION
APPENDIX
A. Evolution of airport traffic in Cameroon between 2017 and 2018
Nature of Aircraft Movements Passengers Passengers in Transit Feight (Tons)
Aéroports Flight 2016 2017 2018 2016 2017 2018 2016 2017 2018 2016 2017 2018
Landings 28 393 285 434 5 460 6 851 75 112 69 - - -
Bafoussam Take-offs 27 393 279 394 5 365 6 457 - - - - - -
Total 55 786 564 828 10 825 13 308 75 112 69 - - -
Landings - 150 352 - 3 334 5 614 - 94 75 - - -
Bamenda Take-offs - 149 347 - 2 975 6 057 - - - - - -
VIL AVIATION
Total - 299 699 - CI 6 309 11 671
A
- 94 75 - - -
Landings 6 846 9 042 8 658 N
304 276 346 923 366 178 182 774 232 575 225 017 3 947,24 5 838,75 5 763
O
UT
Douala
RO
Take-offs 6 873 9 037 8 655 353 042 420 439 471 375 - - - 16 429,27 7 598,63 7 173
HO
CAME
Total 13 719 18 079 17 313 657 318 767 362 837 553 182 774 232 575 225 017 20 376,51 13 437,38 12 935,90
RITY
Landings 1 884 1 332 1 455 14 398 23 052 26 934 2 987 794 2 994 9,76 50,57 825
Garoua Take-offs 1 890 1 329 1 453 12 883 23 201 27 142 - - - 30,63 37,04 247
Total 3 774 2 661 2 908 27 281 46 253 54 076 2 987 794 2 994 40,39 87,61 1 071,80
Landings 779 837 836 19 832 31 468 30 303 510 783 1 916 0,50 0,57 -
UE
Maroua-Salak
AU
Take-offs 762 833 836 19
T 532 31 073 12 147 - - - 23,04 74,08 -
O I
Q
Total 1 541 1 670 1 672 R
39 364
IT E 62 541 42T450
U
510 783 1 916 23,54 74,65 -
Landings 110 345 197 2 658 RONA
A6E232 6 772 706 1 208 1 751 0,03 0,20 -
Ngaoundéré Take-offs 106 342 198 1 839 6 303 6 594 - - - - - -
Total 216 687 395 4 497 12 535 13 366 706 1 208 1 751 0,03 0,20 0,05
Landings 4 406 4 547 5 001 183 816 236 765 274 237 75 187 105 393 134 985 887,39 3 162,86 4 481,72
Yaoundé- Take-offs 4 370 4 547 4 998 198 836 241 296 275 656 - - - 4 177,76 5 610,25 3 811,79
Nsimalen
Total 8 776 9 094 9 999 382 652 478 061 549 893 75 187 105 393 134 985 5 065,15 8 773,11 8 293,51
Landings 14 053 16 646 16 784 525 414 653 234 716 889 262 239 340 959 366 807 4 844,92 9 052,95 11 069,19
General = All Take-offs 14 028 16 630 16 766 586 526 730 652 805 428 - - - 20 660,70 13 320,00 11 232,07
Airports
Total 28 081 33 276 33 550 1 111 940 1 383 886 1 522 317 262 239 340 959 366 807 25 505,62 22 372,95 22 301,26
CAMEROON CIVIL AVIATION AUTHORITY 22CCAA STATISTICAL BULLETIN 2018 EDITION
B. International passenger traffic per airline via the international airports of Douala and
Yaoundé-Nsimalen in 2018
Airlines DOUALA NSIMALEN Total Passengers (DOUALA + NSIMALEN) Share of pax traffic
ARR DEP TOTAL ARR DEP TOTAL ARR DEPART Total Gen per Cie (%)
Air France 55 357 56 890 112 247 47 248 47 526 94 774 102 605 104 416 207 021 19%
Brussels Airlines 48 234 50 648 98 882 34 455 34 996 69 451 82 689 85 644 168 333 15%
Turkish Airlines 14 533 18 642 33 175 17 582 19 519 37 101 32 115 38 161 70 276 7%
Camair-Co 17 921 42 936 60 857 4 526 9A VIATI 14 137
611 22 447 52 547 74 994 9%
Ethiopian Airlines 43 771 48 620 92 391 26 559C
IVIL
25 510
ON
52A069 70 330 74 130 144 460 13%
N
Royal Air Maroc 15 768 15 968 31 736 11 270 12 312 23 582 27 038 28 280 55 318 5%
O
UT
RO
Kenyan Airways 20 593 21 577 42 170 9 551 10 386 19 937 30 144 31 963 62 107 6%
HO
CAME
ASKY Airlines 32 742 33 125 65 867 11 261 11 208 22 469 44 003 44 333 88 336 8%
RITY
Air Cote d'Ivoire 19 403 19 904 39 307 7 931 7 671 15 602 27 334 27 575 54 909 5%
CEIBA Int 13 761 15 425 29 186 - - - 13 761 15 425 29 186 3%
Cronos Airlines 6 270 5 346 11 616 100 117 217 6 370 5 463 11 833 1%
Rwandair 29 604 33 797 63 401 - - - 29 604 33 797 63 401 6%
UE
AU
Karinou Airlines 737 828 1 565 TO
- - - 737 828 1 565 0%
I
Q
AFRI JET 3 171 2 929 6 100 158R I T 83 T
U241 3 329 3 012 6 341 1%
E AERONA
South African Airlines 53 91 144 - - - 53 91 144 0%
Trans Air Congo 6 496 6 466 12 962 - - - 6 496 6 466 12 962 1%
Congo Airways 106 94 200 - - - 106 94 200 0%
Others 180 180 7 755 1 112 8 867 7 755 1 292 9 047 0%
TOTAL 328 520 373 466 701 986 178 396 180 051 358 447 506 916 553 517 1 060 433 100%
CAMEROON CIVIL AVIATION AUTHORITY 23CCAA STATISTICAL BULLETIN 2018 EDITION
C. Breakdown of traffic by airport per type of flight in 2018
Airports Nature of Flight Aircraft Movements Passengers Passengers in Transit Feight (Tons)
Regular Commercial 480 12 721 69 -
Non Regular Commercial 12 84 - -
Bafoussam
Non Commercial 72 503 - -
Total 564 13 308 69 -
Regular Commercial 387 10 640 75 0
Non Regular Commercial 4 4 - -
Bamenda
Non Commercial 308 1 027 - -
Total 699 11 671 75 -
Regular Commercial 15 771 835 669 224 568 11 942,67
VIL AVIATIO1N649
CI
Non Regular Commercial 215 386 993,23
Douala
Non Commercial 1 351 N A
235 63 -
O
Total 17 337 837 553 225 017 12 935,90
UT
RO
Regular Commercial 570 50 299 2 331 1 071,8
HO
CAME
Non Regular Commercial 130 3 775 608 -
RITY
Garoua
Non Commercial 2 208 2 55 -
Total 2 908 54 076 2 994 1 071,8
Regular Commercial 254 24 315 510 -
Non Regular Commercial 427 5 973 1 208 -
Maroua-Salak
UE
Non Commercial 990 12 162 198 -
AU
Total TO
1 671 42 450 1 916 -
I
Q
RI UT
Regular Commercial 243
TE 11 743 1 599 0,05
Non Regular Commercial 24 A E R O N A 60 1 -
Ngaoundéré
Non Commercial 128 1 563 151 -
Total 395 13 366 1 751 0,05
Regular Commercial 8 572 539 631 155 486 7 766,33
Non Regular Commercial 847 6 810 1 326 527,18
Yaoundé-Nsimalen
Non Commercial 641 3 452 163 -
Total 10 060 549 893 156 975 8 293,51
Regular Commercial 26 277 1 485 018 384 638 20 780,85
General = All Non Regular Commercial 1 659 18 355 3 529 1 520,41
Airports
Non Commercial 5 698 18 944 630 -
Total 33 634 1 522 317 388 797 22 301,26
CAMEROON CIVIL AVIATION AUTHORITY 24CCAA STATISTICAL BULLETIN 2018 EDITION
D. Breakdown of airport traffic per route segment in 2018
Airport Route Network MVT PAX FREIGHT
NAT 4 549 135 588 17,67
DLA INT 12 788 701 965 12918,23
TOTAL 17 337 837 553 12 935,90
NAT 5 167 191 446 331,06
NSI INT 4 893 358 447 7962,45
TOTAL 10 060 549 893 8 293,51
VIL AVIATION
NAT
C2I 654 A
49 968 1036,23
GOU INT N 254 4 108 35,57
O
UT
RO
TOTAL 2 908 54 076 1 071,80
HO
CAME
NAT 1 278 37 184 -
RITY
MVR INT 393 5 266 -
TOTAL 1 671 42 450 -
NAT 356 13 185 0,05
NGE INT 39 181 0
UE
AU
TOTAL TO 395 13 366 0,05
TI
Q
NAT R I 564 U 13 308 -
TE NA
BFX INT - AERO - -
TOTAL 564 13 308 -
NAT 699 11 671 -
BPC INT - - -
TOTAL 699 11 671 -
NAT 15 267 452 350 1 385,01
GENERAL INT 18 367 1 069 967 20 916,25
TOTAL 33 634 1 522 317 22 301,26
CAMEROON CIVIL AVIATION AUTHORITY 25CCAA STATISTICAL BULLETIN 2018 EDITION
E. Evolution of airport traffic in Cameroon between 2016 and 2018
Nature du Mouvements d’avion Passagers Passagers en Transit Fret (Tonnes)
Aéroports vol
2016 2017 2018 2016 2017 2018 2016 2017 2018 2016 2017 2018
National 55 786 564 828 10 825 13 308 75 112 69 - - -
CEMAC - - - - - - - - - -
Bafoussam
International - - - - - - - - - -
Total 55 786 564 828 10 825 13 308 75 112 69 - - -
National - 299 699 - 6 309 11 671 - 94 75 - - -
CEMAC - - - - - - - - - - -- -
Bamenda
International - - - - - - - - - - - -
Total - 299 699 - 6 309 11 671 - 94 75 - - -
AVIA
National 3 412 6 843 4 549 42 846
C IVIL77 760 TI135
ON588 31 644 49 563 51 164 87,11 3,77 17,67
Douala
CEMAC 5 010 5 002 5 381
N
157 057 286 464 A
176 459 35 450 42 492 39 594 171,01 163,27 318,76
O
International 5 297 6 234 7 407 457 415 403 138 525 506 115 680 140 520 134 259 20 118,44 13 270,34 12 599,47
UT
RO
Total 13 719 18 079 17 337 657 318 767 362 837 553 182 774 232 575 225 017 20 376,56 13 437,38 12 935,90
HO
CAME
National 3 408 2 603 2 654 26 997 41 874 49 968 2 802 746 1 950 52,02 85,23 1 036,23
RITY
CEMAC 298 36 188 284 210 80 185 48 1 044 - 2,38 2,35
Garoua
International 68 22 66 - 4 169 4 028 - - - - - 33,22
Total 3 774 2 661 2 908 27 281 46 253 54 076 2 987 794 2 994 52,02 87,61 1 071,80
National 1 473 1 381 1 278 36 266 59 316 37 184 435 559 1 044 22,51 74,59 -
CEMAC 68 289 382 2 867 3 166 5 126 75 224 872 0,67 0,06 -
UE
Maroua- Salak
AU
International - - 11 TO- 59 140 - - - - - -
TI
Q
Total 1 541 1 670 1 671 39 133 RI 62 541 42 450
U
510 783 1 916 23,18 74,65 -
TE
National 213 499 356 4 436 A
11E R O N A13 185
857 683 1 015 1 751 0,03 0,20 0,05
CEMAC 3 188 39 61 678 181 23 193 - - - -
Ngaoundéré
International - - - - - - - - - - - -
Total 216 687 395 4 497 12 535 13 366 706 1 208 1 751 0,03 0,20 0,05
National 3 613 4 688 5 167 61 728 129 523 191 446 17 152 35 023 54 120 7,51 3 641,70 331,06
CEMAC 1 182 1 054 1 059 13 996 8 933 24 143 3 391 10 184 28 354 18,92 7,88 29,26
Yaoundé-
Nsimalen International 3 981 3 352 3 834 306 928 339 605 334 304 54 644 60 186 74 501 5 027,00 5 124,00 7 933,19
Total 8 776 9 094 10 060 382 652 478 061 549 893 75 187 105 393 156 975 5 053,43 8 773,58 8 293,51
National 12 174 17 099 15 267 173 101 337 464 452 350 52 791 87 112 110 173 169,18 3 805,49 1 385,01
Général =
CEMAC 6 561 6 569 7 049 174 265 299 451 205 989 39 124 53 141 69 864 190,60 173,59 350,37
Tous les
Aéroports International 9 346 9 608 11 318 764 343 746 971 863 978 170 324 200 706 208 760 25 145,44 18 394,34 20 565,88
Total 28 081 33 276 33 634 1 111 709 1 383 886 1 522 317 262 239 340 959 388 797 25 505,22 22 373,42 22 301,26
CAMEROON CIVIL AVIATION AUTHORITY 26CCAA STATISTICAL BULLETIN 2018 EDITION
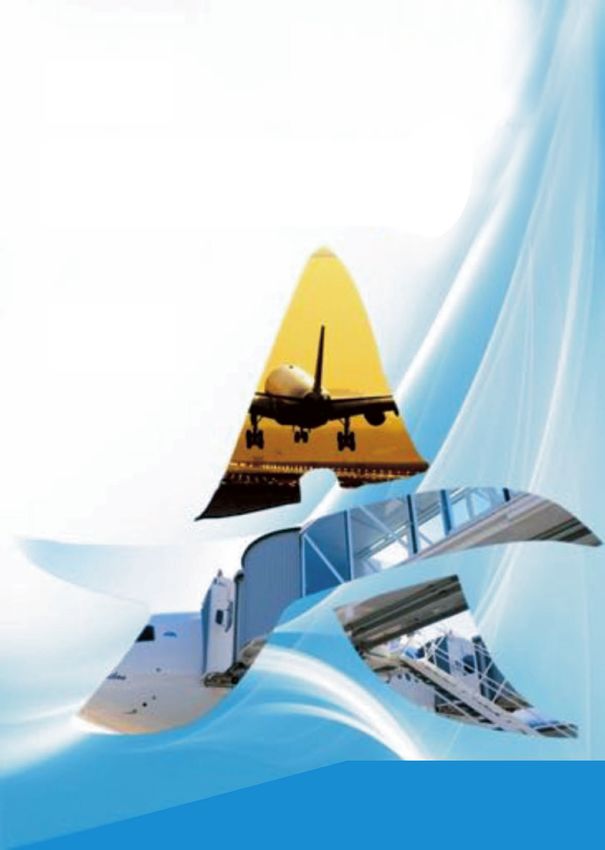
F. Domestic lines by airport in Cameroon
100
km
1:12 607 000
Maroua
Garoua
Ngaoundéré
Bamenda
Bafoussam
Douala Yaoundé-Nsimalen
Yaoundé Douala Ngaoundéré Garoua Maroua
CAMEROON CIVIL AVIATION AUTHORITY 27CCAA STATISTICAL BULLETIN 2018 EDITION
G - Direct lines served from Cameroon
Departure from Yaoundé-Nsimalen Departure from Douala
CAMEROON CIVIL AVIATION AUTHORITY 28CCAA STATISTICAL BULLETIN 2018 EDITION
Cameroon Civil Aviation Authority
Working together for the development of air transport in Cameroon under
AVIATI
VIL ON
CI
maximum safety N and security A conditions
O
UT
RO
HO
CAME
RITY
Head quarters: B.P.: 6998 Yaoundé-Cameroun
Tel: (00237) 222 30 30 90 / 222 30 26 92
UE
AU
Fax:TO(00237) 222 30 33
I 62
Q
RI T
TE N AU
E-mail : A
contact@ccaa.aero
E R O
Site web: www.ccaa.aero
CAMEROON CIVIL AVIATION AUTHORITY 29You can also read