NOISE EXPOSURE FORECAST STUDY - WINN IPEG INTERNATIONAL AIRPORT - FINAL RE PORT | JANUARY 8, 2021
←
→
Page content transcription
If your browser does not render page correctly, please read the page content below
NOISE EXPOSURE FORECAST STUDY –
WINNIPEG INTERNATIONAL AIRPORT
FINAL REPORT | JANUARY 8, 2021
NOISE EXPOSURE FORECAST STUDY –
     WINNIPEG INTERNATIONAL AIRPORT
                          Final Report

                       Province of Manitoba
                     Manitoba Municipal Relations

                               January 8, 2021

        HM Aero Inc.                      Landmark Planning and Design Inc.
532 Montreal Road, Suite 209                    289 Waterfront Drive
    Ottawa, ON K1K 4R4                         Winnipeg, MB R3B 0G5

                         Cover Image: Google Earth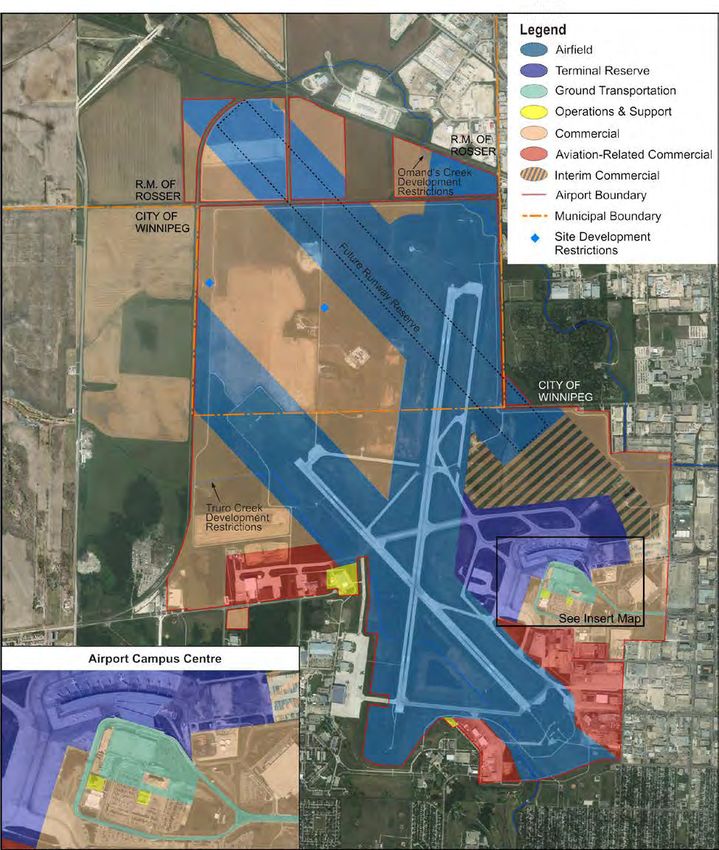
Table of Contents
1     INTRODUCTION ...............................................................................................................1
    1.1     Background.................................................................................................................1
    1.2     Study Objectives.........................................................................................................1
    1.3     Noise Measurement and Contours ............................................................................2
                   Noise Measurement ............................................................................................2
                   Noise Exposure Forecast System ......................................................................2
                   Community Response to Noise ..........................................................................4
    1.4     Winnipeg Airport Vicinity Protection Area Secondary Plan........................................4
2     AIRCRAFT MOVEMENT FORECASTS ...........................................................................6
    2.1     Historical Activity Review ...........................................................................................6
                   Total, Itinerant, and Local Aircraft Movements ...................................................6
                   Aircraft Operators................................................................................................7
                   Aircraft Sizes .....................................................................................................10
    2.2     Aircraft Movement Forecast .....................................................................................12
                   Preface ..............................................................................................................12
                   Process .............................................................................................................13
                   Assumptions .....................................................................................................15
                   Forecast Results ...............................................................................................20
3     RUNWAY CAPACITY ANALYSIS .................................................................................23
    3.1     Purpose ....................................................................................................................23
    3.2     Previous Studies.......................................................................................................23
                   2000 Airport Development Plan Summary .......................................................23
                   Winnipeg Richardson International Airport – Master Plan 2033 ......................24
    3.3     Analysis Model .........................................................................................................24
    3.4     Baseline Runway Capacity.......................................................................................24
                   Assumptions .....................................................................................................25
                   Outputs..............................................................................................................27
    3.5     Capacity Enhancement Measures ...........................................................................29
    3.6     Ultimate-Term Runway Capacity..............................................................................31
                   Assumptions .....................................................................................................32
                   Outputs..............................................................................................................34
4     NOISE CONTOUR CALCULATIONS ............................................................................35
    4.1     Methodology .............................................................................................................35
    4.2     Model Inputs .............................................................................................................36

            Final Noise Exposure Forecast Study – Winnipeg International Airport                                                          i
4.3      General Assumptions ...............................................................................................36
5      NOISE CONTOUR SCENARIOS ...................................................................................37
    5.1      Scenario 1 – 2019 Baseline Conditions ...................................................................37
    5.2      Scenario 2 – 2033 Forecast Conditions ...................................................................39
    5.3      Scenario 3 – 2050 Forecast Conditions ...................................................................41
    5.4      Scenario 4 – Ultimate-Term Conceptual Conditions ................................................43
6      NEXT STEPS ..................................................................................................................45
7      BIBLIOGRAPHY .............................................................................................................46

                                                 List of Figures
Figure 1.1 – AVPA Areas and 1995 NEF Contours .................................................................. 5
Figure 2.1 - Total, Itinerant, and Local Aircraft Movements ...................................................... 6
Figure 2.2 - Itinerant Air Carrier Movements ............................................................................. 8
Figure 2.3 - Itinerant Air Carrier, Passenger, and Cargo Activity .............................................. 8
Figure 2.4 - Itinerant Other Commercial and Private Movements............................................. 9
Figure 2.5 - Itinerant Government Civil and Military Movements ............................................ 10
Figure 2.6 - Itinerant Movements by Maximum Take-Off Weight ........................................... 12
Figure 2.7 - Passenger Activity Forecasts............................................................................... 17
Figure 2.8 - Level I-III and Foreign Passenger Air Carrier Movement Forecast ..................... 18
Figure 2.9 - Aircraft Movement Forecast ................................................................................. 21
Figure 3.1 - Baseline Capacity Analysis Airfield Layout (NAV CANADA)............................... 25
Figure 3.2 - Estimated Practical Capacity vs. Forecast Aircraft Movements .......................... 28
Figure 3.3 - Airfield Capacity Improvement Measures (WAA Master Plan 2033)................... 30
Figure 3.4 - 2033 Airport Land Use Plan (WAA Master Plan 2033)........................................ 31
Figure 3.5 - Ultimate-Term Capacity Analysis Operational Scenarios.................................... 33
Figure 5.1 - 2019 Baseline Contours .......................................................................................38
Figure 5.2 - 2033 Contours ......................................................................................................40
Figure 5.3 - 2050 Contours ......................................................................................................42
Figure 5.4 - Ultimate-Term Conceptual Contours ................................................................... 44

              Final Noise Exposure Forecast Study – Winnipeg International Airport                                                  ii
List of Tables
Table 1.1 - Study Scenario NEF Definitions .............................................................................. 3
Table 1.2 - Community NEF Response Prediction (Transport Canada)................................... 4
Table 2.1 - Itinerant Movements by Maximum Take-Off Weight............................................. 11
Table 2.2 - 2033 Master Plan Aircraft Movement Forecast (WAA)......................................... 13
Table 2.3 - Forecasting Techniques ........................................................................................14
Table 2.4 - Historical Passenger Activity vs. GDP Regression Analysis ................................ 16
Table 2.5 - Gross Domestic Product Forecasts ...................................................................... 16
Table 2.6 - Aircraft Movement Forecast ..................................................................................21
Table 2.7 - Forecast Average Annual Growth Rates .............................................................. 22
Table 3.1 - Baseline Capacity Analysis Fleet Assumptions .................................................... 27
Table 3.2 - Baseline Annual Capacity Estimate ...................................................................... 28
Table 3.3 - 2017-2018 Runway Utilization .............................................................................. 34
Table 3.4 - Ultimate-Term Annual Capacity Estimate ............................................................. 34
Table 5.1 - 2018 Runway Utilization ........................................................................................37

                                           List of Acronyms
                        Acronym                                          Definition
                           AVPA                    Airport Vicinity Protection Area
                            GDP                    Gross Domestic Product
                             IFR                   Instrument Flight Rules
                            IMC                    Instrument Meteorological Conditions
                         NCAMS                     NAV CANADA Aircraft Movement Statistics
                            NEF                    Noise Exposure Forecast
                            NEP                    Noise Exposure Projection
                             NM                    Nautical Miles
                           PACM                    Prototype Airfield Capacity Model
                            VFR                    Visual Flight Rules
                            VMC                    Visual Meteorological Conditions
                            WAA                    Winnipeg Airports Authority

             Final Noise Exposure Forecast Study – Winnipeg International Airport                                           iii
1 INTRODUCTION
1.1 Background
The aviation sector has experienced considerable growth in the 21st century as passenger and
cargo air carriers, charter operators, air ambulance service providers, and other entities have
increased their operations to meet the demand for domestic, transborder, and international
travel. As a result, numerous Canadian airports have experienced similar growth as activity
levels increase and new infrastructure is developed.
Simultaneously, residential, commercial, and industrial development in large municipalities
such as Winnipeg has resulted in the outward expansion of urban areas. Increasingly, this has
resulted in airports being positioned in closer proximity to noise sensitive areas that were
previously distanced. This poses a range of compatibility concerns, including aircraft noise –
increased aircraft movements can disrupt sensitive land uses such as residential
neighbourhoods, schools, and retirement communities, among others. While noise concerns
can be mitigated for existing communities through measures such as modified flight paths and
procedures, appropriate planning that separates sensitive land uses from areas of high noise
exposure can proactively minimize future conflicts.
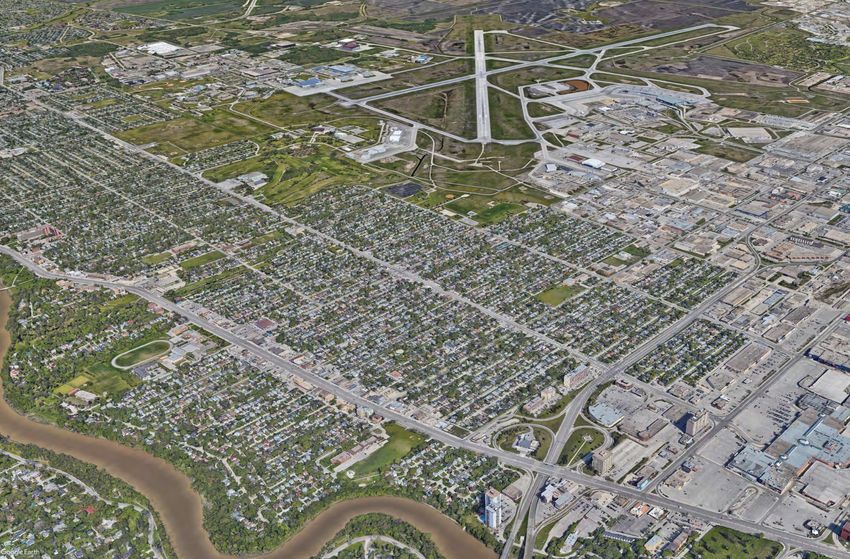
Winnipeg James Armstrong Richardson International Airport (Winnipeg International Airport)
is a critical air travel hub, serves as a major linkage in the domestic and international supply
chain and logistics network, and generates an estimated $2.9 billion in direct economic output
annually 1. The scale of Winnipeg’s operations has the potential to increase in the future;
however, this growth could result in increased land use conflicts.
1.2 Study Objectives
In September 2020, the Province of Manitoba retained HM Aero Inc. (HM Aero) and its
subconsultant, Landmark Planning & Design Inc. (Landmark Planning), to provide a Noise
Exposure Forecast Study for Winnipeg International Airport and a subsequent Comprehensive
Planning Analysis and Recommendations Report. The purpose of the Noise Exposure
Forecast Study is to update the noise contours that may inform the City of Winnipeg’s Airport
Vicinity Protection Area Secondary Plan with independently prepared contours that consider
multiple scenarios.
The Noise Exposure Forecast Study has three primary components:
1. Aircraft Movement Forecasts: Forecasting the potential future activity at Winnipeg
International Airport is critical to modelling how aircraft noise may impact surrounding land
uses. Aircraft movement forecasts have been prepared on an annual basis to 2050 to
identify the traffic levels that will be modelled in the 2033 and 2050 noise contours.
2. Runway Capacity Analysis: The annual aircraft movement capacity of Winnipeg
International Airport’s two runways is calculated to assist the Province in considering
whether a new runway may be required to provide additional capacity within the 30-year
horizon (2050) of the study. Further, capacity is estimated in an ‘ultimate-term’ scenario
that considers the addition of a new runway and will inform the development of noise
contours that represent the maximum potential utilization of Winnipeg International Airport.
1
InterVISTAS Consulting Inc. (n.d.). 2020 Economic Impact Study Final Report: Winnipeg James Armstrong Richardson
International Airport (YWG).
Final Noise Exposure Forecast Study – Winnipeg International Airport 1
3. Noise Contour Scenarios: The study presents four noise contour scenarios:
    Scenario 1 – 2019 Baseline Conditions: Contours derived from 2019 aircraft movement
    statistics to illustrate the baseline conditions of Winnipeg International Airport. 2019 has
    been selected as the baseline as, at the time of this report’s preparation in the fall of 2020,
    full-year aircraft movement data for 2020 was not available. Further, the COVID-19
    pandemic has had a significant negative impact on aircraft movements at Winnipeg
    International Airport in 2020 that is inconsistent with trends exhibited in previous years.
    Scenario 2 – 2033 Forecast Conditions: Contours that illustrate conditions at the end of
    the planning horizon of the Winnipeg Airports Authority’s (WAA’s) 2033 Master Plan for
    Winnipeg International Airport.
    Scenario 3 – 2050 Forecast Conditions: Illustrates forecast noise conditions over a 30-
    year planning horizon, which aligns with the horizons of municipal and regional plans such
    as the OurWinnipeg 2045 Draft Plans and the Capital Planning Region 2050 Draft Plan.
    Scenario 4 – Ultimate-Term Conceptual Conditions: Considers the noise conditions at
    an indeterminate time in the future where a third runway is implemented, and the three-
    runway system operates at its maximum capacity.
The Noise Exposure Forecast Study has been prepared for the exclusive use of the Province
of Manitoba. Any use, reliance on, or decision made by a third party based on this report is the
sole responsibility of that third party.

1.3 Noise Measurement and Contours
        Noise Measurement
As described by Transport Canada in TP1247 – Land Use in the Vicinity of Aerodromes (9th
Ed.), the sound pressure of a given source, such as an overflying aircraft, can be measured in
the unit of the decibel (dB). The Effective Perceived Noise Level has been developed to better
approximate the reaction of humans to aircraft noise, measured in the unit of EPNdB. The
determination of the Effective Perceived Noise Level is part of the certification process for
aircraft and includes corrections to address matters that contribute to the annoyance of
humans such as the duration of the noise event (i.e., the aircraft overflight).
        Noise Exposure Forecast System
Annoyance from aircraft noise includes factors beyond the one-time impacts of an overflying
aircraft. For example, the number of flights that occur per day, the concentration and
distribution of flights, the time of day that overflights occur, and the Effective Perceived Noise
Levels of aircraft in use all contribute to annoyance. In Canada, the Noise Exposure Forecast
System has been used since 1971 to predict the overall subjective annoyance and reaction
levels caused by aircraft operations on specific land uses.
The Noise Exposure Forecast System generates noise contours, which are lines of constant
levels of perceived annoyance caused by airport noise sources. Research and analysis by the
National Research Council has resulted in a numeric rating for predicted annoyance levels
and the recommended types of development that should be allowed within the affected areas.
Under the umbrella of the Noise Exposure Forecast System, Transport Canada describes
three types of contours that are differentiated according to the planning horizon of the
supporting data inputs:

          Final Noise Exposure Forecast Study – Winnipeg International Airport                   2
1. Noise Exposure Forecast (NEF) Contours: Aircraft types and mix as well as traffic
   volume used in calculating the NEF contours are normally forecast for a period of between
   5 to 10 years into the future. The existing runway geometry is used, as well as any planned
   changes to the airfield within the 5-to-10-year horizon.
2. Noise Exposure Projection (NEP) Contours: Based on a projection of aircraft
   movements more than 10 years into the future and includes aircraft types and runway
   configurations that may materialize within this period.
3. Noise Planning Contours: Produced to investigate planning alternatives, such as the
   impacts of a new runway, hypothetical airport traffic scenarios, changing aircraft fleet
   types, etc.
Despite their unique naming, NEF, NEP, and Noise Planning Contours are generated using
the same software and methodology.
As described in Section 1.2, fours sets of noise contours have been prepared for Winnipeg
International Airport to depict baseline conditions in 2019, forecast conditions in 2033 and
2050, and conditions in a conceptual ‘ultimate-term’. Table 1.1 identifies how the four
scenarios are defined according to the three types of noise contours described by Transport
Canada. While the 2019 baseline scenario does not fit any of the three definitions as it is a
historical occurrence and not a future case, the software and methodology used in the
preparation of all four noise contour sets is consistent and appropriate.
                         Table 1.1 - Study Scenario NEF Definitions
                                                                                 Noise Planning
                                           NEF Contours          NEP Contours
                                                                                   Contours
            Study Scenario
                                             5 - 10 Years          > 10 Years    Scenario Based

 Scenario 1 – 2019 Baseline Conditions           No                    No             No

 Scenario 2 – 2033 Forecast Conditions           No                   Yes             No

 Scenario 3 – 2050 Forecast Conditions           No                   Yes             No

 Scenario 4 – Ultimate-Term Conceptual
                                                 No                    No             Yes
 Conditions

          Final Noise Exposure Forecast Study – Winnipeg International Airport                    3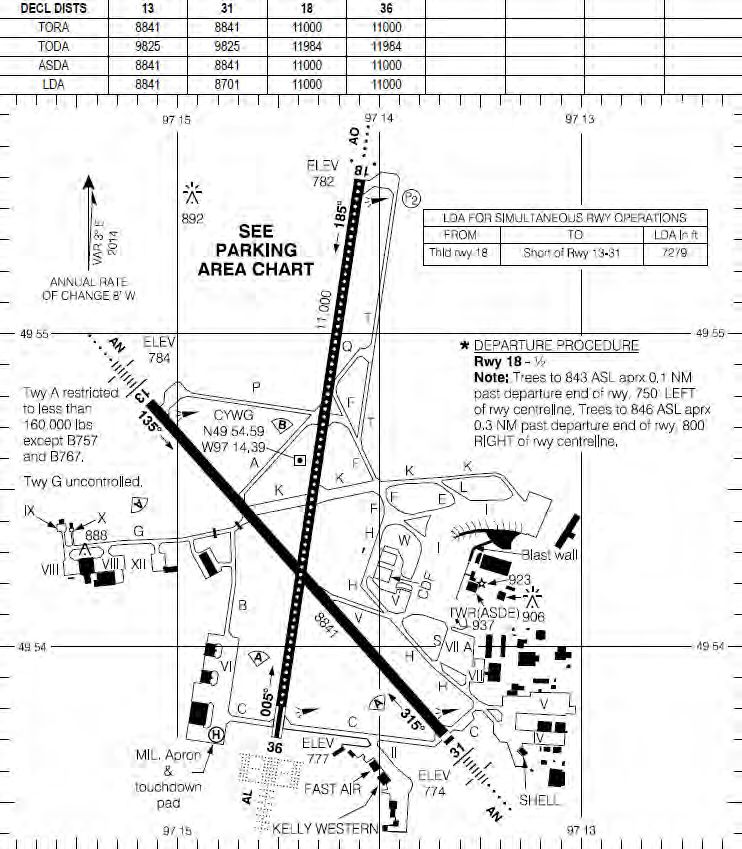
Community Response to Noise
TP1247 – Land Use in the Vicinity of Aerodromes (9th Ed.) forms the basis for Transport
Canada’s recommendations on development controls near airports as a function of aircraft
noise and perceived annoyance. These guidelines are widely used by Canadian municipalities
to ensure that the development of noise sensitive facilities and residential areas is
appropriately controlled. Included in TP1247 and shown in Table 1.2 are predictions of
community response to commonly modelled NEF contours.
Table 1.2 - Community NEF Response Prediction (Transport Canada)
Response Area Response Prediction*
Repeated and vigorous individual complaints are likely. Concerted group and
1 (over 40 NEF)
legal action might be expected.
Individual complaints may be vigorous. Possible group action and appeals to
2 (35-40 NEF)
authorities.
3 (30-35 NEF) Sporadic to repeated individual complaints. Group action is possible.
Sporadic complaints may occur. Noise may interfere occasionally with
4 (below 30 NEF)
certain activities of the resident.
* The above community response predictions are generalizations based upon experience resulting from
the evolutionary development of various noise exposure units used by other countries. For specific
locations, the above response areas may vary somewhat in accordance with existing ambient or
background noise levels and prevailing social, economic, and political conditions.
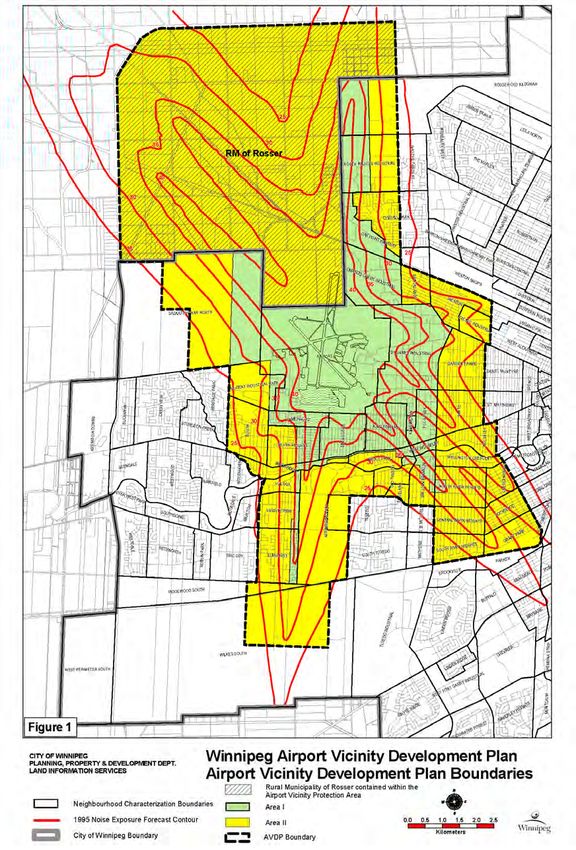
1.4 Winnipeg Airport Vicinity Protection Area Secondary Plan
As stated in the 1994 Airport Vicinity Protection Area (AVPA) Secondary Plan, the boundaries
of the protection area are tied to NEF contours. The AVPA Area II outer limit approximates the
25 NEF contour, and the characteristics of the NEF contours reflect the potential for an
additional parallel runway. While the contours presented in the AVPA and associated Areas I
and II are intended to represent an ultimate scenario, the assumptions and inputs used in their
generation are not documented in the AVPA. The contours presented in the AVPA are
illustrated in Figure 1.1.
Final Noise Exposure Forecast Study – Winnipeg International Airport 4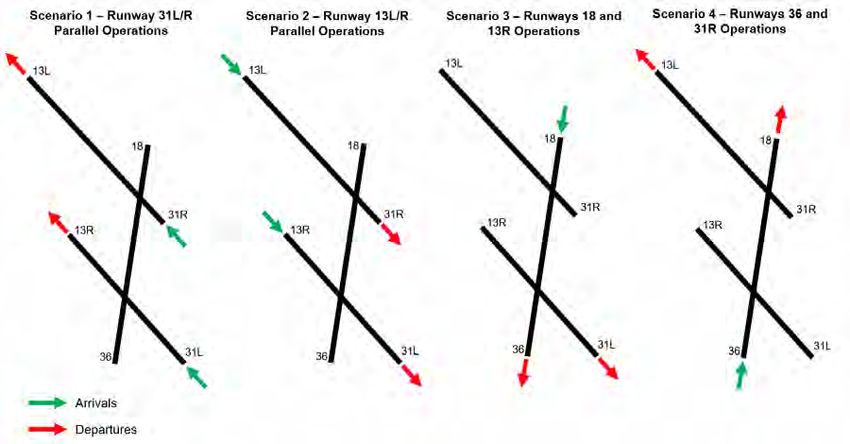
Figure 1.1 – AVPA Areas and 1995 NEF Contours

Final Noise Exposure Forecast Study – Winnipeg International Airport   5
2 AIRCRAFT MOVEMENT FORECASTS

2.1 Historical Activity Review
An aircraft movement is defined as a take-off, landing, touch-and-go, or simulated approach.
Full-year aircraft movement data for Winnipeg International Airport was available from
Statistics Canada for the period of 1997 to 2019. By examining historical data, trends over
time can be identified to inform forecasts of future activity at Winnipeg International Airport.
                            Total, Itinerant, and Local Aircraft Movements
Activity at Winnipeg International Airport has decreased from approximately 155,200 aircraft
movements in 1997 to 115,900 movements in 2019, as shown in Figure 2.1 2. This represents
a total decrease of 25.3% from 1997 to 2019, or an average annual decrease of 1.2%. Over
the past ten years, activity has decreased by an average of 1.6% per year from 135,000 aircraft
movements in 2010 to 115,900 movements in 2019.
Aircraft movements can be further classified as itinerant or local. Itinerant movements at
controlled airports are defined by Statistics Canada as flights where:
            •               An aircraft proceeds to, or arrives from, another location; or
            •               An aircraft leaves the airport traffic pattern and returns without landing at another
                            airport.

                                     Figure 2.1 - Total, Itinerant, and Local Aircraft Movements

                           180,000

                           160,000

                           140,000
      Aircraft Movements

                           120,000

                           100,000

                            80,000

                            60,000

                            40,000

                            20,000

                                0

                                Total, itinerant and local movements      Itinerant movements         Local movements

2
    Except where otherwise shown in the report, aircraft movements are rounded to the nearest hundred.

                               Final Noise Exposure Forecast Study – Winnipeg International Airport                     6
Itinerant aircraft movements have decreased by 18.5% from 130,200 in 1997 to 106,100 in
2019, or 0.8% per year. From 2010 to 2019, itinerant movements decreased from 124,100 in
2010 to 106,100 in 2019 – a decrease of 1.6% per year.
For airports with control towers, local aircraft movements are defined by Statistics Canada as
flights that remain in the airport traffic pattern. This category commonly includes flight training
and maintenance / test flights. Local aircraft movements have decreased from 25,000 in 1997
to 9,800 in 2019. This represents a decrease of 2.8% per year. This decrease has slowed in
the last ten years, with local movements having declined by 1.0% annually from 10,800 in
2010 to 9,800 in 2019.
Aircraft Operators
Statistics Canada classifies itinerant aircraft movements into six operator categories:
1. Air Carrier, Level I-III and Foreign;
2. Air Carrier, Level IV-VI;
3. Other Commercial;
4. Private;
5. Government – Civil; and
6. Government – Military.
Air Carrier Movements
Air carrier movements include flights transporting people, mail, and / or goods that are
performed by commercial operators licensed by the Canadian Transportation Agency. For
discussion purposes, the two air carrier classifications (Level I-III and Foreign, Level IV-VI) are
consolidated into one. Examples of air carriers that operate at Winnipeg International Airport
include Air Canada, WestJet, CargoJet, Perimeter Aviation, Keewatin Air, and Calm Air.
Air carriers have been responsible for the majority of the itinerant aircraft movements at
Winnipeg International Airport from 1997 to 2019, ranging from 78% to 90% of movements in
this category on an annual basis. As shown in Figure 2.2, itinerant air carrier operations
increased from 103,800 movements in 1997 to a maximum of 120,900 movements in 2007,
before decreasing to between 95,400 and 100,000 annual movements in 2015-2019. From
1997 to 2019, itinerant air carrier movements have decreased by an annual average of 0.4%.
Between 2007 and 2019, the annual average decrease was 1.7%.
Despite the historical decrease in air carrier movements, passenger and air cargo activity has
generally increased at Winnipeg International Airport as shown in Figure 2.3. This trend is a
result of factors such as:
• Improved aircraft utilization with route maturation and optimized airline revenue
management – for example, a CRJ-200 that operated at an 80% load factor (40
passengers) now operating at a 90% load factor (45 passengers); and
• The deployment of aircraft with higher capacities – for example, the use of a 142 seat
Airbus A320 on a route that was formerly operated by a 76 seat CRJ-900.
As will be considered in the forecasting discussion below, future growth in air cargo and
passenger activity is not expected to correspond uniformly with increases in aircraft
movements.
Final Noise Exposure Forecast Study – Winnipeg International Airport 7Figure 2.2 - Itinerant Air Carrier Movements
140,000
120,000
100,000
Aircraft Movements
80,000
60,000
40,000
20,000
0
Figure 2.3 - Itinerant Air Carrier, Passenger, and Cargo Activity
500
450
400
350
300
250
200
150
100
50
0
2008 2009 2010 2011 2012 2013 2014 2015 2016 2017 2018
Passengers (10,000s) Air Cargo Tonnage (1,000s)
Air Carrier Movements (1,000s)
Final Noise Exposure Forecast Study – Winnipeg International Airport 8Other Commercial Movements
The Statistics Canada other commercial category includes flights performed by Canadian
Transportation Agency licensed aircraft operators that are not encompassed within passenger
and cargo air carrier operations. This includes operators such as flight training units,
agricultural applicators, and aerial surveyors.
As shown in Figure 2.4, other commercial itinerant movements increased from 3,300 in 1997
to a maximum of approximately 7,500 in 2000. Movements decreased in subsequent years to
1,400 in 2004 and 600 in 2019. From 2010 to 2019, an average of 500 annual other
commercial itinerant movements were recorded at Winnipeg International Airport.
Figure 2.4 - Itinerant Other Commercial and Private Movements
9,000
8,000
7,000
Aircraft Movements
6,000
5,000
4,000
3,000
2,000
1,000
0
Other Commercial Private
Private Movements
Private movements are aircraft not used for hire or compensation that are owned by
individuals, groups, and businesses. Itinerant private movements have decreased from a
maximum of 8,100 in 2001 to 3,600 in 2019, or an average annual decrease of 3.1% (Figure
2.4). From 2010 to 2019, itinerant private movements have decreased by an average of 1.1%
annually, with an average of 3,900 annual movements in this period.
Government – Civil Movements
Itinerant movements in this category include aircraft owned by foreign, federal, provincial, and
municipal governments. The Province of Manitoba has historically maintained a significant
aviation services presence at Winnipeg International Airport for wildfire suppression, air
ambulance and medevac operations, and justice transportation flights. Government – civil
itinerant movements have exhibited variability between 1997 and 2019, ranging from lows of
3,300 and 3,400 movements in 2010 and 2019, respectively, to highs of 4,900 and 5,000
movements in 2011 and 2013, respectively (Figure 2.5).
Final Noise Exposure Forecast Study – Winnipeg International Airport 9Government – Military Movements
This category includes aircraft of any branch of the armed forces of any nation, including the
Royal Canadian Air Force. 17 Wing Winnipeg, which is collocated with Winnipeg International
Airport, supports several Royal Canadian Air Force squadrons that are engaged in training,
search and rescue, and other roles. As shown in Figure 2.5, government – military itinerant
aircraft movements have exhibited a downward trend over time, decreasing from 12,100
movements in 1997 to 2,700 movements in 2019.
Figure 2.5 - Itinerant Government Civil and Military Movements
14,000
12,000
10,000
Aircraft Movements
8,000
6,000
4,000
2,000
0
Government - Civil Government - Military
Aircraft Sizes
Data on aircraft sizes and types can be inferred through Statistics Canada’s dataset on aircraft
Maximum Take-Off Weights. Statistics Canada classifies each itinerant aircraft movement into
one of ten Maximum Take-Off Weight categories, which have been simplified to five categories
for this analysis as summarized below and shown in Figure 2.6 and Table 2.1:
• Less than 4,000 kg: Both the total number and proportion of itinerant movements
operated by small aircraft such as the Cessna 172 and Beechcraft Baron has
decreased from 1997 to 2019. Such aircraft were responsible for 20% of itinerant
movements in 1997, 9% in 2010, and 7% in 2019.
• 4,001 kg to 9,000 kg: Aircraft such as the Beechcraft King Air, Cessna Citation, and
Beechcraft 1900 have remained relatively steady in their proportion of itinerant
movements, ranging between 25% and 34% across the dataset. The total number of
itinerant movements in this category has ranged between approximately 30,000 and
45,000 annual movements throughout the data period, with a consistent decrease
experienced from 2008 to 2019.
Final Noise Exposure Forecast Study – Winnipeg International Airport 10• 9,001 kg to 35,000 kg: The proportion of itinerant movements performed by regional
aircraft has increased from 21% in 1997 to 24% in 2019, with an average of 26%
between 2010 and 2019. Examples of aircraft in this category include the Saab 340,
ATR 42 and 72, Bombardier CRJ-200, and De Havilland Canada Dash 8-100/300/400.
The number of annual movements in this category has ranged between 19,200 (2003)
and 34,200 (2011), reaching 24,900 movements in 2019.
• 35,001 kg to 90,000 kg: Over the past ten years, the proportion of itinerant aircraft
movements in this category has increased from 26% in 2010 to 35% in 2019. Aircraft
in this category include larger regional jets and mid-range airliners such as the
Bombardier CRJ-900; Embraer 175 and 190; Boeing 737; and Airbus A220, A319,
A320, and A321. While the proportional share of movements in this category has
increased, the number of annual movements has decreased from 42,200 in 1997 to
32,000 in 2010 and 37,000 in 2019.
• Greater than 90,000 kg: Movements at the largest end of the scale have increased
from 1% of itinerant traffic in 1997 to an average of 6% between 2010 and 2019. This
includes long-range and wide-body aircraft used by passenger and cargo air carriers
such as the Boeing 747, 757, and 767 and Airbus A300, A310, and A330. The number
of annual movements in this category increased from approximately 1,200 in 1997 to
a maximum of 9,700 in 2007, before decreasing to 5,900 in 2019.
Table 2.1 - Itinerant Movements by Maximum Take-Off Weight
Maximum 1997 2010 2019
Take-off
Weight Proportion Movements Proportion Movements Proportion Movements
Less than
20% 26,561 9% 11,678 7% 7,050
4,000 kg
4,001 kg to
26% 33,360 32% 40,305 30% 31,311
9,000 kg
9,001 kg to
21% 26,860 25% 31,424 24% 24,934
35,000 kg
35,001 kg to
32% 42,241 26% 31,971 35% 36,916
90,000 kg
Greater than
1% 1,150 7% 8,736 6% 5,877
90,000 kg
Total 100% 130,172 100% 124,114 100% 106,088
Final Noise Exposure Forecast Study – Winnipeg International Airport 11Figure 2.6 - Itinerant Movements by Maximum Take-Off Weight
50,000
45,000
40,000
35,000
30,000
25,000
20,000
15,000
10,000
5,000
0
Less than 4,000 kg 4,001 kg to 9,000 kg 9,001 kg to 35,000 kg
35,001 kg to 90,000 kg Greater than 90,000 kg
Considering these inputs together, an increasing proportion of itinerant movements at
Winnipeg International Airport are performed by larger aircraft with higher Maximum Take-Off
Weights, driven primarily by the decreased use of the facility by smaller aircraft. However, as
noted in Section 2.1.1, this trend is caveated by the fact that the total number of itinerant
movements has gradually decreased at Winnipeg International Airport.
2.2 Aircraft Movement Forecast
Preface
Aircraft movements are forecast to approximate the level of traffic that could occur at Winnipeg
International Airport in the future, which informs the noise contours described in this report.
Aircraft movement forecasts, while technical in nature and prepared using the best available
data sources, are fraught with uncertainty as future conditions emerge that cannot reasonably
be predicted or modelled. Generally, forecast accuracy decreases over time as the number of
uncertainties and events that influence the underlying assumptions increases. For example,
events that could impact the accuracy of the forecasts presented herein include:
• The impacts of the ongoing COVID-19 pandemic;
• New air carrier routes and service terminations;
• Inter-airport competition;
• Changes to airport rates and fees and the price elasticity of aircraft operators; and
• The economic prospects of Winnipeg and Manitoba.
The aircraft movement forecasts prepared as part of the WAA’s 2033 Master Plan illustrate
the challenges and uncertainties that must be contended with in the planning process. As
shown in Table 2.2, the number of movements forecast in the 2013 and 2018 “Most Likely”
scenarios exceeded actual activity by approximately 1,400 and 19,000 aircraft movements,
respectively.
Final Noise Exposure Forecast Study – Winnipeg International Airport 12Table 2.2 - 2033 Master Plan Aircraft Movement Forecast (WAA)
2012 2013 2018
Actual 131,243 125,266 118,352
Low Scenario 125,000 (-266) 124,700 (+6,348)
Most Likely Scenario 126,700 (+1,434) 137,400 (+19,048)
High Scenario 128,400 (+3,134) 145,800 (+27,448)
Accordingly, the following considerations underly the forecasts presented in this report:
• The forecasts are based on the independent analysis of HM Aero and do not represent
the positions of the Province of Manitoba or the WAA;
• Forecast data should be interpreted as an illustration of what future activity at Winnipeg
International Airport could look like given the realization of an underlying set of
assumptions;
• While every effort has been made to maximize the accuracy of the forecasts contained
herein, variability in year-over-year activity should be expected; and
• The forecasts provided herein are strictly for the purposes of the Noise Exposure
Forecast Study.
Process
The aircraft movement forecasts provided herein were prepared following a five-step process
which was supported by an aviation industry economist as part of the project team:
1. Historical aircraft movement data from Statistics Canada was reviewed from 1997 to 2019
to identify trends over time.
2. Industry literature and resources were reviewed to identify potential developments that
could impact activity levels at Winnipeg International Airport. Sources included:
• Data from the International Air Transport Association, Boeing, and National Airlines
Council of Canada on the anticipated recovery of the passenger air travel sector from
the COVID-19 pandemic;
• Economic and financial institutions such as the International Monetary Fund,
Organisation for Economic Co-operation and Development, Bank of Montreal, and
Royal Bank to identify forecasted changes in Gross Domestic Product;
• Publications from the Government of Canada and WAA on future investments and
growth in air cargo activity at Winnipeg International Airport; and
• Air cargo market forecasts published by Airbus and Boeing.
3. Eight aircraft movement sub-groups were created to aid in the preparation of forecast
assumptions based on the data reporting classifications provided by Statistics Canada
previously described in Section 2.13:
3
The Statistics Canada Itinerant Air Carrier (Level I-III and Foreign) Movements dataset does not differentiate between
passenger and cargo movements. The project team has created passenger and cargo sub-classifications to more accurately
forecast the differing trends of each sector.
Final Noise Exposure Forecast Study – Winnipeg International Airport 13i. Itinerant Passenger Air Carrier Movements (Level I-III and Foreign);
ii. Itinerant Cargo Air Carrier Movements (Level I-III and Foreign);
iii. Itinerant Air Carrier Movements (Level IV-VI);
iv. Itinerant Other Commercial Movements;
v. Itinerant Private Movements;
vi. Itinerant Government Civil Movements;
vii. Itinerant Government Military Movements; and
viii. Local Movements.
4. Assumptions were developed based on the trends exhibited in each sub-group to forecast
future activity levels using the following techniques – the application of each technique
across the eight aircraft movement sub-groups is shown in Table 2.3:
• Linear on Gross Domestic Product (GDP): Increasing activity as a linear function
of GDP. If GDP grows by a certain amount, activity is forecast to increase by a
multiple of this amount.
• Log-Linear on GDP: The common logarithm of activity is a function of the common
logarithm of GDP. If GDP grows by a certain percentage, then activity is forecast to
grow by a percentage that is a multiple of the percentage GDP growth.
• Constant Organic Change: Activity is estimated to change by a fixed percentage
each year. This percentage is based on historical data and linear regression,
information from the above-noted industry resources and publications, and / or the
professional opinion of the project team.
• Secondary Sources: Growth rates from other sources that produce long-term
aviation forecasts are inputted to the Winnipeg context.
5. Forecast data was reviewed internally by the project team through a Quality Control
process.
Table 2.3 - Forecasting Techniques
Linear on Log-Linear Constant Secondary
GDP on GDP Organic Change Sources
Itinerant Passenger Air Carrier
Yes Yes No Yes
Movements (Level I-III and Foreign)
Itinerant Cargo Air Carrier
No No Yes No
Movements (Level I-III and Foreign)
Itinerant Air Carrier Movements
No No Yes No
(Level IV-VI)
Itinerant Other Commercial
No No Yes No
Movements
Itinerant Private Movements No No Yes No
Itinerant Government Civil
No No Yes No
Movements
Itinerant Government Military
No No Yes No
Movements
Local Movements No No Yes No
Final Noise Exposure Forecast Study – Winnipeg International Airport 14Assumptions
Itinerant Passenger Air Carrier Movements (Level I-III and Foreign)
Passenger air carrier movements by major airlines (Level I-III and Foreign) such as Air Canada
and WestJet are a significant source of traffic at Winnipeg International Airport. Activity in this
category is forecast in two segments:
1. 2020-2025, accounting for reduced activity as a result of COVID-19; and
2. 2026-2050, using GDP-based long-term growth models.
2020-2025
The COVID-19 pandemic is having widespread negative impacts on air carriers and airports
across Canada, including Winnipeg International Airport. Based on the most recently available
data at the time of this report’s preparation, aircraft movements at Winnipeg International
Airport have decreased by 43% from April to September 2020 compared to the same period
in 2019. As a result of decreased passenger demand, air carriers have reduced service across
the country. This has included the termination of routes between cities, deploying smaller
aircraft on retained routes, reducing the frequency of retained services, and retiring and storing
surplus aircraft.
The way demand will recover and service will be restored at Winnipeg International Airport
remains a matter of considerable uncertainty. It is anticipated that airlines will be conservative
in restoring capacity to maintain their financial strength after several years of challenging
market conditions. Based on recent materials prepared by organizations such as the
International Air Transport Association and the independent opinion of the project team, the
recovery of passenger air carrier operations to 2019 levels at Winnipeg International Airport is
assumed to occur in 2025.
The exact path that forecast activity will follow between 2020 and 2025 is a matter of
considerable discussion within the aviation industry and is subject to significant uncertainty,
including factors such as:
• Interprovincial, intra-provincial, and international travel restrictions and guidelines
imposed by public health agencies;
• Consumer confidence regarding the perceived risk of disease transmission on air
travel; and
• Changing business travel practices, such as the increased usage of digital meetings.
2026-2050
Following 2025, Linear and Log-Linear GDP models are used to forecast passenger air carrier
activity. WAA publishes domestic, transborder, and international passenger data from 2005 to
2019 which is supplemented by Statistics Canada data from 1996 to 2007. The Statistics
Canada dataset was scaled to be consistent with the WAA dataset and address minor errors.
As shown in Table 2.4, regression analyses were performed for each passenger activity
segment (domestic, transborder, and international) against historical GDP. The results are
uniformly significant, as attested by the strong F-statistics that exceed 19.4 (significance level
of over 95%). The GDP and time coefficients in both the Linear and Log-Linear analyses are
positive and highly significant. Accordingly, the Linear GDP methodology is selected as the
basis for forecasting future passenger air carrier movements.
Final Noise Exposure Forecast Study – Winnipeg International Airport 15Ten GDP forecasts are presented in Table 2.5 that form the basis of the Linear GDP passenger
forecast. Given economic uncertainty over time, these sources generally do not publish
forecasts beyond the five-year horizon. The forecasts to 2050 must therefore use shorter term
growth rates.
Table 2.4 - Historical Passenger Activity vs. GDP Regression Analysis
Transborder International
Domestic Passengers
Passengers Passengers
Linear GDP
R-Squared 0.741114 0.57583 0.9014719
F Statistic 62.979487 29.8661 201.28659
Log-Linear GDP
R-Squared 0.6891213 0.56272 0.900602
F Statistic 48.767153 28.3112 199.33243
Table 2.5 - Gross Domestic Product Forecasts
Source * Date 2020 2021 2022 2023 2024 2025 2026
Royal Bank Sep. 10, 2020 -6.0% 4.9%
Bank of
Aug. 28, 2020 -5.5% 6.0%
Montreal
National Bank Oct. 2020 -5.7% 4.1% 4.8%
Toronto
Sep. 18, 2020 -5.6% 4.1% 3.2% 1.8% 1.7% 1.7% 1.6%
Dominion Bank
CIBC Oct. 21, 2020 -5.5% 4.1%
Conference
Jun. 2020 6.7% 4.8%
Board **
International
Oct. 2020 -7.1% 5.2%
Monetary Fund
Bank of Nova
Oct. 14, 2020 -5.7% 4.1% 3.1%
Scotia
Bank of
Oct. 2020 -5.5% 4.0% 4.0%
Canada
OECD Jun. 2020 -9.4% 1.5%
Forecast Assumption 4.0% 3.0% 1.8% 1.7% 1.7% 1.7%
* Forecasts retrieved from the National Bank Monthly Economic Monitor, Oct. 2020
** As citied in the Talent Canada Website
Final Noise Exposure Forecast Study – Winnipeg International Airport 16For both the Linear and Log-Linear GDP passenger activity models, two forecasts are
prepared illustrating Moderate and Strong Growth scenarios:
1. Moderate Growth: Anticipates that GDP increases by 2.0% in 2021 and 2022, by 1.0%
in 2023, and by 1.2% in subsequent years; and
2. Strong Growth: Assumes that GDP increases at accelerated rates (3.0% annually)
from 2021 to 2028 and by 1.2% annually in subsequent years. Passenger traffic is
assumed to grow at increased rates following the COVID-19 recovery period due to
the suppression of activity that occurred during the pandemic and pent-up demand.
Passenger activity forecasts in the Linear and Log-Linear Moderate Growth and Strong Growth
scenarios are illustrated in Figure 2.7.
Figure 2.7 - Passenger Activity Forecasts
7,000,000
6,000,000
Enplaned-Deplaned Passengers
5,000,000
4,000,000
3,000,000
2,000,000
1,000,000
0
Linear GDP, Moderate Growth Linear GDP, Strong Growth
Log-Linear GDP, Moderate Growth Log-Linear GDP, Strong Growth
Based on the activity forecasts shown in Figure 2.7, corresponding passenger air carrier
movement forecasts have been prepared. This forecasting process is informed by an assumed
increase in aircraft capacity over time from 84 seats per flight (baseline average) to 99 seats
per flight in 2050, which is consistent with the historical trend of air carriers using larger aircraft.
Additionally, load factors are assumed in the forecast to be held at a constant level of 85%.
The Linear GDP – Strong Growth passenger air carrier movement forecast is selected for
inclusion in the NEF Study forecast, as shown in Figure 2.8.
Final Noise Exposure Forecast Study – Winnipeg International Airport 17Figure 2.8 - Level I-III and Foreign Passenger Air Carrier Movement Forecast
120,000
100,000
Aircraft Movements
80,000
60,000
40,000
20,000
-
2019
2020
2021
2022
2023
2024
2025
2026
2027
2028
2029
2030
2031
2032
2033
2034
2035
2036
2037
2038
2039
2040
2041
2042
2043
2044
2045
2046
2047
2048
2049
2050
Itinerant Cargo Air Carrier Movements (Level I-III and Foreign)
Cargo air carrier movements by Level I-III and Foreign operators such as CargoJet, FedEx,
UPS, and DHL are forecast separately from passenger air carrier movements to account for
the different impacts of the COVID-19 pandemic and the long-term role of Winnipeg
International Airport in freight and logistics. It is understood that the air cargo sector is an area
of increasing focus for the WAA given the role of Winnipeg as an inland port with extensive
truck and rail distribution connections, growth in e-commerce, and increasing livestock
exports. This is underscored by a $62M multi-tenant air cargo logistics facility that is planned
to open in the short-term horizon, partly funded by the Federal Government’s National Trade
Corridors Fund.
As with passenger air services, increased air cargo throughput (tonnage) is not uniformly
correlated with cargo air carrier movements. As cargo volumes grow, additional aircraft can be
deployed, the load factor of existing flights can be increased towards capacity, and larger
aircraft can be operated. For example, a route operated by a Boeing 757F (maximum payload
of 60,000 lbs) that is experiencing growth could have:
• Two Boeing 757Fs deployed, for a total payload of 120,000 lbs; or
• One Boeing 767F substituted with a maximum payload of 120,000 lbs.
The 2019 baseline for air cargo movements was estimated using flight arrival and departure
information made publicly available by the WAA. A flight-by-flight review of the database was
completed to identify the number of cargo air carrier flights that occur on a daily basis, which
was then multiplied assuming that each service operates five times per week, year-round.
Accordingly, of the 2019 Statistics Canada total of 88,042 Level I-III and Foreign itinerant air
carrier movements, 7,520 movements were estimated to be operated by cargo air carriers.
Final Noise Exposure Forecast Study – Winnipeg International Airport 18Historical data on the number of air cargo movements that occurred in previous years was not
available for review by the project team; accordingly, the identification of trends over time could
not be completed. Boeing, in its World Air Cargo Forecast, anticipates that Canadian domestic
air cargo market may grow by 2.9% annually between 2020 and 2039, while transborder air
cargo volumes may increase by 1.1% annually during the same period. Airbus, in its most
recent Global Market Forecast, anticipates that air cargo may increase by 3.6% annually
between 2018 and 2038, although this is a global metric that does not account for the specifics
of the Canadian context. Both growth metrics measure air cargo in Freight Tonne Kilometres
or Revenue Tonne Kilometres – i.e., the weight of air cargo multiplied by the distance flown.
As noted previously, forecast increases in air cargo Revenue Tonne Kilometres may not
correlate uniformly with increased air cargo movements as residual capacity is absorbed and
/ or larger aircraft are deployed.
While historical data is not available to identify trends in air cargo movements at Winnipeg
International Airport over time, air cargo movements may reasonably be expected to increase
at Winnipeg in the future based on:
• The favourable air cargo market outlooks published by Airbus and Boeing;
• The proactive efforts being taken by the WAA and Government of Canada in improving
the air cargo infrastructure of Winnipeg International Airport; and
• Winnipeg’s strength and role as an inland port and distribution centre.
Accordingly, an assumed constant annual growth rate in itinerant cargo air carrier movements
(Level I-III and Foreign) of 1% has been selected by the project team and is applied from the
2019 baseline to 2050. Assuming that cargo services operate five days per week, this
represents a conservative increase from approximately 29 weekday air cargo movements (15
air cargo flights per weekday) in 2019 to 40 weekday air cargo movements (20 air cargo flights
per weekday) in 2050.
Itinerant Air Carrier Movements (Level IV-VI)
Winnipeg International Airport serves an important role in supporting smaller Level IV-VI air
carriers. A consistent trend in movements in this category between 2001 and 2019 is not
identifiable, with periods of growth to approximately 10,000 annual movements followed by
declines to between 3,000 and 5,000 movements. Given the variability that is exhibited in
historical itinerant Level IV-VI air carrier operations, the forecast assumes that movements in
this category will be held at the 2001-2019 average of approximately 6,400 annual movements.
Itinerant Other Commercial Movements
Other commercial itinerant aircraft movements, after decreasing significantly from 2003 to
2008, have ranged over the last ten years between 400 and 700 annual movements. Itinerant
movements by other commercial aircraft operators are assumed to remain at their 2010-2019
annual average of approximately 500 movements. This approach to forecasting itinerant other
commercial movements is used as:
• Traffic has remained relatively stable over the past ten years;
• Continued operations may reasonably be expected to continue across the forecast
period; yet
• A specific event has not been identified that may result in a significant increase in such
movements.
Final Noise Exposure Forecast Study – Winnipeg International Airport 19Itinerant Private Movements
Itinerant movements by private aircraft operators are assumed to be held at their 2010-2019
annual average of 3,900 movements across the forecast horizon. This assumption is a
departure from the decline in traffic exhibited from 1997 to 2019 and is reliant on Winnipeg
International Airport continuing to attract a proportion of regional private itinerant traffic due to
its airside infrastructure, support services, and Fixed-Base Operators.
Itinerant Government Civil Movements
Itinerant government civil aircraft movements have exhibited year-over-year variability
throughout the 1997 to 2019 dataset, ranging between 3,000 and 5,000 annual movements,
with an overall positive trend. Winnipeg International Airport is a significant part of the Province
of Manitoba’s aviation operations, including air ambulance flights, wildfire suppression, and
justice transportation. While recent steps by the Province to contract these services to air
carriers may change the manner in which such movements are recorded, the need for these
activities are expected to remain the same and may reasonably be expected to increase over
time. Accordingly, a 0.4% annual growth rate is applied based on a linear regression analysis
of 1997-2019 movements in this category.
Itinerant Government Military Movements
Military traffic is assumed to remain at the annual average of 3,100 itinerant movements
experienced between 2010 and 2019. This considers the permanent presence of the Royal
Canadian Air Force’s 17 Wing and associated units such as 402 Squadron and 435 Squadron,
as well as historic instances of year-over-year increases.
Local Movements
Local aircraft movements have decreased by an average of 1.0% annually from 2010 to 2019
and have ranged between 8,700 and 13,700 annual movements in this period. The forecast
assumes that local movements stabilize at the 2010-2019 average of 10,300 movements. This
assumption considers that while significant new generators of local movements (e.g., a flight
training unit) are not anticipated given the availability of nearby general aviation and training
airports (i.e., St. Andrews Airport, Steinbach Airport, Southport Airport), a degree of activity in
this category can reasonably be expected to continue.
Forecast Results
Based on the assumptions described above, forecasted changes in itinerant, local, and total
aircraft movements are shown in Figure 2.9, Table 2.6, and Table 2.7. Aircraft movements at
Winnipeg International Airport are forecast to recover to pre-COVID (2019) levels between
2024 and 2025 before increasing by an annual average of between 0.4% and 1.0% to 2050.
Based on these assumptions, approximately 137,000 annual movements are forecast to occur
in 2050, reversing approximately 20 years of annual decreases are returning to 2012 activity
levels.
Final Noise Exposure Forecast Study – Winnipeg International Airport 20Figure 2.9 - Aircraft Movement Forecast
160,000
140,000
120,000
Aircraft Movements
100,000
80,000
60,000
40,000
20,000
0
Itinerant Movements Total Movements Local Movements
Table 2.6 - Aircraft Movement Forecast
Year Local Itinerant Total
Historical Aircraft Movements
1997 25,049 130,172 155,221
2000 17,640 137,036 154,676
2005 7,609 129,327 136,936
2010 10,846 124,114 134,960
2015 8,710 110,094 118,804
2019 9,840 106,088 115,928
Forecast Aircraft Movements
2020 10,294 48,006 58,300
2025 10,294 106,866 117,610
2030 10,294 113,578 123,872
2035 10,294 115,750 126,044
2040 10,294 117,966 128,260
2045 10,294 120,227 130,521
2050 10,294 126,508 136,801
Final Noise Exposure Forecast Study – Winnipeg International Airport 21Table 2.7 - Forecast Average Annual Growth Rates
Period Average Annual Change
Historical Aircraft Movements
1997-2010 -1.0%
2011-2019 -2.0%
Forecast Aircraft Movements
2019-2025 0.2%
2026-2030 1.0%
2031-2035 0.4%
2036-2040 0.4%
2041-2045 0.4%
2046-2050 1.0%
Final Noise Exposure Forecast Study – Winnipeg International Airport 223 RUNWAY CAPACITY ANALYSIS
3.1 Purpose
The capacity of an airfield is defined as the number of aircraft movements that can be
accommodated within a given timeframe – typically, capacity is calculated on an hourly, daily,
and / or annual basis. In the context of this report, the capacity of Winnipeg International Airport
is analyzed solely with respect to runway capacity, omitting the consideration of taxiway,
apron, and terminal building metrics. Capacity can be further defined as:
• Maximum Throughput Capacity: The theoretical number of aircraft movements that
can occur in a timeframe without operational disruptions – for example, without
temporary runway closures to retrieve debris, snow clearing, and wildlife management.
• Practical Capacity: The number of aircraft movements that can occur given the
existence of disruptions (e.g., inclement weather conditions) without significant delays.
The purpose of calculating the capacity of the runway system in the NEF Study is twofold:
1. To assist the Province of Manitoba in determining whether runway demand, in terms
of annual aircraft movements, is likely to exceed available capacity and whether an
additional runway may be required within the 30-year horizon (2050) of this study; and
2. To inform the preparation of the ‘ultimate-term’ noise contour set, which considers the
maximum utilization of Winnipeg International Airport including the addition of a new
runway.
The runway system capacity analysis is based on the independent analysis of the project team
and should not be interpreted as representing the position of the WAA, NAV CANADA, or other
parties. Further, the intent of the analysis is not to make a definitive conclusion as to whether
a new runway may be required at Winnipeg International Airport, but instead to assist the
Province in selecting an appropriate set of noise contours for future land use policy
development and implementation.
3.2 Previous Studies
The following publicly available studies were reviewed by the project team to inform the
capacity analysis.
2000 Airport Development Plan Summary
The WAA 2000 Airport Development Plan Summary included a forecast of Planning Peak Hour
Aircraft Movements, which is calculated as the average demand of the ten busiest hours for
each of the three busiest months of the year. The 2000 Airport Development Plan Summary
forecasted that the Planning Peak Hour Aircraft Movements for Visual Flight Rules (VFR)
operations would increase from 43 movements in 1999 to 60 movements in 2020, with the
Instrument Flight Rules (IFR) Planning Peak Hour Aircraft Movements increasing from 34 to
50 movements in the same period. The report also stated that:
“There is sufficient airside capacity overall, but by the end of the planning period forecast
demand will exceed 90% of total capacity, which may result in congestion and delays.”
While the report forecasted that annual aircraft movements would increase from 157,000 in
2000 to 227,000 in 2020, actual activity in 2019 was approximately 116,000 total aircraft
movements. Accordingly, it may be inferred that residual capacity exists on an annual basis
based on this statement.
Final Noise Exposure Forecast Study – Winnipeg International Airport 23You can also read