CEC Drought Summit 2020 The Mexican Drought Monitor - Reynaldo Pascual Ramírez Seasonal Forecast Project
←
→
Page content transcription
If your browser does not render page correctly, please read the page content below
CEC Drought Summit 2020

The Mexican Drought Monitor

     Reynaldo Pascual Ramírez
     Seasonal Forecast Project
                                                       1
                                 September 29th 2020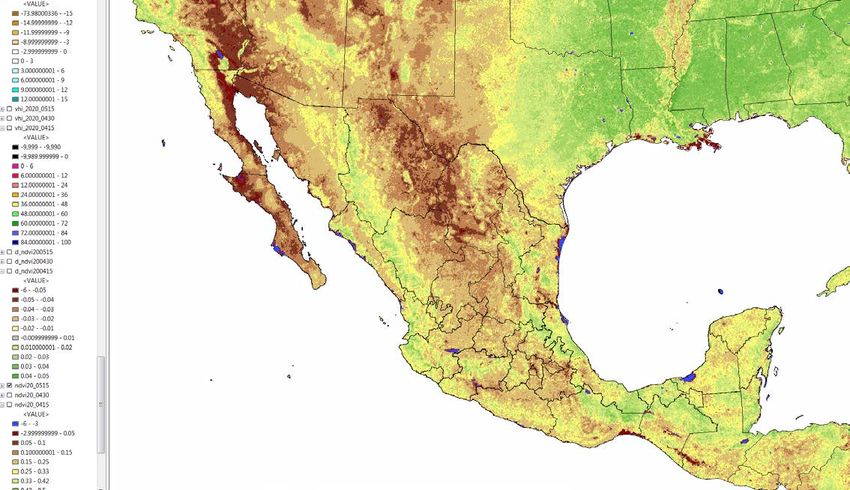
Outline

I. Relevance of drought monitoring

II. Background of the Mexican Drought Monitor (MSM)

III.Methodology of the MSM

IV. Actions to strengthen the Mexico Drought Monitor

                                                       2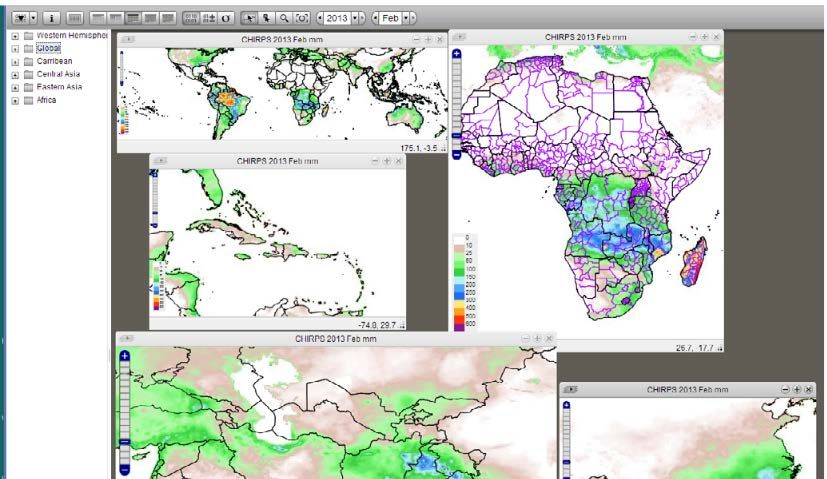
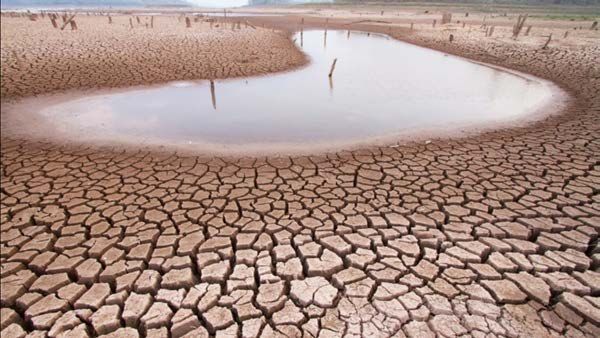
I. Relevance of drought monitoring Drought is a recurring phenomenon that can be observed in all climatic regimes, even in deserts and rainforests. It is a natural hazard with considerable effects, since it affects the population and different economic sectors. The impact of droughts (affected area) becomes greater than that of other phenomena, which are generally limited to flood plains, coastal regions or the path of a storm (Svoboda & Fuchs, 2106). Droughts are characterized by their intensity, location, duration, and development. They are caused by atmospheric or climatic events that suppress precipitation or limit the availability of surface or underground water, in such a way that conditions are much drier than normal or the available humidity is limited in some way to a potentially harmful point (Svoboda & 3 Fuchs, 2106).
I. Relevance of drought monitoring
That is why it is of great importance to have
the objective of monitoring this phenomenon, the
evolution of the drought gradually becomes
visible in the changes in precipitation,
temperature, the general situation of the
surface and underground water reserves in a
region. , as well as in the state of the
vegetation. Therefore, the inclusion or
integration of various drought indicators and
indices facilitate its monitoring.
In Mexico, the National Meteorological Service
of the National Water Commission has followed
this phenomenon continuously since the end of
2002, through the Drought Monitor of Mexico, the
main subject of this report, for which they will
be described below among other issues, the
background and the methodology used to prepare
this monitoring.
4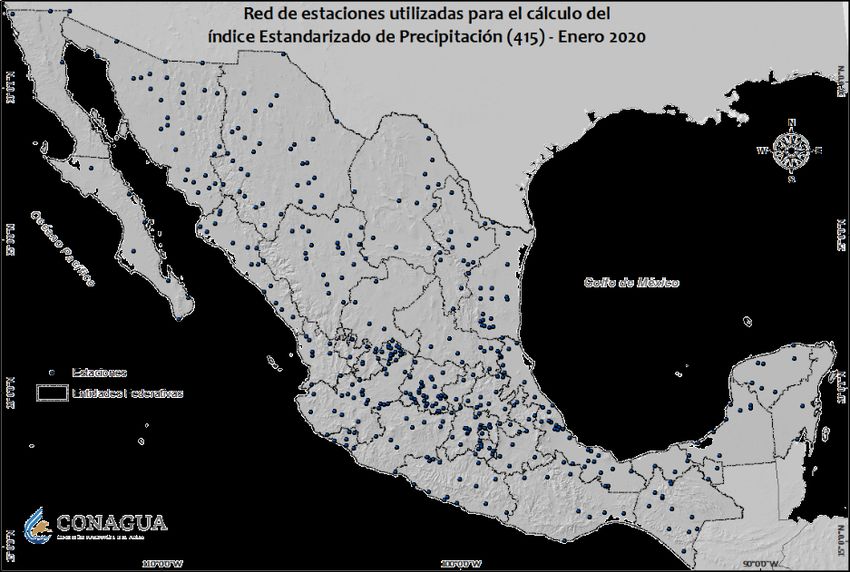
I. Relevance of drought monitoring

Meteorological Drought: It is
characterized by below normal
rains, for several months.

Agricultural Drought: The
soil moisture is not enough
for the development of crops.

Hydrological Drought: Lack of
sufficient supplies of
surface and ground water.

Socio-economic drought: Water
scarcity affects human
activities.
                                                          5
                                                              1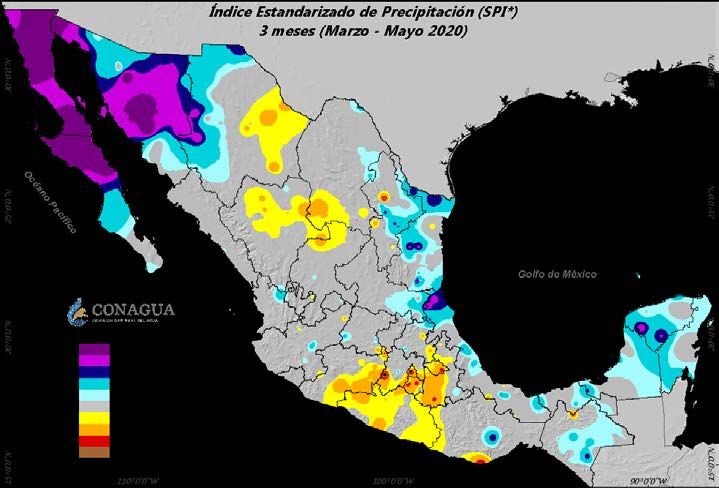
II. Background of the Mexican Drought Monitor (MSM)

North American Drought Monitor (NADM)

The NADM is a cooperative effort between analysts from Mexico (CONAGUA-National Weather Service), the United
States (NOAA, USDA, NDMC, NCDC now NCEI), and Canada (Agriculture and Agri-Food Canada) to monitor drought
in the three-country region, since the end of 2002.

        December 2002                           July 2006                            May 2020
Integration of the regional map: Through a monthly rotation, a lead author is appointed who compiles and
integrates the evaluations of the state of the drought in each country. The lead author merges the vector
files, edits the descriptive texts (drought narrative) and produces the final maps and documents that are
published on the NADM website.
                                                                                                     6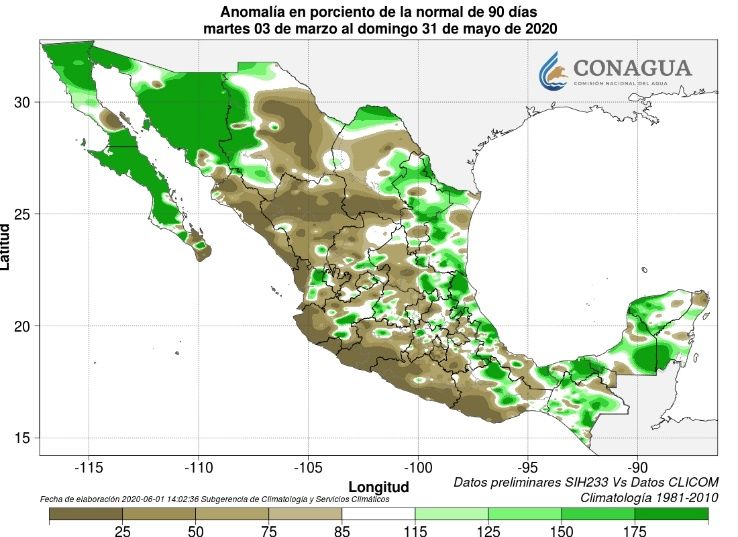
II. Background of the Mexican Drought Monitor (MSM)

Although NADM began in 2002, it was not until 2014 that CONAGUA-SMN creates a national map for Mexico, and
continues to work in a coordinated manner with the United States and Canada to produce the monthly NADM
map.

The MSM adapted the methodology and characterization of drought from the United States Drought Monitor
(USDM) and NADM, the latter going from the abnormally dry category (D0) to exceptional drought (D4) and the
classification of short and long impacts. period.

                            Anormalmente Seco (D0): Se trata de una condición de sequedad, no es una categoría de sequía.
                            Se presenta al inicio o al final de un periodo de sequía. Al inicio de un período de sequía:
                            debido a la sequedad de corto plazo puede ocasionar el retraso de la siembra de los cultivos
                            anuales, un limitado crecimiento de los cultivos o pastos y existe el riesgo de incendios. Al
                            final del período de sequía: puede persistir déficit de agua, los pastos o cultivos pueden no
                            recuperarse completamente.
                            Sequía Moderada (D1): Se presentan algunos daños en los cultivos y pastizales; existe un alto
                            riesgo de incendios, bajos niveles en ríos, arroyos, embalses, abrevaderos y pozos, se
                            sugiere restricción voluntaria en el uso del agua.
                            Sequía Severa (D2): Probables pérdidas en cultivos o pastos, alto riesgo de incendios, es
                            común la escasez de agua, se deben imponer restricciones en el uso del agua.
                            Sequía Extrema (D3): Pérdidas mayores en cultivos y pastos, el riesgo de incendios forestales
                            es extremo, se generalizan las restricciones en el uso del agua debido a su escasez.
                            Sequía Excepcional (D4): Pérdidas excepcionales y generalizadas de cultivos o pastos, riesgo
                            excepcional de incendios, escasez total de agua en embalses, arroyos y pozos, es probable una
                            situación de emergencia debido a la ausencia de agua.
                            Impactos dominantes:
                            S= Corto período, típicamente menor a 6 meses (agricultura, pastizales)
                            L= Largo período, típicamente mayor a 6 meses (hidrología, ecología)
                                                                                                                        7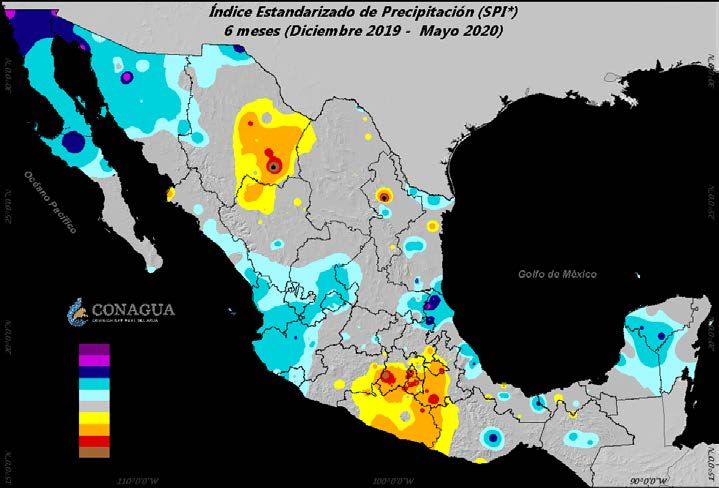
III. Methodology of the MSM

The Drought Monitor of Mexico is a product that aims to determine the
regions with drought in the country, resulting from the analysis of
various drought indices and indicators.

Preparation: 2 times a month

The indices used are the following:

Meteorological indices:
Precipitation anomalies in millimeters and in percent of normal
Standardized Precipitation Index (SPI)
Standardized Precipitation and Evaporation Index (SPEI)
Hydrological indices:
Leaky Bucket Soil Moisture Model
Streamflow Drought Index (SDI)
Percentage of water in dams (Indicator)
Vegetative indices:
Vegetation Health Index (VHI)
Normalized Difference Vegetation Index (NDVI)

                                                                        8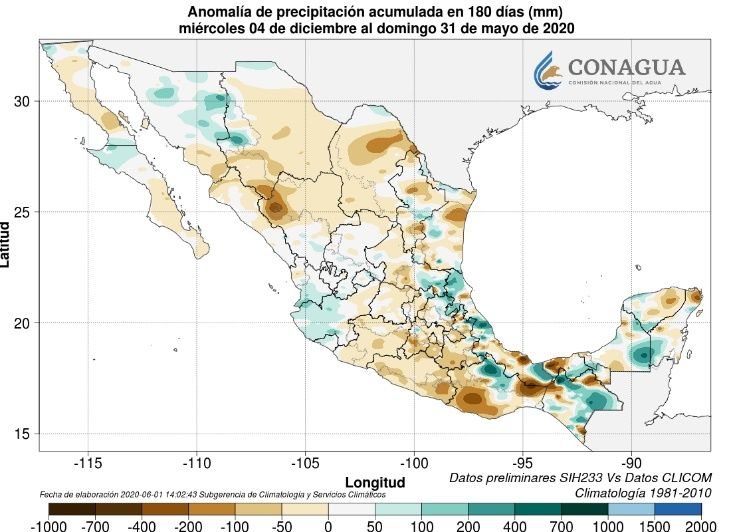
III. Methodology of the MSM

                                                                                         Rangos de Clasificación:

Anomalía de lluvia en base al porciento de la normal. Varias escalas de tiempo, las más usuales
1, 3, 6 y 12 meses.

Anomalía de precipitación acumulada mensual en milímetros (mm). En varias escalas de tiempo: 1, 3, 6 y 12
meses.
Fuente: Calculado información disponible del Sistema de Información Hidroclimatológica (SIH) de la Gerencia de Aguas
                                                                                                                   9
Superficiales e Ingeniería de Ríos-Conagua. Climatología base 1981-2010 obtenido de la Base de Datos CLICOM del Servicio
Meteorológico Nacional-Conagua.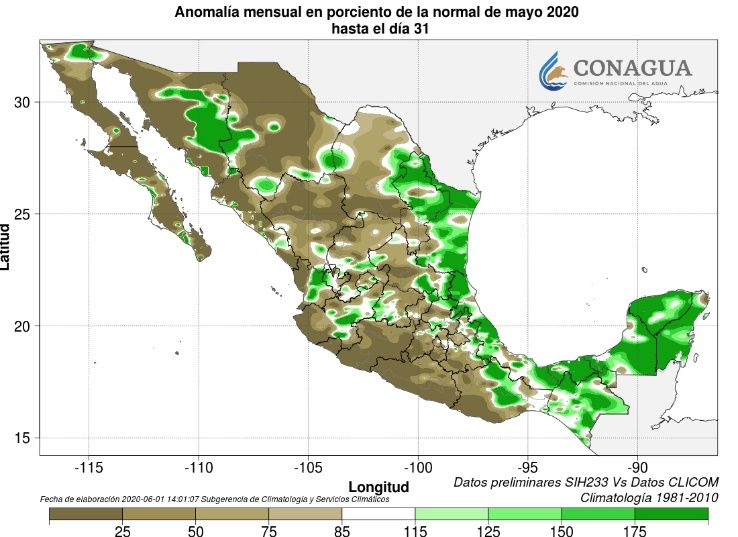
III. Methodology of the MSM

                                                                                                  Rangos de Clasificación:
• SPI. It quantifies a conditions of deficit or excess of precipitation, for
  a determined period of time. Different time scales are handled, the most
  common are SPI-3, SPI-6, SPI-9 and even SPI-12 months.

• CONAGUA SMN calculates the SPI from a set of stations, this set may vary
  due to the loss of long-term stations or the incorporation of those that
  meet the following requirements:
• Long series (over 30 years). Less than 20% missing data in the period.

 Fuente: Calculado información disponible del Sistema de Información Hidroclimatológica (SIH) de la Gerencia de Aguas
 Superficiales e Ingeniería de Ríos-Conagua. Series históricas obtenidas de la Base de Datos CLICOM del Servicio  10
 Meteorológico Nacional-Conagua.
III. Methodology of the MSM
3-months SPEI June-August 2020
• SPEI. Now as experimental, based on gridded data from
CONAGUA SMN data base.
11III. Methodology of the MSM
Rangos de Clasificación:
Estimation of soil moisture using a one-layer hydrologic model. The model uses precipitation and
temperature to calculate soil moisture, evaporation, and runoff. Potential evaporation is estimated by
temperature.
Fuente: Modelo de Humedad del Suelo Leaky Bucket. Centro de Predicción del Clima (CPC-NOAA). 12III. Methodology of the MSM
Water Availability on reservoirs by
CONAGUA GASIR Streamflow Drought Index SDI by CONAGUA
GASIR
It uses river flow values and normalization
method associated with SPI. It allows analyzing
the wet and dry periods, as well as the intensity
in standard deviations of these episodes.
13III. Methodology of the MSM
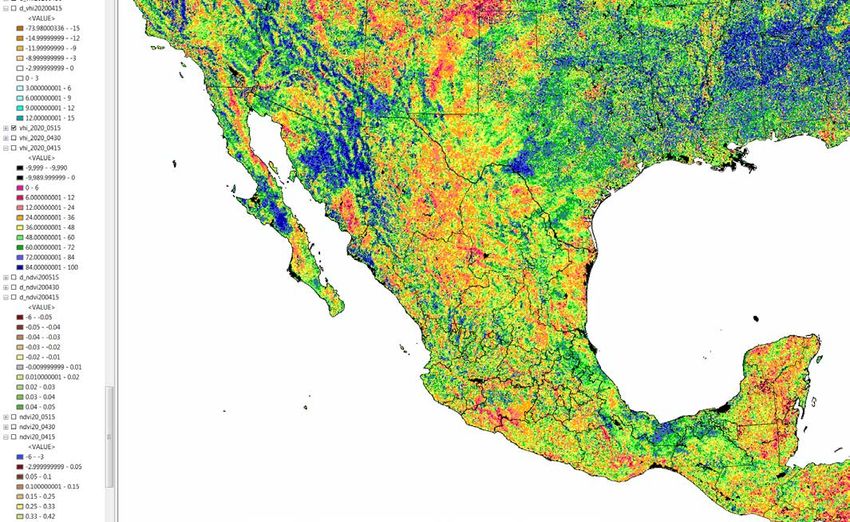
VHI. Derived from remote sensing that
measures the stress of the vegetation
due to the lack or excess of water or
the temperature. If the index has
values less than 40 it indicates
different levels of stress. When the
index indicates values greater than 60
(favorable condition), full production
can be expected.
Rangos de Clasificación
Fuente: Calculado en el Centre for Satellite Applications and Research (STAR-NESDIS) de la NOAA.
14III. Methodology of the MSM
The NDVI measures the greenness and
vigor of vegetation over a period to
reduce alteration of results by cloud
cover, and can detect drought-related
stress on vegetation.
Radiance values obtained in the
visible and near infrared channels
are used to calculate the NDVI. This
product is an input from the
Vegetation Health Satellite Index
(VHI).
Fuente: Calculado en el Centre for Satellite Applications and Research (STAR-NESDIS) de la
NOAA 15III. Methodology of the MSM
Recopilación de Obtención del mapa del
insumos de cada uno de Monitor de Sequía de
los Índices de Sequía México
(Consulta de
diferentes bases de
datos)
Procesamiento SIG,
para unificar insumos
en dos tipos de
formatos: shapefile y Integración al Monitor de
raster sequía de América del Norte
Reunión técnica de
analistas para la
determinación de áreas
con sequía en el país
(digitalización y
creación de polígonos
shapefile).
Integración de un
proyecto de trabajo SIG
para el análisis,
Proyecto SIG
despliegue y
visualización de
índices de sequía
Índices
16III. Methodology of the MSM
Currently the Mexico Drought Monitor includes:
Drought depiction at Nacional and State level,
municipalities in drought, tables, graphs and vector
files available for download.
https://smn.conagua.gob.mx/es/climatologia/monitor-de-sequia/monitor-de-sequia-en-mexico 17V. Actions to strengthen the Mexican Drought Monitor
Standardized Precipitation Index (SPI) with the CHIRPS Database.
Features and benefits of the CHIRPS Database *:
• The CHIRPS database is spatially robust.
• Global rainfall estimation using geostationary satellite images.
• In the case of Mexico, it contains data from around 1000 rainfall
stations.
• Data availability: monthly, decennial (10 days) and pendatal (5 days)
from 1981 to date.
• Resolution of 0.05 ° (approx. 5.5 km) that will allow to contribute to the
analysis of the MSM at higher spatial resolution.
• Information Source: Department of Geography of the University of
California in Santa Barbara, United States.
The Climate Hazards group Infrared Precipitation with Stations
(CHIRPS, por sus siglas en inglés)
18V. Actions to strengthen the Mexican Drought Monitor
CONAGUA-SMN
CHIRPSV. Actions to strengthen the Mexican Drought Monitor
Use of the Evaporative Demand Drought Index (EDDI) in northern country. This index
indicates how anomalous the atmospheric evaporation demand (E0; also known as "the
thirst of the atmosphere") is for a given location and during a period of interest.
It is an index that allows detecting short-term “flash drought” droughts. At the
moment the index does not have coverage further south of the country.
Fuente: The Evaporative Demand Drought Index (EDDI), NOAA 20V. Actions to strengthen the Mexican Drought Monitor
To use percentile precipitation maps instead anomalies.
21References [Svoboda & Fuchs, 2106] Organización Meteorológica Mundial (OMM) y Asociación Mundial para el Agua (2016): Manual de indicadores e índices de sequía (M. Svoboda y B.A. Fuchs). Programa de gestión integrada de sequias, Serie 2 de herramientas y directrices para la gestión integrada de sequias. Ginebra. Monitor de Sequía en México - Servicio Meteorológico Nacional (2020). Disponible en: https://smn.conagua.gob.mx/es/climatologia/monitor-de-sequia/monitor-de-sequia-en-mexico North American Drought Monitor (2020). Disponible en: https://www.ncdc.noaa.gov/temp-and- precip/drought/nadm/
The CONAGUA SMN Drought Monitor Project
               Minerva López Quiroz
            Yenifeer Loranca Dominguez
           Ana Elena Martínez Melgarejo
              Luis Alberto Chablé Pech
             Reynaldo Pascual Ramírez

       The SMN main official staff
                  Dr. Jorge Zavala Hidalgo
                Dr. Ricardo Prieto González
                 M.C. Juan Carlos Ramos

                                              23
You can also read