CHHATRAPATI SHIVAJI JAYANTI 19TH FEBRUARY, 2021 - WISE M NEYA Weekly Update from SMC - SMC Global
←
→
Page content transcription
If your browser does not render page correctly, please read the page content below

A Weekly Update from SMC
2021: Issue 774, Week: 8th – 12th February           (For private circulation only)

 WISE M NEY
                                             HAPPY
                                             CHHATRAPATI

                                                                                Brand smc 557

CHHATRAPATI SHIVAJI JAYANTI
19TH FEBRUARY, 2021

From The Desk Of Editor
Contents
I
n the week gone by, global markets moved higher on the back of upbeat earnings,
Equity 4-7 data suggesting stability in labour market, and by optimism over progress on a US
Derivatives 8-9 pandemic relief package. Meanwhile, governments around the world looked poised
to boost spending to help economies recover from the coronavirus and vaccine roll-
Commodity 10-13
out programs accelerated. US manufacturing activity slowed slightly in January, while
Currency 14 a measure of prices paid by factories for raw materials and other inputs jumped to its
IPO 15 highest level in nearly 10 years, strengthening expectations inflation will perk up this
year. Japan’s services sector shrank at the fastest pace in five months in January, as a
FD Monitor 16 heavy blow to demand from resurgence in coronavirus infections and a state of
Mutual Fund 17-18 emergency in parts of the country greatly hurt new business orders. The Bank of
England told banks to start getting ready for negative interest rates, while saying that
message shouldn’t be taken as a signal that the policy is imminent.
SMC GLOBAL SECURITIES LTD. Back at home, the euphoria in the markets continued unabated, with Nifty50 index
REGISTERED OFFICES:
hitting the 15,000-mark for the first time ever. Markets cheered on the SBI chairman
11 / 6B, Shanti Chamber, Pusa Road, New Delhi 110005.
stating that the bank aims to control credit cost well below its 2 percent guidance and
Tel: 91-11-30111000, Fax: 91-11-25754365
the total stressed assets, which is slippages added with restructured accounts, will
remain below Rs 60,000 crore this year. Also bank expects credit demand to improve
MUMBAI OFFICE:
from corporate borrowers in the next two quarters. The union budget was a very
Lotus Corporate Park, A Wing 401 / 402 , 4th Floor ,
balanced and a growth-oriented one. Based on 6 pillars namely Health and wellbeing,
Graham Firth Steel Compound, Off Western Express Highway, Infrastructure, Inclusive development, Development of human capital, Minimum
Jay Coach Signal, Goreagon (East) Mumbai - 400063 government and maximum governance, Government has tried to give possible relief
to the common man as well as the economy through the much-needed stimulus to
Tel: 91-22-67341600, Fax: 91-22-67341697
boost demand and consumer confidence without any tax hikes. Giving more
KOLKATA OFFICE: importance to the Healthcare, the government has earmarked large pool of funds for
18, Rabindra Sarani, Poddar Court, Gate No-4,5th Floor, Kolkata-700001 vaccines with a clear commitment to providing healthcare support to citizens of India,
Tel.: 033 6612 7000/033 4058 7000, Fax: 033 6612 7004/033 4058 7004 keeping in view that the challenge from the pandemic is not yet fully over. Finance
AHMEDABAD OFFICE : minister has laid out a Rs 64,180 crore spending plan for healthcare over the next six
10/A, 4th Floor, Kalapurnam Building, Near Municipal Market, years. Incremental investments in the insurance and infrastructure sectors will
C G Road, Ahmedabad-380009, Gujarat definitely give a boost to the economy and ensure financial inclusion of the masses.
Tel : 91-79-26424801 - 05, 40049801 - 03 Government has raise capital expenditure up +34.5% (Vs FY21 BE) at Rs 5.54 lakh crore
CHENNAI OFFICE:
in FY 22. Monetization is another very big kick. On the disinvestment front,
Salzburg Square, Flat No.1, III rd Floor, Door No.107, Harrington Road,
government has target at Rs 1.75 lakh cr for FY22. Privatization got mega push in
Chetpet, Chennai - 600031.
Budget 2021. Besides, government has decided to privatise 2 PSU banks, one general
insurance company in FY22. Meanwhile, RBI kept interest rates on hold for a fourth
Tel: 044-39109100, Fax -044- 39109111
straight meeting while maintaining an ‘accommodative stance’ as long as necessary at
SECUNDERABAD OFFICE: least through the current financial year to the next year. The central bank also sees
315, 4th Floor Above CMR Exclusive, BhuvanaTower, FY22 GDP growth at 10.5 per cent. The RBI governor said that the inflation has eased
S D Road, Secunderabad, Telangana-500003 below the level of 6 per cent. Outlook on growth has improved significantly. Rating
Tel : 040-30031007/8/9
agency Moody's on Wednesday India's fiscal deficit projections are higher than
expected and slower consolidation will constrain its fiscal strength over the medium
DUBAI OFFICE:
term.
2404, 1 Lake Plaza Tower, Cluster T, Jumeriah Lake Towers,
On the commodity market front, Commodities are trading on front foot in 2021 with
PO Box 117210, Dubai, UAE
rebound in energy, agri and some metals on swift vaccination across the world amid
Tel: 97145139780 Fax : 97145139781
some improving economic data, despite the fact that dollar capped the upside. The
Email ID : pankaj@smccomex.com
dollar headed for its best weekly gains in three months, lifted by growing confidence
smcdmcc@gmail.com
that the U.S. economic recovery will outpace global peers. The prices of many
agricultural commodities spiked higher on the back of record demand from Asia and
Printed and Published on behalf of the growing risk of grain export restrictions. Recent downside in bullion may spur
Mr. Saurabh Jain @ Publication Address buying in physical demand. Sales of U.S. gold bullion coins rose 258% in 2020 while
11/6B, Shanti Chamber, Pusa Road, New Delhi-110005 silver coin demand was up 28%, the U.S. Gold and silver should trade in a range of
Website: www.smcindiaonline.com 45800-49200 levels and 65000-70000 levels respectively. After continuous rise, crude
Investor Grievance : igc@smcindiaonline.com may see a lazy rally in coming days with upside capped near 43500 levels. Inflation
Rate of Mexico, Germany, China and US, GDP of UK, Michigan Consumer Sentiment
Printed at: S&S MARKETING Prel of US etc are few triggers this week for commodities.
B-26, Ground Floor, Patparganj Industrial Area, Delhi - 110092 (India)
Ph.: +91-11- 43035012, 42720372, Email: ss@sandsmarketing.in
(Saurabh Jain)
SMC Global Securities Ltd. (hereinafter referred to as “SMC”) is a registered Member of National Stock Exchange of India Limited, Bombay Stock Exchange Limited and its associate is member of MCX stock Exchange Limited. It is also
registered as a Depository Participant with CDSL and NSDL. Its associates merchant banker and Portfolio Manager are registered with SEBI and NBFC registered with RBI. It also has registration with AMFI as a Mutual Fund Distributor.
SMC is a SEBI registered Research Analyst having registration number INH100001849. SMC or its associates has not been debarred/ suspended by SEBI or any other regulatory authority for accessing /dealing in securities market.
SMC or its associates including its relatives/analyst do not hold any financial interest/beneficial ownership of more than 1% in the company covered by Analyst. SMC or its associates and relatives does not have any material conflict of
interest. SMC or its associates/analyst has not received any compensation from the company covered by Analyst during the past twelve months. The subject company has not been a client of SMC during the past twelve months. SMC or
its associates has not received any compensation or other benefits from the company covered by analyst or third party in connection with the research report. The Analyst has not served as an officer, director or employee of company
covered by Analyst and SMC has not been engaged in market making activity of the company covered by Analyst.
The views expressed are based solely on information available publicly available/internal data/ other reliable sources believed to be true.
SMC does not represent/ provide any warranty express or implied to the accuracy, contents or views expressed herein and investors are advised to independently evaluate the market conditions/risks involved before making any
investment decision.
DISCLAIMER: This report is for informational purpose only and contains information, opinion, material obtained from reliable sources and every effort has been made to avoid errors and omissions and is not to be construed as an advice or an offer to act on views
expressed therein or an offer to buy and/or sell any securities or related financial instruments, SMC, its employees and its group companies shall not be responsible and/or liable to anyone for any direct or consequential use of the contents thereof. Reproduction of the
contents of this report in any form or by any means without prior written permission of the SMC is prohibited. Please note that we and our affiliates, officers, directors and employees, including person involved in the preparation or issuance of this material may; (a) from time
to time, have long or short positions in, and buy or sell the securities thereof, of company (ies) mentioned herein or (b) may trade in this securities in ways different from those discussed in this report or (c) be engaged in any other transaction involving such securities and earn brokerage or
other compensation or act as a market maker in the financial instrument of the company (ies) discussed herein or may perform or seek to perform investment banking services for such Company (ies) or act as advisor or lender / borrower to such company (ies) or have other potential
conflict of interest with respect of any recommendation and related information and opinions, All disputes shall be subject to the exclusive jurisdiction or Delhi High Court.
SAFE HARBOR STATEMENT: Some forward statements on projections, estimates, expectations, outlook etc are included in this update to help investors / analysts get a better comprehension of the Company's prospects and make informed investment decisions.
Actual results may, however, differ materially form those stated on account of factors such as changes in government regulations, tax regimes, economic developments within India and the countries within which the Company conducts its business, exchange rate and
interest rate movements, Impact of competing products and their pricing, product demand and supply constraints. Investors are advised to consult their certified financial advisors before making any investments to meet their financial goals.
EQUITY
NEWS TREND SHEET
DOMESTIC Stocks *Closing Trend Date Rate Support Resistance Closing
Economy
Price Trend Trend S/l
• The Reserve Bank of India’s Monetary Policy Committee has kept the Changed Changed
interest rates unchanged, maintaining repo rate at 4% and the reverse repo
rate at 3.35%. The MPC decided to continue with an accommodative stance S&P BSE SENSEX 50732 UP 17.07.20 37020 42850 - 41450
of monetary policy as long as necessary, at least through the current NIFTY50 14924 UP 17.07.20 10901 12600 - 12200
financial year and into next year to revive growth on a durable basis and NIFTY IT 25332 UP 05.06.20 13665 23000 - 21500
mitigate the impact of Covid-19. Inflation has been better than what was
expected in December meeting and eased below tolerance level of 6%. The NIFTY BANK 35655 UP 06.11.20 26799 29000 - 27500
RBI projected GDP growth of 10.5% in FY22 for India while projection for CPI- ACC 1723 UP 17.04.20 1173 1640 - 1600
based inflation was revised to 5.2% for Q4FY21. BHARTIAIRTEL 581 UP 13.11.20 476 550 - 530
• India's service sector expansion accelerated slightly in January, survey BPCL 415 UP 15.01.21 415 390 - 380
results from IHS Markit showed. The IHS Markit services Purchasing
Managers' Index rose to 52.8 in January from 52.3 in December. CIPLA 848 UP 09.04.20 580 760 - 740
Consumer Durable SBIN 393 UP 06.11.20 219 340 - 310
• Bharat Electronics and BPL Medical Technologies on 04 February 2021 entered HINDALCO 262 UP 30.04.20 130 240 - 225
into an MoU for co-operation in the field of medical products and solutions to ICICI BANK 614 UP 09.10.20 402 560 - 530
provide affordable health care for the country and also to leverage the policy
INFOSYS 1272 UP 30.04.20 716 1180 - 1150
initiatives of the Indian Government, such as Make in India.
ITC 234 UP 20.11.20 192 205 - 200
Healthcare
• Metropolis Healthcare announced the launch of a new laboratory in Kochi, L&T 1516 UP 13.11.20 1052 1400 - 1350
Kerala. The 5,200 sq. ft. laboratory has the capability to conduct more than MARUTI* 7494 UP 09.10.20 7062 - - 7200
30,000 sample testing per month including pathology tests ranging from NTPC 100 UP 05.02.21 100 92 - 88
basic pathology tests to high-end molecular diagnostic tests.
ONGC 98 UP 27.11.20 79 90 - 87
Pharmaceutical
RELIANCE 1924 DOWN 13.11.20 1996 - 2050 2080
• Natco Pharma announced its registration approval given by Central
Insecticide Board and Registration Committee for indigenous manufacture TATASTEEL 685 UP 16.10.20 394 630 - 600
of Chlorantraniliprole (CTPR) Technical 93.00% w/ w min. under Section 9(3) *MARUTI has broken the support of 7500 Closing as on 04-02-2021
of Insecticides Act, 1968. NATCO would be the first indigenous manufacturer NOTES:
of this technical product. 1) These levels should not be confused with the daily trend sheet, which is sent every morning by e-mail in the name
of "Morning Mantra ".
• Pfizer has withdrawn its application seeking Emergency Use Authorisation 2) Sometimes you will find the stop loss to be too far but if we change the stop loss once, we will find more strength
of its Covid-19 vaccine in India. coming into the stock. At the moment, the stop loss will be far as we are seeing the graphs on weekly basis and
taking a long-term view and not a short-term view.
Construction
• PSP Projects has received an additional work order worth Rs. 236 crores
(induding GST) for an Institutional project at Gujarat. Further, the company
has been ranked the L1 bidder (Lowest Bidder) by a regulatory authority for
projects totalling to Rs. 420.89 crore (including GST) for construction of FORTHCOMING EVENTS
medical colleges at multiple locations at Uttar Pradesh.
Bank Board Meeting Company Name Purpose
• IndusInd Bank announced that it will inaugurate a new branch at Katra, 8-Feb-21 BPCL Quarterly Results, Interim Dividend
Union Territory of Jammu & Kashmir. With this, the Bank aims to expand its 8-Feb-21 Torrent Pharma. Quarterly Results, Interim Dividend
retail operations across the UT of Jammu & Kashmir by setting up 25 more 9-Feb-21 Berger Paints Quarterly Results
branches over the next one year. 9-Feb-21 Mahanagar Gas Quarterly Results, Interim Dividend
Mining & Minerals 9-Feb-21 Torrent Power Quarterly Results, Interim Dividend
• Vedanta announced that the sub-committee of the Board of Directors of the 9-Feb-21 Adani Ports Quarterly Results
company held on 03 February 2021 approved the expansion of Lanjigarh 9-Feb-21 Muthoot Finance Quarterly Results
Alumina Refinery from existing capacity of 2 MTPA to 5 MTPA at a cost of Rs 10-Feb-21 Hindalco Inds. Quarterly Results
3,779 crores approx., subject to requisite Government approvals. 10-Feb-21 Titan Company Quarterly Results
10-Feb-21 GAIL (India) Quarterly Results
Metals 10-Feb-21 Indraprastha Gas Quarterly Results
• Tata Steel BSL has partnered with Fareye, a software logistics company to 11-Feb-21 ACC Accounts, Dividend
implement a digital transformation process to improve the steelmaker’s in- 11-Feb-21 Ashok Leyland Quarterly Results
plant and in-transit visibility and to optimize transportation costs. 11-Feb-21 ITC Quarterly Results
11-Feb-21 Power Grid Corpn Quarterly Results
11-Feb-21 Petronet LNG Quarterly Results
INTERNATIONAL NEWS 12-Feb-21 Bharat Forge Quarterly Results
• US factory orders jumped by 1.1 percent in December after surging up by 1.3 12-Feb-21 Grasim Inds Quarterly Results
percent for three consecutive months. Economists had expected factory 12-Feb-21 Natl. Aluminium Quarterly Results
orders to climb by 0.7 percent. 12-Feb-21 ONGC Quarterly Results
• US labor productivity plunged by 4.8 percent in the fourth quarter after 12-Feb-21 Glenmark Pharma. Quarterly Results
spiking by an upwardly revised 5.1 percent in the third quarter. Ex-Date Particulars Dividend
• US jobless claims fell to 779,000, a decrease of 33,000 from the previous 8-Feb-21 Bharat Electronics Dividend Rs.1.40/-
week's revised level of 812,000. Economists had expected jobless claims to 9-Feb-21 Cummins India Dividend Rs.7.00/-
edge down to 830,000 from the 847,000 originally reported for the previous 9-Feb-21 Sun Pharma. Industries Dividend Rs.5.50/-
week. 9-Feb-21 Dr. Lal PathLabs Dividend Rs.6.00/-
• Manufacturing activity in the U.S. saw continued growth in the month of 9-Feb-21 Indian Oil Corp. Dividend Rs.7.50/-
January, according to a report released by the Institute for Supply 10-Feb-21 Manappuram Finance Dividend Rs.0.65/-
Management on Monday, although the pace of growth slowed more than 11-Feb-21 NTPC Dividend Rs.3.00/-
expected. The ISM said its manufacturing PMI declined to 58.7 in January 15-Feb-21 Torrent Pharma Interim Dividend
from a downwardly revised 60.5 in December. 15-Feb-21 Godrej Consumer Prod. Interim Dividend
• Eurozone retail sales grew in December after a sharp fall in November. Retail 15-Feb-21 Balkrishna Industries Interim Dividend
sales increased 2 percent month-on-month in December, in contrast to a fall of 16-Feb-21 Torrent Power Interim Dividend
5.7 percent in November. Sales were forecast to grow 1.6 percent. 17-Feb-21 Page Industries Interim Dividend
4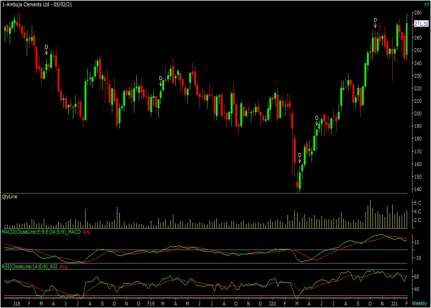
EQUITY
INDIAN INDICES (% Change) SECTORAL INDICES (% Change)
10.00 9.35 16.00
9.25 15.23
9.00 8.70
8.37
8.00 14.00
7.18
7.00 6.45 11.99
12.00
6.00 11.07 11.16
10.86 10.93
5.00
10.00
4.00
8.00
3.00
6.88
2.00
6.00 5.39
1.00 4.86
4.09
0.00 4.00 3.37
Ni y Sensex BSE Midcap BSE Smallcap Ni y Next 50 S&P CNX 500
SMC Trend 2.00
Nifty Sensex BSE Midcap BSE Smallcap Nifty Next S&P CNX 500
0.00
Auto Index Bankex Index Index FMCG Index Index IT Index Metal Index Index Power Index Realty Index
Cap Goods Cons Durable Healthcare Oil & Gas
GLOBAL INDICES (% Change)
SMC Trend
6.00 Auto Cap Goods FMCG IT Oil & Gas
Bank Cons Durable Healthcare Metal Power
5.41
Realty
5.00
4.25
FII/FPI & DII ACTIVITY (In Rs. Crores)
4.00 3.88
3.58
8000.00
6181.56
2.93
3.00 6000.00
2.45
4000.00
2443.20 2520.92
2.00 1936.74
1.51 1494.23
2000.00
1.00 0.00
- 90.46
0.55 - 399.74
- 768.55
0.10 - 2000.00 - 2035.20
0.00
Nasdaq Comp. Dow Jones S&P 500 Nikkei Strait Times Hang Seng Shanghai Comp. FTSE 100 CAC 40
- 4000.00
SMC Trend
- 6000.00 - 5930.66
Nasdaq Nikkei Hang Seng FTSE 100
Dow jones Strait times Shanghai CAC 40 - 8000.00
S&P 500 Friday Monday Tuesday Wednesday Thursday
FII / FPI Activity DII trading activity
Up Down Sideways
BSE SENSEX TOP GAINERS & LOSERS (% Change) NSE NIFTY TOP GAINERS & LOSERS (% Change)
30.00 30.00
25.88 25.90
25.00 24.15 25.00
21.99 21.94
20.00 18.96 20.00
17.00 16.85
16.18 16.10
15.00 15.00
10.00 10.00
5.00 5.00
0.00 0.00
- 0.23 - 0.06
-0.81 - 0.72 - 0.22
- 2.25
- 5.00 - 5.00
St Bk of India Tata Motors Bank Shree Cement ICICI Bank UPL Hind. Asian Paints SBI Life Bank Cem.
ICICI Bank Bajaj Finance UltraTech Hind.
IndusInd Unilever Insuran
St Bk of India IndusInd Unilever Asian Paints
5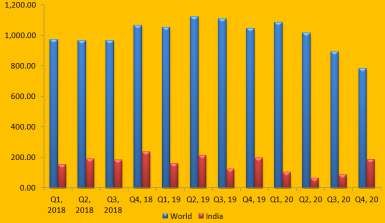
EQUITY
Beat the street - Fundamental Analysis
BHARAT
HEXAWARE
ELECTRONICS
TECHNOLOGIES
LIMITED
LIMITED CMP: 139.05
CMP: 382.90 TargetPrice:
Target Price:165
441 Upside: 19%
15%
VALUE PARAMETERS
VALUE PARAMETERS Investment Rationale Ÿ It has posted 24.98 percent higher profit at
Ÿ Bharat Electronics Limited (BEL) is a state-owned Rs.278.50 crore on a consolidated basis for the
Face Value (Rs.) 1.00 third-quarter of FY 2020-21 as against Rs.222.83
aerospace and defense company with about nine
52 Week High/Low 141.75/56.10 factories, and several regional offices in India. It crore profits recorded in the same period last year.
primarily manufactures advanced electronic products Its total income is also higher by 1.40 per cent to
M.Cap (Rs. in Cr.) 34331.59 for the Indian Armed Forces. The Bangalore and the Rs.2,343.90 crore from Rs.2,311.47 crore in the
Ghaziabad units are BEL's two major units, with the same period last year.
EPS (Rs.) 7.30
Bangalore unit contributing the largest share to the total Risk
P/E Ratio (times) 19.30 revenue and profits. The Government of India held Ÿ High dependence on defence sector
P/B Ratio (times) 3.39 51.14% stake in BEL as on 31 December 2020.
Ÿ Working capital intensity
Ÿ The Company’s order book remains healthy at Rs.
Dividend Yield (%) 1.99 54,791 crore, which provides sustainable revenue Valuation
Stock Exchange BSE visibility; expect pickup in order intake going forward. The company's financial performance remains strong
Ÿ The company continues to enjoy advantage over its on account of healthy profitability and return
% OF SHARE HOLDING competitors due to its dominant market position, indicators, negligible borrowings, comfortable
established track record and association with the liquidity and strong debt coverage metrics. Also, the
armed forces, established infrastructure and company is well positioned to benefit from rising
manufacturing facilities, and strong R&D capabilities defence expenditure supported by strong execution
track record and a strong order book providing
Ÿ The government’s Make in India and Aatmanirbhar healthy revenue visibility ahead. Thus, it is expected
Bharat initiatives along with rising spends for that the stock will see a price target of Rs.165 in 8 to
modernising defence equipment will support earnings 10 months time frame on a current P/E of 19.30x and
growth in the coming years, as BEL is one of the key FY22 EPS of Rs.8.54.
players with strong research and manufacturing
capabilities in the defence space in the country.
P/E Chart
FINANCIAL PERFORMANCE Ÿ Recently, the National Capital Region Transport
` in cr Corporation and the Bharat Electronics Limited
ACTUAL ESTIMATE inked a memorandum of understanding to develop
FY Mar-20 FY Mar-21 FY Mar-22 indigenous platform screen doors, which act as a
safety barrier between the passengers and tracks,
Revenue 12967.67 13494.41 15202.42 under the self-reliant India scheme. Also it has signed
Ebitda 2754.46 2808.67 3224.12 a contract with the Indian Navy to supply 20 laser
Ebit 2382.60 2180.89 2542.74 dazzlers, a non-lethal weapon for warning and
stopping suspicious vehicles, boats and aircraft.
Net Income 1823.85 1854.22 2137.25
Ÿ The company has signed MoU with BPL Medical
EPS 7.49 7.64 8.54 Technologies Pvt Ltd to provide affordable healthcare
BVPS 41.334 46.557 51.515 for the country. The company will leverage policy
RoE 18.92% 16.25% 16.76% initiatives of the Indian Government, such as ‘Make in
India’ to offer affordable healthcare for the country.
OBEROI
HEXAWARE
REALTY
TECHNOLOGIES
LIMITED LIMITED CMP:
CMP:
574.00
382.90 Target
Target Price:
Price: 441
657 Upside: 14%
15%
VALUE PARAMETERS
VALUE PARAMETERS Investment Rationale comfortable as per management. With the
Ÿ Oberoi Realty is a real estate development company sequential improvement in collections to Rs 240
Face Value (Rs.) 10.00
headquartered in Mumbai. It is focused on premium crore (vs Rs 180/80 crore in 2QFY21/1QFY21), and
52 Week High/Low 635.05/290.10 developments in the residential, office space, retail, also generated positive cash flow of Rs 190 crore.
M.Cap (Rs. in Cr.) 20870.77 hospitality, and social infrastructure verticals. Ÿ• On the development front, major assets like
Ÿ According to the management, Q3FY21 saw a Commerz-3, Sky City Mall and Worli Mall are slated
EPS (Rs.) 19.35 for completion by FY24, with FY24 exit rental
convergence of multiple positive factors for
P/E Ratio (times) 29.66 resulting in its 9-month FY21 booking values guidance maintained at Rs 1400 crore.
surpassing the entire FY20 numbers. This assumes Risk
P/B Ratio (times) 2.37 special significance considering that the beginning of • Strict Operational and strategic regulation
Dividend Yield (%) 0.00 FY21 has been severely impacted by the pandemic.
Changing consumer behaviour towards buying living • Currency fluctuation
Stock Exchange BSE spaces for end use requirements of today instead of Valuation
perennially waiting for better deals, statutory The company is doing well and according to the
% OF HOLDING
% OF SHARE SHARE HOLDING benefits provided by the state government, management, the momentum will continue for the
economic stimulus provided by the central company as given the stamp duty cut, low- interest
government, low interest rates etc. have all rate, strong brand recognition and market
contributed towards its performance. consolidation. Residential launches remain on track
Ÿ Moreover, the volumes during the quarter show a to hit the market from Q4 FY21 in Borivali, Goregaon
clear shift of home buyers towards developers with and Thane. Thus, it is expected that the stock will see
financial stability and a proven track record. The a price target of Rs.657 in 8 to 10 months’ time frame
consolidation trend in the real estate sector has now on current P/Bv of 2.37x and FY22 BVPS of Rs.277.26.
truly begun. Even the commercial segment is
expected to see a turnaround in the near term driven P/B Chart
FINANCIAL PERFORMANCE by shortage of Grade A office spaces as developing
` in cr them requires a high level of financial discipline and
ACTUAL ESTIMATE strong brand equity.
FY Mar-20 FY Mar-21 FY Mar-22 Ÿ During the December quarter, it has achieved
Revenue 2237.63 1967.94 2726.08 lifetime high pre-sales despite having no launches
and sold 231 units in the quarter, compared to 42/5
Ebitda 1047.97 941.98 1289.28 units in 2Q/1Q FY21. Oberoi mall is seeing gradual
Ebit 1003.10 876.01 1234.70 recovery with consumption varying from 70-125%
Net Income 689.33 714.08 982.31 from tenant to tenant.
EPS 18.96 19.78 27.03 Ÿ Consolidated gross debt stood at Rs 1720 crore (vs Rs
BVPS 237.33 254.39 277.26 1670 crore on Sep-20 end) and net debt stood at Rs
1500 crore (vs Rs 1360 crore on Sep-20 end) with net
RoE 8.28% 8.20% 9.92%
D/E at 0.17x (vs 0.15x on Q2 FY21 end), which is
Above calls are recommended with a time horizon of 8 to 10 months. Source: Company Website Reuters Capitaline
6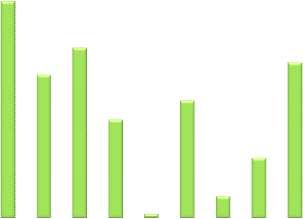
EQUITY

     Ambuja Cements Limited (AMBUJACEM)

                                                                                                                   The stock closed at Rs 271.30 on 05th February, 2021. It
                                                                                                                   made a 52-week low at Rs 136.55 on 26th March 2020 and a
                                                                                                                   52-week high of Rs. 279.60 on 02nd February, 2021. The 200
                                                                                                                   days Exponential Moving Average (DEMA) of the stock on the
                                                                                                                   daily chart is currently at Rs 232.60.

                                                                                                                   Short term, medium term and long term bias are looking
                                                                                                                   positive for the stock as it is trading in higher highs and
                                                                                                                   higher lows on chart, which is bullish in nature. Apart from
                                                                                                                   this, it has formed an “Inverted Head and Shoulder” pattern
                                                                                                                   on daily charts and has given the neckline breakout of
                                                                                                                   pattern along with high volumes, closed above the same so
                                                                                                                   buying momentum may continue for coming days.
                                                                                                                   Therefore, one can buy in the range of 265-268 levels for the
                                                                                                                   upside target of 300-310 levels with SL below 245.

     Bharat Heavy Electricals Limited (BHEL)

                                                                                                                    The stock closed at Rs 43.55 on 05th February, 2021. It made
                                                                                                                    a 52-week low of Rs 18.40 on 13th March, 2020 and a 52-week
                                                                                                                    high of Rs. 44.40 on 06th July, 2020. The 200 days
                                                                                                                    Exponential Moving Average (DEMA) of the stock on the daily
                                                                                                                    chart is currently at Rs 35.58.

                                                                                                                    After registering yearly low of 19 levels, stock recovered
                                                                                                                    sharply and traded in range with positive bias, formed a
                                                                                                                    “Symmetrical Triangle” pattern on weekly charts which is
                                                                                                                    considered to be bullish. Last week, stock has given the
                                                                                                                    pattern breakout, ended around 21% gains along with high
                                                                                                                    volumes and also has managed to close above the breakout
                                                                                                                    so further upside is expected from current levels. Therefore,
                                                                                                                    one can buy in the range of 42-43 levels for the upside target
                                                                                                                    of 52-55 levels with SL below 37.

Disclaimer : The analyst and its affiliates companies make no representation or warranty in relation to the accuracy, completeness or reliability of the information contained in its
research. The analysis contained in the analyst research is based on numerous assumptions. Different assumptions could result in materially different results.
The analyst not any of its affiliated companies not any of their, members, directors, employees or agents accepts any liability for any loss or damage arising out of the use of all or any
part of the analysis research.
SOURCE: RELIABLE SOFTWARE

Charts by Reliable software

                                                  Above calls are recommended with a time horizon of 1-2 months

                                                                                                                                                                                         7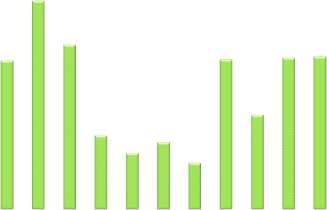
DERIVATIVES
WEEKLY VIEW OF THE MARKET
Indian markets surged sharply high in the week gone by as both the indices mark their lifetime highs. Nifty moved above 15000 levels and corrected while bank
nifty also tested 36600 levels posting their best weekly advance since April last year. From derivative front, short covering was done by call writers at 14500 &
14700 strike while put writers were seen shifting to higher bands. The Implied Volatility (IV) of calls closed at 20.08% while that for put options closed at 21.47.
The Nifty VIX for the week closed at 23.12%. PCR OI for the week closed at 1.62 indicates more puts writing than calls. From technical front, secondary oscillators
suggests that markets are likely to remain volatile in upcoming sessions with more likely stock specific action. However derivative data also suggests that a tug of
war between bulls and bears is likely to keep Nifty indices in broader range of 14700 to 15000 levels. However, next upside in index would continue once Nifty
surpassed above 15000 levels decisively.
DERIVATIVE STRATEGIES
BULLISH STRATEGY BEARISH STRATEGY
TATASTEEL SUNPHARMA IGL
BUY FEB 700 CALL 31.25 BUY FEB 650 CALL 16.60 BUY FEB 530 PUT 17.20
OPTION SELL FEB 720 CALL 23.60 SELL FEB 670 CALL 10.90 SELL FEB 520 PUT 13.65
STRATEGY
Lot size: 1700 Lot size: 1400 Lot size: 1375
BEP: 707.65 BEP: 655.70 BEP: 526.45
Max. Profit: 20995.00 (12.35*1700) Max. Profit: 20020.00 (14.30*1400) Max. Profit: 8868.75 (6.45*1375)
Max. Loss: 13005.00 (7.65*1700) Max. Loss: 7980.00 (5.70*1400) Max. Loss: 4881.25 (3.55*1375)
VOLTAS (FEB FUTURE) ASIANPAINT (FEB FUTURE) GODREJCP (FEB FUTURE)
Buy: Above `1013 Sell: Below `2370 Sell: Below `743
FUTURE
Target: `1038 Target: `2287 Target: `717
Stop loss: `999 Stop loss: `2416 Stop loss: `758
NIFTY OPTION OI CONCENTRATION (IN QTY) (MONTHLY) CHANGE IN NIFTY OPTION OI (IN QTY) (MONTHLY)
In lakhs In lakhs
20.00
36.75
40.00
14.57
12.62
35.00
15.00
9.44
30.00
10.00
23.41
6.79
6.72
6.27
5.59
25.00
20.93
4.58
19.76
2.52
5.00
1.93
20.00
15.53
1.07
0.72
0.71
0.65
14.34
14.21
13.78
12.66
15.00
0.00
9.31
-0.02
-0.07
-0.31
8.80
-0.42
-0.63
8.33
8.29
-1.59
10.00
5.77
5.69
5.54
5.49
5.32
-5.00
-3.88
3.93
3.50
3.35
-4.54
2.92
5.00
0.00 -10.00
11500 12000 13000 13500 14000 14200 14500 14800 15000 15500 16000 11500 12000 13000 13500 14000 14200 14500 14800 15000 15500 16000
Call Put Call Put
BANKNIFTY OPTION OI CONCENTRATION (IN QTY) (MONTHLY) CHANGE IN BANKNIFTY OPTION OI (IN QTY) (MONTHLY)
In 10,000 In 10,000
35.00 35.00
28.98
30.60
30.01
25.29
30.00
22.19
26.81
30.00
19.50
25.00
15.91
15.79
25.00 20.00
12.92
20.77
10.81
10.67
19.52
19.16
15.00
18.62
9.68
8.80
16.93
20.00
16.47
5.86
15.93
10.00
15.38
15.07
3.78
3.14
13.72
13.26
13.01
1.10
5.00
11.94
15.00
11.50
0.00
9.97
8.93
-0.84
7.69
10.00
6.97
-5.00
-3.49
-5.49
-5.65
-7.06
-10.00
-9.19
5.00
-11.37
1.04
-15.00
0.00
29500 30000 31000 32000 32500 33000 33500 34000 34500 35000 35500 29500 30000 31000 32000 32500 33000 33500 34000 34500 35000 35500
Call Put Call Put
8DERIVATIVES
SENTIMENT INDICATOR (NIFTY) SENTIMENT INDICATOR (BANKNIFTY)
04-Feb 03-Feb 02-Feb 01-Feb 29-Jan 04-Feb 03-Feb 02-Feb 01-Feb 29-Jan
DISCOUNT/PREMIUM -0.30 30.60 48.15 70.05 74.50 DISCOUNT/PREMIUM 7.25 83.30 124.80 187.25 113.65
COST OF CARRY% 0.67 0.69 0.70 0.70 0.68 COST OF CARRY% 0.61 0.70 0.70 0.85 0.71
PCR(OI) 1.62 1.59 1.55 1.42 1.24 PCR(OI) 1.32 1.32 1.21 1.10 0.91
PCR(VOL) 1.26 1.04 1.06 1.20 0.98 PCR(VOL) 1.50 1.49 1.34 1.37 0.99
A/D RATIO(NIFTY 50) 2.06 3.08 15.33 8.80 0.17 A/D RATIO(BANKNIFTY) 10.00 10.00 All up 10.00 1.75
#
A/D RATIO(ALL FO STOCK)* 3.33 2.42 6.65 10.82 0.21 A/D RATIO(ALL FO STOCK) 11.00 11.00 All up 11.00 2.00
IMPLIED VOLATILITY 20.08 21.32 21.37 21.82 24.67 IMPLIED VOLATILITY 26.55 27.42 28.33 26.76 32.19
VIX 23.12 23.75 23.35 23.32 25.34 VIX 23.12 23.75 23.35 23.32 25.34
HISTORICAL VOLATILITY 29.32 29.38 29.44 29.33 28.75 HISTORICAL VOLATILITY 42.20 42.26 42.33 42.20 40.85
*All Future Stock #All Future Stock
FII’S ACTIVITY IN INDEX FUTURE FII’s ACTIVITY IN DERIVATIVE SEGMENT
In Cr. In Cr.
2500 8000
2135
5634
1861
2000
5091
6000
4181
1500
4000
2087
1000
1517
2000
986
500
581
0 0
-5
-69
-500
-2000
-2348
-1000
-975
-3227
-4000
-3589
-1313
-1328
-1500
-1389
-1471
-1555
-2000
-6000
21-Jan 22-Jan 25-Jan 27-Jan 28-Jan 29-Jan 01-Feb 02-Feb 03-Feb 04-Feb 21-Jan 22-Jan 25-Jan 27-Jan 28-Jan 29-Jan 01-Feb 02-Feb 03-Feb 04-Feb
Top 10 Long Buildup Top Short Buildup
NAME LTP % Price Change Open interest %OI Chng NAME LTP % Price Change Open interest %OI Chng
INDUSINDBK 1036.70 21.89% 25897500 52.47% ICICIPRULI 479.30 -0.86% 7897500 62.85%
L&TFH 93.65 9.66% 31234000 51.12% HINDUNILVR 2250.60 -1.16% 7596000 24.78%
PNB 40.65 21.16% 247376000 50.46% ASIANPAINT 2415.45 -0.14% 6290700 24.08%
GODREJPROP 1343.60 6.68% 1896050 44.55% UPL 551.25 -2.20% 16077100 6.75%
BHEL 42.45 17.92% 142338000 43.69% MARICO 416.35 -0.25% 9296000 6.48%
GAIL 131.55 4.45% 32940000 42.07% SBILIFE 868.80 -0.06% 5657250 3.47%
BATAINDIA 1598.40 6.11% 1265000 39.90%
INDUSTOWER 255.45 9.94% 13510000 37.70%
PAGEIND 29705.50 8.81% 84540 36.86%
AARTIIND 1197.10 2.78% 594575 34.91%
Note: All equity derivative data as on 4th February, 2021
**The highest call open interest acts as resistance and highest put open interest acts as support.
# Price rise with rise in open interest suggests long buildup | Price fall with rise in open interest suggests short buildup
# Price fall with fall in open interest suggests long unwinding | Price rise with fall in open interest suggests short covering
9SPICES BULLIONS
Trend of turmeric futures (Apr) is bullish and any dip near 6500 levels can be Bullion counter had reality check in last few trades and saw a significant
utilized as a buying opportunity, eyeing a target of 6900-7100 levels. Demand correction after a rise of three weeks. Rise in dollar index and treasury yield,
usually picks up after January 15 and this increase in prices to multi-week high import duty cut in India amid record highs in equity-exerted pressure in this
can be related to it. Prices are gaining as there are fears that there could be as counter. The government cut import duties on gold and silver to 7.5% from
much as 25 percent crop loss in states such as Telangana and Andhra Pradesh. 12.5%, but imposed a 2.5% cess on the imports. The government also reduced
Even in Maharashtra’s Sangli district, the crop has been affected. Jeera import duty on gold dore and silver dore, non-refined mined gold or silver.
futures (Mar) will probably remain trapped in the range of 12800-13200 levels. Tuesday’s slide in silver came after higher margin limits imposed by exchange
The weather conditions remain supportive and traders are keeping out of regulator CME that simply meant higher upfront cash needed by anyone
buying large quantities in wholesale markets ahead of new arrivals from next trading the metal. Premiums on silver coins have risen to more than $7 on
month. The final figures of progressive area under cumin of Rabi 2020-21 in
Thursday from about $5. Normally when prices of the physical metal fall,
Gujarat as on 25th Jan is reported at 4,69,030 hectares as compared to
premiums come down as well. That hasn’t happened this time. It is showing
4,88,207 hectares during 2019-20 and 4,06,141 hectares in last year’s
demand from lower levels. The dollar headed for its best weekly gain in three
average. In Unjha mandi, rough variety of Jeera was quoted at Rs. 2,045-2,115
per 20 kg. NCDEX Jeera was priced at Rs. 2,165-2,265 per 20 kg. Bombay Bold months, lifted by growing confidence that the U.S. economic recovery will
was quoted at Rs. 2,440-2,530 per 20 kg. Dhaniya futures (Apr) is expected to outpace global peers. U.S. Treasury yields, the 10-year note hit one-year highs
trade with an upside bias in the range of 6150-6500 levels. There is demand for of 1.158%. A combination of stronger dollar and yields typically suppress gold.
the new crop and despite the pressure of new arrivals with picking pace of Democrat lawmakers in the Senate are preparing for a massive "vote-a-rama"
harvest in Madhya Pradesh, Gujarat and Uttar Pradesh along with Rajasthan session to pass President Joe Biden’s proposed $1.9 trillion stimulus package.
mandis, the new crop is traded higher in the range of Rs 4,000-6,000 per Recent downside in bullion may spur buying in physical demand. Sales of U.S.
quintal. The new crop is attracting enquiries from local buyers along with Gulf gold bullion coins rose 258% in 2020 while silver coin demand was up 28%, the
nations. In fact some deals were cracked at the rate of Rs 5,700 per Quintal, U.S. Gold and silver should trade in a range of 45800-49200 levels and 65000-
while the purchase will take place when the moisture content drops to 8%. 70000 levels respectively.
OIL AND OILSEEDS ENERGY COMPLEX
Soybean futures (Feb) may trade sideways to up in the range of 4550-4750 Crude price may trade in the range of 3800-4250 levels with positive bias on
levels. Investors now await the USDA's the highly anticipated monthly World signs of economic growth in the United States and a continued commitment by
Agricultural Supply and Demand Estimates (WASDE) report due this week. In producers to hold back crude supply. Rising confidence in an upturn in
the international market, rainfall has slowed the start of Brazil's soybean economic and oil demand recovery around the corner is a major impetus for
harvest; creating uncertainty about how soon Brazilian exports will be crude. The Organization of the Petroleum Exporting Countries and allies led
available. However, recent rainfall in South America is also expected to have by Russia reaffirmed its support for deep supply cuts which have helped to
averted some yield losses after an earlier drought, particularly in Argentina. bring down swollen global crude stockpiles. OPEC expects output cuts to keep
The market participants are more optimistic that demand will rise, especially the market in deficit throughout 2021, even though the group reduced its
after last week the U.S weekly export soybean net sales of 824,000 MT for demand forecast. Markets are encouraged by stronger-than-expected orders
2020/2021 rose 77% from the previous week and 4% from the prior 4-week for U.S. goods in December, pointing to strength in manufacturing, and hopes
average. Soy oil futures (Feb) is expected to consolidate in the range of 1060- for swift approval by lawmakers of President Joe Biden’s proposed $1.9 trillion
1130 levels. A rise in the effective import duty on crude palm oil has led most coronavirus aid plan. U.S. oil refiners are predicting a strong recovery in fuel
market participants to expect a shift in demand to soft oils such as soyoil and demand in the second half of this year as vaccination rates increased and
sunflower oil. Major demand for soft oil will come from the household sector workers were expected to resume commuting and taking vacations. U.S.
because price difference between palm oil and soyoil. The price of imported plants are running at about 82% of capacity, according to U.S. government
crude palm oil is 983 rupees per 10 kg in physical markets while soyoil prices data, down about 10 percentage points from normal capacity at this time of
are around 1,120 rupees per 10 kg. CPO futures (Feb) will probably hover in year. Chinese demand for crude oil is also helping support the market, as
the range of 955-1000 levels. The market participants would be cautious shown by industry tracking that reports two tankers of North Sea crude oil
ahead of the demand-supply data from the Malaysia Palm Oil Board on Feb. 10. heading to China for March 22 and March 24. Natural gas prices may trade with
RM Seed futures (Feb) is looking bullish and can test 6000-6300 levels in days higher volatility and in the range of 190- 230. Natural gas prices rebounded
to come. In Mustard, there is only 1 lakh ton of carry forward stock left in the following a larger than expected draw in natural gas inventories. The weather
market. Looking at the steady demand from millers and good crop, upside is expected to be much colder than normal through all of the United States for
momentum can be seen in Mustard in days to come. the next two weeks.
OTHER COMMODITIES BASE METALS
Cotton futures (Feb) is expected to trade with a positive bias taking support Base metals may trade in the range as Chinese markets will remain closed
near 21000 levels and moving higher towards 21600 levels. Farmers are from Feb. 11-17 for Lunar New Year holidays, potentially slowing demand for
holding onto remainder stocks in anticipation of higher price levels. Secondly, industrial metals while declining stock at exchange’s warehouses and low
the procurement is going on at MSP in Punjab, Haryana and Rajasthan, along level of inventories and hopes of further U.S. stimulus that could boost
with M.P, Telangana, Andhra Pradesh, Karnataka, Gujarat and Maharashtra. It demand of base metal. Copper may trade in the range of 590-610 levels.
has been procuring cotton at MSP from the mandis in Odisha as well, adding Soaring sales of consumer goods such as washing machines, fridges, freezers
cushion to the prices. In the international market, the ICE Cotton futures has and cars in the world outside China are expected to invigorate copper
take support near 79.85 cents and is on the way towards 83-85 cents. Investors consumption and create shortages later this year. The People’s Bank of China
will be cautious and await the USDA's the highly anticipated monthly World will keep liquidity reasonably ample, easing money supply worries in the
Agricultural Supply and Demand Estimates (WASDE) report is due this week. world’s top metals consumer. Freeport-McMoRan Inc is close to reaching a
Guar seed (Feb) may consolidate in the range of 3800-4050 levels, while guar $2.8-billion deal with China’s Tsingshan Holding Group to build a copper
gum (Feb) is expected to hold on the support near 6100 levels and see higher smelter in Indonesia. Zinc may trade in the range of 203-214 levels while Lead
levels of 6350-6550 levels. Higher crude oil prices have raised hope for better can move in the range of 158-168. Nickel may trade in the range of 1260-1320
demand. If upside trend in crude oil continues in future, gum powder demand levels. Demand for nickel, mainly used in making stainless steel, is expected
will pick up. U.S. crude oil has reached its highest settlement level in a year to grow rapidly as a raw material in electric vehicle batteries. It is unclear
after stockpiles fell to their lowest levels since March. The market has been whether New Caledonian supply will be impacted by the coalition collapse.
bolstered by deep supply cuts from the Organization of the Petroleum While other countries may ramp up shipments to fill any supply gap from New
Exporting Countries and allies, which on Wednesday maintained ongoing Caledonia, a tight market in China and recovering demand elsewhere will
supply cuts. Rubber futures (Feb) is expected to trade sideways in the range of likely keep nickel prices well supported. Aluminum may move in the range of
15200-15500 levels amidst scattered demand following a sharp increase in the 158-168 levels. Novelis projects global aluminum demand to remain on a
number of Covid 19 cases in the state of Kerala. In the international market, growth trajectory that will not be negatively impacted long-term by the
rubber is showing a firm trend amid hopes of an economic growth in China as coronavirus pandemic. Novelis shipped 933,000 mt of flat-rolled aluminum
new COVID-19 cases in the top rubber buyer fell while a weaker yen against products in its fiscal third quarter ending Dec. 31, 2020, climbing 17% year
the dollar also lent support. over year.
10TREND SHEET
EXCHANGE COMMODITY CONTRACT CLOSING DATE TREND TREND RATE TREND SUPPORT RESISTANCE CLOSING
PRICE CHANGED CHANGED STOP/LOSS
NCDEX SOYABEAN FEB 4632.00 13.01.21 SIDEWAYS 4630.00 4400.00 4850.00 -
NCDEX JEERA MAR 13075.00 15.10.19 DOWN 16460.00 - 13650.00 13700.00
NCDEX REF.SOY OIL FEB 1101.10 13.01.21 DOWN 1170.00 - 1137.00 1140.00
NCDEX RMSEED FEB 5876.00 04.02.21 SIDEWAYS 5870.00 5440.00 6130.00 -
NCDEX CHANA MAR 4656.00 21.01.21 UP 4480.00 4520.00 - 4500.00
NCDEX GUARSEED FEB 3921.00 07.01.21 UP 3450.00 3770.00 - 3750.00
NCDEX COCUD FEB 2167.00 02.02.21 UP 2100.00 2000.00 - 1970.00
NCDEX GUR FEB 1082.00 13.01.21 UP 1060.00 1050.00 - 1045.00
MCX CPO FEB 976.00 28.01.21 SIDEWAYS 970.00 950.00 1020.00 -
MCX RUBBER FEB 15367.00 20.01.21 DOWN 1540.00 - 15580.00 15600.00
MCX MENTHA OIL FEB 964.60 02.02.21 DOWN 976.00 - 985.00 990.00
MCX MCXBULLDEX FEB 14761.00 17.11.20 DOWN 15700.00 - 15500.00 15550.00
MCX SILVER MAR 66818.00 28.01.21 SIDEWAYS 70500.00 65000.00 71000.00 -
MCX GOLD APR 46715.00 18.11.20 DOWN 50100.00 - 48620.00 48650.00
MCX MCXMETLDEX FEB 13416.00 04.02.21 UP 13450.00 13250.00 - 13200.00
MCX COPPER FEB 596.55 04.02.21 UP 600.00 583.00 - 580.00
MCX LEAD FEB 164.60 02.02.21 UP 163.00 159.00 - 158.00
MCX ZINC FEB 209.45 03.02.21 SIDEWAYS 209.00 202.00 220.00 -
MCX NICKEL FEB 1282.20 05.02.21 SIDEWAYS 1295.00 1270.00 1325.00 -
MCX ALUMINIUM FEB 162.15 04.02.21 UP 162.00 - 159.00 158.00
MCX CRUDE OIL FEB 4110.00 24.11.20 UP 3220.00 3870.00 - 3850.00
MCX NATURAL GAS FEB 208.20 02.02.21 UP 210.00 - 193.00 190.00
Closing as on 04.02.2021
TECHNICAL RECOMMENDATIONS
COPPER (FEB) contract closed at Rs. 596.55 on 04th Feb’2021. The contract made its
high of Rs.629.75 on 08th Jan’2021 and a low of Rs.585.00 on 01st Feb’2020. The 18-day
Exponential Moving Average of the commodity is currently at Rs.601.95 On the daily
chart, the commodity has Relative Strength Index (14-day) value of 51.78.
One can buy around Rs. 595 for a target of Rs.618 with the stop loss of Rs.585.
NATURAL GAS MCX (FEB) contract closed at Rs. 208.20 on 04th Feb’2021. The contract
made its high of Rs. 223.20 on 05th Feb’2020 and a low of Rs. 169.00 on 28th Dec’2020.
The 18-day Exponential Moving Average of the commodity is currently at Rs.197.67 on
the daily chart, the commodity has Relative Strength Index (14-day) value of 63.77.
One can buy around Rs.210 for a target of Rs. 240 with the stop loss of Rs. 199.
CASTORSEED NCDEX (FEB) contract was closed at Rs. 4388 on 04th Feb’2021. The
contract made its high of Rs. 4536.00 on 16th Dec 2021 and a low of Rs. 4330.00 on 22nd
Dec’2020. The 18-day Exponential Moving Average of the commodity is currently at Rs.
4382.24 on the daily chart, the commodity has Relative Strength Index (14-day) value of
54.85.
One can buy at Rs. 4350 for a target of Rs.4600 with the stop loss of Rs 4250.
11NEWS DIGEST WEEKLY COMMENTARY
Ÿ OPEC and allies, extended its oil supply pact at existing Commodities are trading on front foot in 2021 with rebound in energy, agri and some metals on
levels. swift vaccination across the world amid some improving economic data, however dollar capped
the upside. The dollar headed for its best weekly gain in three months, lifted by growing
Ÿ The Democratic-controlled U.S. Congress pushed ahead confidence that the U.S. economic recovery will outpace global peers. The pace of vaccinations
with a maneuver to pass President Joe Biden's $1.9 in the United States has also picked up, causing many investors to temper their pessimism. With
trillion COVID-19 relief package without Republican upside in dollar index and sell in ETFs resulted in sharp selling in bullion counter. Silver futures
support. dropped Tuesday, losing more than 10% to give up their gains from Monday and then some. Silver
is "getting a bit of a reality check" and the retail crowd is losing interest, sending gold tumbling.
Ÿ On the Budget day, the Govt. announced to cut base Tuesday’s slide in silver came after higher margin limits imposed by exchange regulator CME
customs duty gold and silver prices, and imposed a 2.5 that simply meant higher upfront cash needed by anyone trading the metal. Fall deepened in
per cent agriculture infrastructure and development later part of the trading week. Adding to the pressure from the greenback was a rally in U.S.
cess. The customs duty on gold and silver has been Treasury yields, as returns from the 10-year note hit one-year highs of 1.158%. A combination of
stronger dollar and yields typically suppress gold. Sentiment strengthened on signs of some
reduced to 7.5 per cent.
legislative hurdles for the Biden administration $1.9 trillion Covid-19 relief plan. It gave some
Ÿ In the Union Budget, the government said that SEBI will strength to base metals and energy counter. Oil was up to its highest levels in year, ending the
be the designated regulator for gold exchanges which week on a strong note over producers’ commitment to continued supply cuts and positive signs
will infuse transparency in gold transactions. of U.S. economic recovery. U.S. natural gas futures jumped 5% to an 11-week high on Tuesday as
a major winter snowstorm continued to batter the Northeast and on forecasts for even colder
Ÿ In the Union Budget, the Finance Minister set the weather and more heating demand in mid-February. Natural Gas Fund (UNG). Volume on UNG hit
agricultural credit target for this year to 16.5 lakh crore. 10.7 million lots on Monday, its highest daily volume since December, that compares with a daily
average of around 5.1 million lots traded over the past year.
Ÿ MCX has witnessed the delivery of 70 tonnes of rubber in
Agri saw good buying on the news of rains in many states including; spice and oil seeds pack.
the expiry of the first-ever futures contract settled on Turmeric, coriander and jeera saw good gain. The recent rains in Telangana, Maharashtra,
2nd February, 2020. Karnataka in turmeric growing regions are said to hurt the overall productivity of Turmeric due
Ÿ Chinese New Year 2021 will be observed on Friday, to standing water and higher moisture. Buying returned in mustard also. The arrivals of old
coriander surged too as prices gained due to buyer enquiries Demand from Karnataka and Tamil
February 12th, 2021. Mostly, the Chinese New Year
Nadu spice millers has additionally helped keep prices firm. Cotton prices propped up too on
festival period lasts for 16 days, starting from Chinese taking positive cues from the international market. ICE cotton futures inched higher as hopes
New Year's eve to the Lantern Festival. for a massive stimulus measure from the United States offered support to the natural fiber.
NCDEX TOP GAINERS & LOSERS (% Change) MCX TOP GAINERS & LOSERS (% Change)
6% 10%
8.72%
4.85%
5%
8% 7.59%
4.23%
4%
3.47%
6%
3%
2.18%
4%
2% 1.68%
2.33%
2% 1.72%
1% 1.38%
0% 0%
-0.06%
-0.35%
- 0.40%
- 1%
-0.91% -2% -1.49%
-1.17%
-1.38%
- 2%
-4%
- 3% - 2.68%
-4.14%
-5.03%
-6%
- 4% PADDY NATURAL CRUDE OIL LEAD ZINC COTTON GOLD PETAL SILVER MENTHA OIL NICKEL ALUMINIUM
RM SEED COCUD CHANA CPO KAPAS JEERA MAIZE BAJRA BASMATI SOY OIL GAS
WEEKLY STOCK POSITIONS IN WAREHOUSE (NCDEX) WEEKLY STOCK POSITIONS IN WAREHOUSE (MCX)
COMMODITY UNIT 28.01.21 04.02.21 DIFFERENCE COMMODITY UNIT 27.01.21 03.02.21 DIFFERENCE
QTY. QTY. QTY. QTY.
CASTOR SEED MT 6824 6445 -379 ALUMINIUM MT 1061 899 -162.49
COPPER MT 1622 1420 -202.44
CHANA MT 3314 3283 -31
COTTON BLS 130700 148900 18200.00
COCUD MT 65834 72534 6700
GOLD KGS 524 475 -49.00
CORIANDER MT 1048 688 -360 GOLD MINI KGS 126 106 -20.80
GUARGUM MT 14614 15331 717 GOLD GUINEA KGS 6 6 0.00
GUARSEED MT 27799 27998 199 LEAD MT 713 207 -505.56
MENTHA OIL KGS 86409 73447 -12961.60
JEERA MT 74 39 -35
NICKEL MT 1118 1084 -34.24
RM SEED MT 1743 1390 -353 SILVER (30 KG Bar) KGS 210362 232779 22417.53
SOYBEAN MT 43829 41331 -2498 ZINC MT 732 582 -149.96
12COMMODITY
Spot Prices (% Change) Pandemic eroded the safe haven of gold in 2020
The impact of the Covid-19 pandemic was felt across the gold market throughout
MUSTARD (JAIPUR) 4.43
2020, and fourth quarter was no different. Consumers around the world remained
at the mercy of lockdowns, economic weakness and high gold prices, resulting the
gold demand on 11 year low.
CRUDE PALM OIL (KANDLA) 4.39 Global gold demand hit an 11-year low in 2020 at 3,759.6 tonnes, mainly due to a
weak October-December quarter and the Covid-19 related disruptions across the
world driving a muted consumer sentiment throughout the year, the World Gold
TURMERIC (NIZAMABAD) 3.92 Council (WGC) said in a report. The overall demand during 2009 was at 4,386.4
tonnes, while in 2009 the overall demand was at 3,385.8 tonnes, according the
WGC's 2020 Gold Demand Trends report.
COTTON SEED OIL CAKE (AKOLA) 3.08 Global gold demand dropped by 28 per cent year-on-year (YoY) to 783.4 tonnes in
the fourth quarter compared to 1,082.9 tonnes during the October-December
period of 2019, the report stated. The report further revealed that the global gold
CHANA (DELHI) 2.25 jewellery demand fell by 34 per cent to 1,411.6 tonnes in 2020, from 2,122.7
tonnes in 2019. Gold jewellery demand in the fourth quarter of 2020 dipped by 13
per cent to 515.9 tonnes compared to 590.1 tonnes, resulting in a full-year total of
SOYABEAN (INDORE) 1.16 1,411.6 tonnes, which was 34 per cent lower than in 2019 at 2,122.7 tonnes. While
jewellery demand improved steadily from the severely depleted second quarter,
the coronavirus pandemic continued to impact consumer behaviour.
GUAR GUM (JODHPUR) 0.65
However, increased uncertainty and policy response to the pandemic supported
annual investment demand in 2020, which increased 40 per cent to a new high of
1,773.2 tonnes compared to 1,269.2 tonnes in 2019. Most of the growth came in
GUAR SEED (JODHPUR) 0.52
the form of gold-backed exchange traded funds (gold ETFs) and was aided by bar
and coin demand growth in the second half of 2020. Demand for ETFs grew by 120
per cent in 2020 at 877.1 tonnes compared to 398.3 tonnes in 2019. Meanwhile,
COTTON (KADI) 0.34 gold buying by central banks slowed by 59% in 2020, at 273 tonnes compared to
668.5 tonnes in 2019.
GUR (MUZAFFARNGR) 0.00 On the supply front, the report revealed that the total annual gold availability
also took a hit in 2020 and was 4 per cent lower at 4,633.1 tonnes compared to
4,819.9 tonnes, the largest annual fall since 2013.
CORIANDER (KOTA) 0.00 Gold demand in India
India's gold demand fell by 35.34% to 446.4 tonne in 2020. In 2019, the total gold
demand was 690.4 tonne, according to the WGC's 2020 Gold Demand Trends
BARLEY (JAIPUR) -0.05
report. Gold demand in value terms in 2020, witnessed a decline of 14% and stood at
₹1,88,280 crore, compared to ₹2,17,770 crore in 2019, according to the WGC data.
WHEAT (DELHI) -0.17 India's gold demand dropped by over a third in 2020 settling at 446.4 tonne on the
back of pandemic-induced lockdowns and lifetime high prices, but a rebound this
year is most likely, as normalcy returns and steady course of reforms strengthen
PEPPER MALABAR GAR (KOCHI) -0.31 the industry, according to the World Gold Council (WGC).
Meanwhile, the total jewellery demand in volume terms in 2020 was down by 42%
at 315.9 tonne, compared to 544.6 tonne in 2019, while in terms of value it dipped
JEERA (UNJHA) -2.12 by 22.42% to ₹1,33,260 crore, from ₹1,71,790 crore largely on account of Covid-
related restrictions.
-3.00 -2.00 -1.00 0.00 1.00 2.00 3.00 4.00 5.00 The country's net gold imports dipped by 47% during 2020 to 344.2 tonne
compared to 646.8 tonne in 2019.
WEEKLY STOCK POSITIONS IN LME (IN TONNES) Gold demand global & India (In ton)
COMMODITY STOCK POSITION STOCK POSITION DIFFERENCE
28.01.21 04.02.21
ALUMINIUM 1428225 1425225 -3000
COPPER 77175 75000 -2175
NICKEL 248886 249078 192
LEAD 107175 94025 -13150
ZINC 294500 290900 -3600
PRICES OF COMMODITIES IN LME/ COMEX/ NYMEX (in US $)
COMMODITY EXCHANGE CONTRACT 29.01.21 04.02.21 CHANGE%
ALUMINIUM LME CASH 1987.00 1979.50 -0.38
COPPER LME CASH 7877.00 7833.50 -0.55
LEAD LME CASH 2013.00 2010.00 -0.15 Source : WGC
INTERNATIONAL COMMODITY PRICES
NICKEL LME CASH 17727.00 17535.00 -1.08
Commodity Exchange Contract Unit 29.01.21 04.02.21 Difference (%)
ZINC LME CASH 2565.00 2600.00 1.36
Soybean CBOT MAR Dollars Per Bushel 13.70 13.72 0.15
GOLD COMEX APR 1850.30 1791.20 -3.19
SILVER COMEX MAR 26.91 26.23 -2.53 Soy oil CBOT MAR Cents per Pound 44.62 44.94 0.72
LIGHT CRUDE OIL NYMEX MAR 52.20 56.23 7.72 CPO BMD APR MYR per MT 3490.00 3317.00 -4.96
NATURAL GAS NYMEX MAR 2.56 2.94 14.47 Cotton ICE MAR Cents per Pound 80.64 84.28 4.51
13CURRENCY
Currency Table News Flows of last week
Currency Pair Open High Low Close 05th FEB RBI MPC left Repo rate unchanged At 4%
USD/INR 73.1600 73.3650 73.0225 73.1500 04th FEB New US jobless claims fell to lowest since November
EUR/INR 88.7500 88.9400 87.6300 87.7750 04th FEB BoE expects vaccine-fuelled economic recovery in second half of
2021
GBP/INR 100.2000 100.6825 99.2600 99.3775
04th FEB IMF calls on Arab leaders to take action or risk new ‘lost decade’
JPY/INR 69.8900 70.0900 69.4725 69.5200
(* NSE Currency future, Source: Reliable, Open: Monday 9.00 AM IST, Close: Thursday (5.00 PM IST)
03rd FEB Eurozone inflation jumped by most in over a decade
03rd FEB Biden to order review of critical US supply chains
Market Stance 03rd FEB Eurozone economy dropped into double-dip contraction
Indian Rupee largely remained flat this week despite strong dollar move against
01st FEB UK manufacturing ‘close to stalling’ as Brexit and Covid hit supplies
major currencies. Bulk flows and RBI’s accommodative policy prompted rupee to
01st FEB EU faces global criticism over curbs on vaccine exports
edge higher. However it is expected that rupee has room to fall marginally over the
Economic gauge for the next week
coming day’s in-line with higher dollar move. Earlier the Dollar Index marched
Date Currency Event Previous
highest on a weekly basis in last 3 weeks. On the major front, the euro continues to
10-Feb USD Core CPI m/m 0.10%
lose ground versus the dollar, dropping to the lowest level in two months driven
10-Feb USD CPI m/m 0.40%
mainly by economic concerns over a slow vaccine deployment. Admittedly the
10-Feb GBP BOE Gov Bailey Speaks
economic data from euro zone are not supportive for a steep euro rally. While the
11-Feb USD Fed Chair Powell Speaks
pound earned some ground and bonds fell as BoE expected inflation to rise. Rates
11-Feb USD Unemployment Claims 779K
were left unchanged at 0.1% and the bond buying program unchanged. The BoE told
11-Feb EUR EU Economic Forecasts
banks to start preparing for negative interest rates, but said such policy was not 11-Feb USD Crude Oil Inventories -1.0M
imminent. We will remain modest bullish in GBPINR in coming days. 12-Feb GBP Prelim GDP q/q 16.00%
Technical Recommendation USD/INR EUR/INR
USD/INR (FEB) contract closed at 73.1500 on 04-Feb-21. The contract made its EUR/INR (FEB) contract closed at 87.7750 on 04-Feb-21. The contract made its
high of 73.3650 on 01-Feb-21 and a low of 73.0225 on 04-Feb-21 (Weekly Basis). high of 88.9400 on 01-Feb-21 and a low of 87.6300 on 04-Feb-21 (Weekly Basis).
The 21-day Exponential Moving Average of the USD/INR is currently at 73.3528. The 21-day Exponential Moving Average of the EUR/INR is currently at 88.7849
On the daily chart, the USD/INR has Relative Strength Index (14-day) value of On the daily chart, EUR/INR has Relative Strength Index (14-day) value of 22.82.
36.59. One can buy at 72.90 for the target of 73.90 with the stop loss of 72.40. One can sell at 88.50 for a target of 87.50 with the stop loss of 89.00.
GBP/INR JPY/INR
GBP/INR (FEB) contract closed at 99.3775 on 04-Feb-21. The contract made its JPY/INR (FEB) contract closed at 69.5200 on 04-Feb-21. The contract made its
high of 100.6825 on 02-Feb-21 and a low of 99.2600 on 04-Feb-21 (Weekly Basis). high of 70.0900 on 01-Feb-21 and a low of 69.4725 on 04-Feb-21 (Weekly Basis).
The 21-day Exponential Moving Average of the GBP/INR is currently at 99.9550. The 21-day Exponential Moving Average of the JPY/INR is currently at 70.2945.
On the daily chart, GBP/INR has Relative Strength Index (14-day) value of 50.01. On the daily chart, JPY/INR has Relative Strength Index (14-day) value of 23.1894.
One can buy at 99.90 for a target of 100.90 with the stop loss of 98.90. One can sell at 69.50 for a target of 68.50 with the stop loss of 70.00.
14You can also read