City of Dawson Creek Housing Needs Report 2021 - Peace River ...
←
→
Page content transcription
If your browser does not render page correctly, please read the page content below

Housing
Needs Report
City of Dawson
Creek
2021
Prepared for the City of Dawson
Creek through a joint project
with the Peace River Regional
District.
March 31, 2021

 File: 0601.0089.01

 This report is prepared for the sole use of the Peace River Regional District. No representations of any kind are made by Urban Systems Ltd.
 or its employees to any party with whom Urban Systems Ltd. does not have a contract. © 2020 URBANSYSTEMS®.

•   supportive housing for vulnerable
Executive Summary                                                populations.
This Housing Needs Assessment provides a detailed
report of relevant housing related data for the City    Population and Age
of Dawson Creek (Dawson Creek). As of 2019,             Since 2006, the population of Dawson Creek
legislation requirements under the Local                increased from 10,994 to 12,178 in 2016 (an
Government Act require local governments to collect     increase of 11%). The median age of residents
data, analyze trends and present reports that           decreased from 35.6 to 34.4 by 2016, which is on par
describe current and anticipated housing needs in       with the median age of the total Peace River
B.C. communities. The purpose of this report is to      Regional District (PRRD) population (34.1). This
establish a baseline understanding of housing needs     indicating a younger population compared to all of
in Dawson Creek prior to the development of future      BC which had a median age of 43 years and Canada
policy considerations.                                  (41.2 years).

Recognizing that the 2016 Census data used              Shadow Population
throughout this report is already somewhat dated,       The shadow population that exists throughout the
particularly for a region with a largely cyclical       region has a significant impact on housing in both
economy, this information nonetheless remains the       rural areas and the municipalities within the PRRD.
most reliable data available for the purposes of this   With mining, hydro, oil and gas, forestry and
type of reporting, as it is collected only through      agricultural industries active in the region, there are
Statistics Canada’s Census. The legislative             significant numbers of work camps situated across
requirements stipulate the use of census data in        the PRRD to house employees that do not live
British Columbia Housing Needs Reports. This data is    permanently in the surrounding communities. Work
supplemented by more recent data from sources           camps reduce the impact of large numbers of
such as Canada Mortgage and Housing Corporation         individuals moving in and out of communities as
and BC Housing, as well as feedback collected from      work is available, and influencing vacancy and rental
residents and stakeholders in the community. Report     rates on a large scale.
updates are required every five years and can be
used to monitor trends.                                 Households
                                                        The number of households increased by 8% between
Community Engagement                                    2006 and 2016, but the average household size
Residents of Dawson Creek were invited to               remained steady at 2.3 persons per household. The
participate in an online survey and stakeholders        majority of Dawson Creek households are occupied
were invited to participate in focus groups and         by 1 or 2 persons (64%) and consist mainly of
individual interviews. The top four housing             families with and without children, or one-person
challenges identified through community and             non-census families. Sixty-one percent (61%) of
                                                        households own their property and 39% are renter
stakeholder engagement were:
                                                        households.
     •   housing affordability;
                                                        Income
     •   housing supply;
                                                        The median household income of owner households
     •   senior housing; and,                           increased from $76,888 to $97,811 between 2006

Housing Needs Report Dawson Creek
and 2016 and were almost double the median                                Key Areas of Local Need
household income of renter households ($53,398).                          Rental Housing
                                                                          Housing affordability in Dawson Creek’s rental
Current Housing Stock
                                                                          market was identified as a major challenge.
As of 2016, there were 6,020 dwelling units in
                                                                          Individuals living alone and single-parent families,
Dawson Creek, 64% of which were single-detached
                                                                          especially those on Income Assistance, face the most
dwellings (additional dwellings have been
constructed since the 2016 Census). The majority of                       significant challenges finding and maintaining
all dwelling types had three or more bedrooms. The                        affordable housing in the community. While rental
majority of rented dwellings were apartments with                         trends indicate that there are vacancies in the
less than five stories. In Dawson Creek, 62% of                           community, they are largely unaffordable for lower
housing units in Dawson Creek were built prior to                         income households. Furthermore, senior led
1980, and the majority only require regular                               households also experience affordability challenges.
maintenance (60%) or minor repairs (31%). In 2019,
the average sales price for a single-family dwelling                      Supportive Housing
(with three or more bedrooms) was $296,451. In the                        Stakeholders reported that supportive housing for
rental market, the number of available units has                          individuals with disabilities is lacking in the
decreased since 2016, while rent prices have stayed                       community and that individuals experiencing mental
relatively consistent.                                                    health issues often face barriers when searching for
                                                                          appropriate accommodations.
Housing Indicators
Of all Dawson Creek households in 2016, 9% lived in
                                                                          Homelessness
inadequate dwelling units, 6% lived in unsuitable
                                                                          Stakeholders identified a growing homeless
conditions, and 20% spent more than 30% or more
                                                                          population in the community over the past five
of their income on shelter costs indicating issues
with affordability. Of senior households, 6% of                           years. Service providers are struggling limited
households experiencing housing need had issues                           capacity and report a need for more emergency
with adequacy of their unit, 26% had affordability                        housing and shelters to address gaps in the
issues, and 1% had suitability issues. Additionally, a                    community.
much higher proportion of renters than owners
experienced core housing need1, having issues with
adequacy, suitability and or affordability (30% vs.
5.8%).

1
  CMHC defines Core Housing Need as a household whose                     acceptable (meets all three housing standards). Those in
housing does not meet the minimum requirements of at least one            Extreme Core Housing Need meet the definition of Core Housing
of the adequacy, affordability, or suitability indicators. In addition,   Need and spend 50% or more of their income on shelter costs.
it would have to spend 30% or more of its total before-tax income
to pay the median rent of alternative local housing that is

Housing Needs Report Dawson Creek
Contents Executive Summary ............................................................................................................... 1 1.0 Introduction................................................................................................................ 4 1.1 Overview ......................................................................................................................................................5 1.2 Housing Needs Report Requirements ..........................................................................................................6 1.3 Data Limitations ...........................................................................................................................................7 2.0 Community Engagement Findings ............................................................................... 8 2.1 Overview ......................................................................................................................................................8 2.2 Findings for Dawson Creek ..........................................................................................................................8 2.3 Housing Opportunities ...............................................................................................................................11 2.4 Regional Findings .......................................................................................................................................11 2.5 Opportunity Areas ......................................................................................................................................13 3.0 Dawson Creek Community Profile ............................................................................. 15 3.1 Population ..................................................................................................................................................15 3.2 Age .............................................................................................................................................................16 3.3 Mobility ......................................................................................................................................................17 3.4 Households.................................................................................................................................................17 3.5 Economy .....................................................................................................................................................20 3.6 Household Median Income ........................................................................................................................21 3.7 Summary ....................................................................................................................................................24 4.0 Housing Profile ......................................................................................................... 25 4.1 Overview of Housing Stock ........................................................................................................................25 4.2 Trends in the Homeownership Market ......................................................................................................30 4.3 Trends in Rental Market .............................................................................................................................31 4.4 Non-Market Housing ..................................................................................................................................34 4.5 Homelessness.............................................................................................................................................34 4.6 Student Housing .........................................................................................................................................35 4.7 Housing Indicators .....................................................................................................................................35 4.8 Core Housing Need ....................................................................................................................................37 Housing Needs Report Dawson Creek P a g e |i
4.9         Summary ....................................................................................................................................................38

5.0        Anticipated Population ............................................................................................. 39
   5.1         Population and Household Growth ............................................................................................................39

   5.2         Age Projections ..........................................................................................................................................40

   5.3         Household Projections ...............................................................................................................................42

   5.4         Summary ....................................................................................................................................................43

6.0        Shadow Population Implications ............................................................................... 44
   6.1         Community and Industry Benefits .............................................................................................................44

   6.2         Community and Industry Impacts ..............................................................................................................45

   6.3         Managing Housing Pressures .....................................................................................................................45

7.0        COVID-19 Implications .............................................................................................. 47
   7.1         Preliminary Economic Impacts ...................................................................................................................47

8.0        Summary of Key Areas of Local Need ........................................................................ 49
   8.1         Number of Units Needed by Unit Size .......................................................................................................49

   8.2         Statements of Key Areas of Local Need .....................................................................................................49

Glossary .............................................................................................................................. 51
Appendix A - Data Appendix ................................................................................................ 56
   BC Assessment ........................................................................................................................................................56

   Census .....................................................................................................................................................................62

   CMHC ......................................................................................................................................................................65

Appendix B – Engagement Summary.................................................................................... 67
1.0        Housing Needs Survey Summary ............................................................................... 67
   1.1         Introduction ...............................................................................................................................................67

   1.2         Demographic Questions .............................................................................................................................67

   1.3         Housing Experiences ..................................................................................................................................70

   1.4         Community Issues ......................................................................................................................................77

2.0        Interview and Focus Group Summary ........................................................................ 80
   2.1         Participants ................................................................................................................................................80

   2.2         Peace River Regional District ......................................................................................................................85

   2.3         Dawson Creek ............................................................................................................................................90

Housing Needs Report Dawson Creek                                                                                                                                 P a g e | ii
Appendix C – Population Projection Methodology ............................................................... 94
  Limitations...............................................................................................................................................................94

Housing Needs Report Dawson Creek                                                                                                                             P a g e | iii
1.0 Introduction
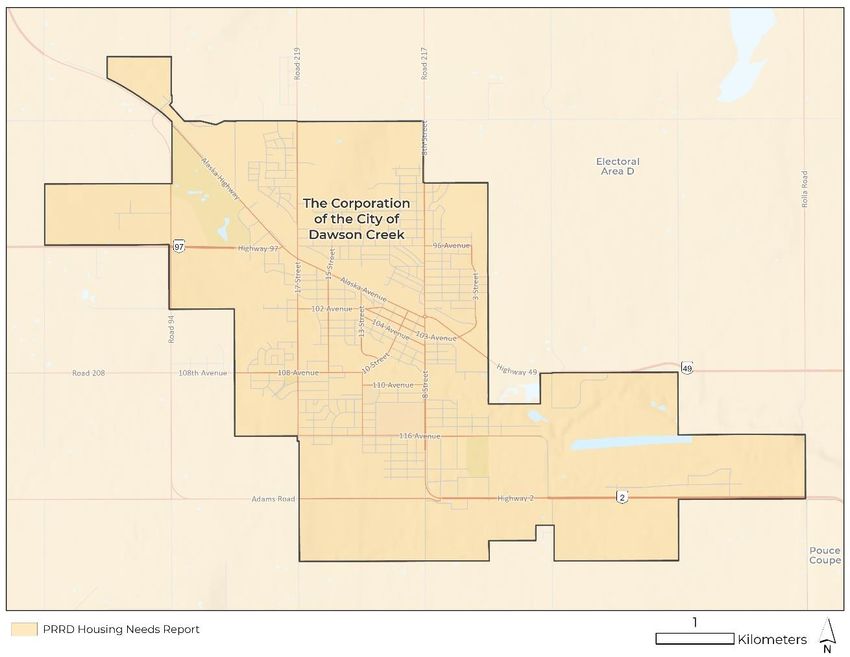
The City of Dawson Creek (Dawson Creek) is located near the eastern edge of the Peace River Regional District
(PRRD), close to the Alberta border. As of the 2016 Census, Dawson Creek had a population of 12,178. Dawson
Creek serves as the major urban centre for the surrounding Electoral Area D, Electoral E, District of Chetwynd, and
farming communities south of the Peace River.
While Dawson Creek residents have a strong sense of community and many families have lived in Dawson Creek
for several generations, concerns exist within the community regarding the mobile nature of the ‘shadow
population’ due to seasonal and project-oriented work in the PRRD. Industry in the area is influenced by the
cyclical nature of the natural resource economy, which can lead to uncertainty in long-term employment stability.
Dawson Creek residents face unique housing challenges based on their location, community context, and current
economic and growth drivers within the community and the PRRD. Across BC, a housing affordability crisis has
emerged due to high demand for housing from a growing population, low interest rates, and the attractiveness of
housing as an investment. Increasingly, the cost of renting and owning is creating unprecedented financial burdens
for households.
In 2019, the Government of BC introduced changes to the Local Government Act, requiring municipalities and
regional districts to complete Housing Needs Reports to help better understand current and future housing needs
and incorporate these into local plans and policies. Each local government must complete their first report by 2022
with updates required every five years thereafter. The Union of British Columbia Municipalities (UBCM) is
providing funding for local governments to support the completion of the first round of reports. The PRRD was
awarded funding through this program and retained Urban Matters to complete Housing Needs Reports for four
municipalities within its boundaries, including this report for Dawson Creek, as well as reports for Hudson’s Hope,
Pouce Coupe and Chetwynd. Separate reports have also been prepared for each electoral area within the PRRD. All
reports are developed based on the local context, while also providing a regional lens for housing in the PRRD.
The purpose of the PRRD Housing Needs Assessment Project is to:
▪ Develop an understanding of the current housing availability, suitability, and affordability across the
entire housing continuum;
▪ Make projections and recommendations on future population growth and significant expected
changes in housing demand;
▪ Provide a breakdown of housing units by type, size, condition, and state of repair; and
▪ Provide recommendations for relevant policy updates for participating local governments.
This Housing Needs Assessment includes relevant housing related data for Dawson Creek and establishes a
baseline understanding of housing need prior to the development of full housing needs reports across the PRRD
and its partner municipalities in this endeavour.
Recognizing that the 2016 Census data used throughout this report is already somewhat dated, particularly for a
region with a largely cyclical economy, this information remains as the most reliable data due to its basis in the
Housing Needs Report Dawson Creek P a g e |4Census. It is required through legislation that this data be used in British Columbia Housing Needs Assessments. The future needs projections and engagement sections are intended to ensure that a more current snapshot of needs is captured. Over time, as future Housing Needs Assessments are produced, it will be important to be able to track trends in both Census data and qualitative data collected through engagement. 1.1 Overview Dawson Creek is located approximately 75 kilometers southeast of Fort St. John and is surrounded by Electoral Area D. The municipality covers just over 24 km2 and had a population of 12,178 as of the last Census in 2016. Dawson Creek comprises almost 20% of the PRRD’s total population. Between 2006 and 2016, the median age declined from 35.6 to 34.4, indicating a trend of younger residents in Dawson Creek. Access to the backcountry, recreation centres, and parks offer a unique lifestyle to Dawson Creek residents. As of 2016, there were 6,020 dwellings in Dawson Creek, 65% of which were single-detached dwellings, which is comparable to the PRRD having 67% single-detached dwellings. The most common housing type for renters in Dawson Creek were apartments with less than five storeys (44%). Most dwellings require regular maintenance only (60% of all dwellings), while 31% require minor repairs and 9% require major repairs. Like other communities in the PRRD, Dawson Creek is experiencing increasing pressure on its housing market. As the population grows and ages, affordability and changing demographics are shifting the types of housing that can support local needs and development trends; what was once desirable may no longer meet the future needs of the population as well. Housing Needs Report Dawson Creek P a g e |5
Figure 1 – Study Area Overview Map of Dawson Creek

In the Dawson Creek Official Community Plan (OCP) Bylaw No. 4373, 2018, policies were included around providing
a variety of housing types throughout the community. These policies support the development of affordable rental
units, special needs and supportive housing, seniors’ housing, and implementing rent-control measures.

1.2 Housing Needs Report Requirements
Housing Needs Reports regulations require the collection of approximately 50 different data indicators about past
and current population, households, income and economy, and housing stock, as well as projected population,
households, and housing stock.2 Part 14, Division 22 of the Local Government Act details the requirements for
Housing Need Reports. Most of this data is made available by the Government of BC through their data catalogue.
While not all 50 data indicators are summarized in the body of the report, all required data that is currently
available for Dawson Creek can be found in the Data Appendix (Appendix A).

This report fulfills the Housing Need Report requirements for Dawson Creek, providing information on housing
needs across the housing continuum, including an estimate of the number and size of housing units required to
address existing demand and future growth over the next five years. This report is intended to be used by Dawson
Creek, the PRRD, and other stakeholders to inform the planning and development of housing in the community,

2
    https://www2.gov.bc.ca/assets/gov/housing-and-tenancy/tools-for-government/uploads/summaryhnrrequirements_apr17_2019.pdf

Housing Needs Report Dawson Creek                                                                                         P a g e |6
through local plans, policies, and the management of development. It is also a public report intended to inform the public and stakeholders to help improve local understanding of housing needs. This report provides an overview of housing needs based on analysis of this quantitative data from these sources, as well as qualitative data from engagement. This data is used to identify housing units required today and forecast needs for the next five years, determine the number of households in core housing need, and make statements about key areas of local need, in fulfilment of Housing Needs Reports regulations. 3 1.3 Data Limitations This report refers to both the standard Census Profile from Statistics Canada for Dawson Creek, as well as custom data that was prepared for the purpose of completing the Housing Needs Reports. The custom data refers to private households only and figures may be different than what is available through the public Census Profiles. Recognizing that the 2016 Census data used throughout this report is already somewhat dated, particularly for a region with a largely cyclical economy, this information nonetheless remains as the most reliable data available for the purposes of this type of reporting, as it is collected only through Statistics Canada’s Census. The legislative requirements require that it be used in British Columbia Housing Needs Assessments. In order to address this limitation, the future needs projections and engagement sections are intended to ensure that a more current snapshot of needs and issues is captured. Over time, as future Housing Needs Assessments are produced, this tool and approach will be important to be able to track trends in the Census data and qualitative data collected through engagement. This report is intended to provide a baseline against which to assess changes. The 2011 National Household Survey (NHS) was voluntary and as a result had a much lower response rate than the mandatory long-form Census. Because of this, data from the 2011 NHS is of a lower quality than Census data from other years. The statistical data included in this report was collected prior to COVID-19 and may not entirely reflect current housing trends. The data reported should be considered together with Section 7 – COVID-19 Implications of this report. The findings in the concluding sections consider both available data, desktop research on COVID-19 implications on the housing system, and what was heard from stakeholders during engagement about the on-the- ground implications in Dawson Creek. 3 https://www2.gov.bc.ca/gov/content/housing-tenancy/local-governments-and-housing/policy-and-planning-tools-for-housing/housing-needs- reports Housing Needs Report Dawson Creek P a g e |7
2.0 Community Engagement Findings
2.1 Overview
To better understand local housing needs, community and stakeholder engagement was completed between July
and September 2020. This process collected insight on local housing challenges and opportunities from the
perspective of Dawson Creek residents, local stakeholders, and neighbouring First Nations. Additional stakeholder
interviews were undertaken in December 2020 and January 2021 to ensure stakeholders across the region were
well represented in the study. This section provides an overview of the engagement process.

2.1.1 Community Survey
A community survey was available from July 15 to August 13, 2020. It was available through Dawson Creek’s
website as well as through paper copies by request. The purpose of the survey was to collect information about
the housing needs and challenges of residents.

A total of 173 respondents from Dawson Creek responded to the survey, including 25 individuals who identified as
First Nations or Metis. Seventy-two percent of respondents were owners (110 respondents), 26% were renters (39
respondents) and three percent did not rent, own, or have a fixed address. The survey received responses from
individuals ranging from the ages of 15 to 84 with a wide range of household incomes.

2.1.2 Stakeholder Interviews and Focus Groups
A wide range of stakeholders in Dawson Creek were invited to participate in an interview or focus group, including
service providers, housing providers, and other community organizations. The following stakeholders in Dawson
Creek participated: Network Ministries, South Peace Community Resource Society, Axis Family Resources, Dawson
Creek Salvation Army, Community Living BC Dawson Creek, Cut Thumb Glass (rental property manager), Nawican
Friendship Centre, and Dawson Creek Society for Community Living. Interviews were also completed with staff
from Saulteau First Nations, McLeod Lake Indian Band, Doig River First Nation, and Kelly Lake Cree Nation to
provide insight into Indigenous housing needs in the region.

The full results of the survey and focus groups and interviews can be found in Appendix B.

2.2 Findings for Dawson Creek
2.2.1 Housing Challenges
Stakeholders and survey participants were asked about housing challenges and opportunities specific to Dawson
Creek. Figure 2 the top housing challenges that survey participants identified for Dawson Creek. The high cost of
renting in Dawson Creek was the most common concern. Three of the top five issues for all respondents were
related to housing options and supports for seniors in the community, followed by housing options and supports
needed for individuals with disabilities and mental health issues. The following sections summarize the challenges
shown in Figure 2 and other challenges mentioned by survey participants and stakeholders.

Housing Needs Report Dawson Creek                                                                         P a g e |8
Figure 2 – Top Community Issues in Dawson Creek

                                              High cost of renting                                                   68%

                           Lack of supportive housing for seniors                                                 63%

                         Seniors without adequate at-home care                                               57%

                                      High cost of buying a home                                     42%

                           Lack of downsizing options for seniors                                   39%

           Lack of supportive housing for people with disabilities                            33%

  Lack of supportive housing for people with mental health issues                             31%

           Homes in the community need maintenance or repair                             27%
 Mismatch between who needs housing and what type of housing
                                                                                        23%
                        is available
                                        Low availability of rentals                     23%

                 Lack of housing near employment opportunities              4%

                                                            Other           3%

      Unstable rental tenure (i.e. rental housing is not long term)        1%

      Regulatory barriers (e.g., zoning bylaw, permitting process)         1%

                                                                      0%    10%   20%   30%    40%    50%   60%    70%   80%   90% 100%
                                                                                         Percentage of Respondents

2.2.2 Affordability
For survey participants, especially households with low- or moderate-income, cost was a major barrier when
searching for a home. Fifty-one percent (51%) of survey participants who were homeowners said the cost of
purchasing was too high while 41% of renters said rental costs were too high. However, 71% of survey participants
who were homeowners reported that they believe their housing costs are affordable to them, compared to only
15% of renters. This highlights the issue of affordability in the rental market in Dawson Creek and is reflected in the
graph above.

Survey participants were also asked to identify any housing challenges that they anticipate experiencing in the next
five years. Both homeowners (12%) and renters (23%) anticipate uncertainty about whether or not they will be
able to make mortgage or rent payments in the next five years.

Interviewees reported unaffordability especially for single parent families due to high rents and utility costs. There
are many rental properties available, however they cater to employed, high earning individuals and families.
Especially families with vulnerable children and single people in the 40-59 age categories are falling through the
cracks. Stakeholders reported that many people end up living in substandard housing because they can’t find
affordable housing. The Nawican Friendship Centre indicated that it is difficult for the Indigenous population to
find affordable accommodations off-reserve, especially for those on a fixed income. The Dawson Creek Native
Housing Association indicated a need for low income and low barrier housing for individuals dealing with

Housing Needs Report Dawson Creek                                                                                                P a g e |9
addictions, mental health, or unemployment challenges. Stakeholders identified a need for affordable housing
units where rent is geared to income. Additionally, high costs of hydro and gas bills put added pressure on low
income households when they can hardly pay rent let alone utility bills.
Developers noted that due to development cost charges and an increase in construction material costs, it has
become more difficult to build affordable housing units in the community.
2.2.3 Supportive Housing4
In line with regional concerns, the lack of supportive housing in Dawson Creek was identified as a major issue for
stakeholders and survey participants. Stakeholders indicated that there are long waitlists with hundreds of
applicants waiting to secure a supportive housing unit. Stakeholders and survey participants highlighted the need
for a range of supportive housing options in the community for seniors requiring supports, individuals with
intellectual or physical disabilities, and homeless individuals, individuals experiencing addictions or behavioural
challenges, and other vulnerable populations. Landlord discrimination is also a common experience for individuals
with mental health issues. Stakeholders also identified that there is a lack of communication between supportive
housing and service providers which results in overlapping services and competition for funding. Interviewees
suggested establishing a list of supportive resources in the community to help vulnerable populations find and
access the services they require.
Seniors
Housing for seniors emerged as a major area of concern. Stakeholders indicated that it can be very difficult for
seniors to find accessible housing options. Survey participants felt that supportive housing (53%), adequate at-
home care (57%), and downsizing options for seniors (39%) were missing in the community. Aging in place with
closer access to health care services and financial support is seen as a priority.
Homelessness
Over the past five years, stakeholders have reported an increase in the homeless population. Stakeholders
indicated that due to limited supportive housing options in Dawson Creek, many individuals are staying in shelters
over the long term because they have no where else to go. Stakeholders also indicated that issues with
homelessness are often hidden as people aren’t staying in tents, they are largely couch surfing. Fifty percent (50%)
of survey participants felt that emergency housing or homeless shelters were needed in the community.
Stakeholders who are service providers struggle to continue to support those in need and have limited capacity to
house individuals. Homeless individuals with substance use are turned away from shelters and experience higher
barriers. Homeless youth, ages 15 to 18, are another concern and allegedly live in forests near the community.
Women
Stakeholders noted that more shelters are needed for vulnerable women, including those leaving abusive
relationships or fleeing violence. Due to the lack of services in Dawson Creek, women are travelling to Fort St. John
to access housing and supports they require.
4
The City of Dawson Creek indicated that a 32 unit supportive housing project is being constructed.
Housing Needs Report Dawson Creek P a g e | 102.2.4 Housing Condition and Suitability
One of the top housing issues survey participants currently face (26%) and anticipate in the next five years (29%) is
that their homes are in poor condition and need repairs. Survey participants noted in an open-ended comment
that local challenges such as flooding or erosion have caused damage to homes in recent times.
Many survey participants had other issues with their homes. Notably, 36% of participants reported that their home
lacks adequate storage and 24% said their homes are too small for their needs.
2.2.5 Services and Infrastructure
Stakeholders noted that due to transit budget cuts, there has been a lack of near-by transit options for residents.
Marginalized populations and individuals on social assistance have been most affected by the impact of transit
cuts. Survey participants also suggested that utility infrastructure in Dawson Creek should be updated to make
living in the community more desirable and well-serviced.
2.3 Housing Opportunities
Stakeholders and survey participants were invited to identify opportunities to build new housing or support groups
in need. The following are their suggestions:
• Develop more housing in underutilized areas in Dawson Creek
• Increase clarity around building regulations and ensure stricter building codes
• Build smaller homes that are more affordable
• Increase storage spaces in homes
2.4 Regional Findings
2.4.1 Housing Affordability and Supply
Interviewees observed that there are more housing developments during industry booms which increases the
availability of housing. However, these industry booms were also observed to drive housing unaffordability as
prices rise due to the influx of workers. For some service providers, it has also been challenging to recruit staff,
partly due to housing. Finding affordable housing options is reported to be especially challenging for one-person or
single-income households.
2.4.2 Senior Housing
For seniors in the PRRD, interviewees report that there are long waitlists for seniors housing of up to two to three
years. Having fixed incomes makes it difficult for many seniors to find appropriate housing and some end up living
in sub-standard units. Stakeholders report a need for services to support seniors who choose to age in place in
their own homes, for example, support with meals, snow removal, etc. Improved accessibility would also help
many remain independent over a longer term. It was also reported that seniors with dementia who do not have
access to appropriate housing and supports may be prematurely placed in long-term care. In rural communities
with limited services, seniors may find it difficult to access health care services close to home and may move to
more urban areas to have access to these services or be closer to family.
Housing Needs Report Dawson Creek P a g e | 112.4.3 Supportive Housing Stakeholders identified a need for supportive housing for vulnerable populations such as seniors, Indigenous Elders, youth, individuals with disabilities, and individuals with mental health issues. Additionally, some service providers face challenges of recruiting staff. Youth Stakeholders point out that youth, under 19, who require medical care are put into long-term care. More youth housing near larger municipalities would ensure that they can attend nearby schools and receive education. Individuals with Disabilities Despite recent improvements in housing for individuals with disabilities (such as brain injuries, mobility issues, MS), there is still a need for more housing options for these individuals in new buildings. Individuals who receive disability support face many challenges in finding appropriate housing because of restricted budgets. Interviewees also report a need for additional accessible housing units for individuals with disabilities who are able to live independently. Stakeholders noted that the default accommodations (such as extended hospitals stays or long- term care) for individuals with disabilities is not suitable for their needs and prevents them from accessing services. Individuals stay for extended periods of times in hospitals when there isn’t proper housing available, which have resulted in over capacity in hospitals. Individuals with Mental Health Issues Interviewees pointed out that individuals suffering from mental health issues often face additional barriers when looking for housing. Service providers reported that there is a lack of low barrier housing available for people at different stages of their lives and individuals are often turned away from rentals and shelters due to their conditions, limiting them to access the supports they require. One stakeholder mentioned there is a particular need for increasing programming that serve men with mental health issues. Vulnerable Population Interviewees indicated there is a need for supportive housing for individuals leaving abusive relationships and or families fleeing negative or dangerous living situations. 2.4.4 Households with Income Assistance Housing affordability was a concern for stakeholders, with particular mention of individuals on income-assistance. Despite rental availability, many individuals on income-assistance are unable to afford market housing. The stigma of income-assistance has also resulted in some rental companies discriminating individuals from housing opportunities. 2.4.5 Indigenous Housing There is a shortage of housing for Indigenous households living both on and off reserve. Interviewees report that Indigenous households need better access to medical services, mental health supports, and safe homes when living off reserve. Housing Needs Report Dawson Creek P a g e | 12
One of the major issues influencing the availability of housing on reserve is the lack of funding for repairing existing
homes or building new ones. The application process to receive funding is time-consuming and difficult.
Additionally, interviewees report that the current minimum building code is unsuitable for meeting the needs of
climate conditions (e.g. high snow load). Many homes have not been built to withstand climate conditions and
need to be replaced. Materials for replacements are limited locally and must be sourced from communities that
are farther away.

Interviewees reported a need for better quality housing suited for the northern climate that serves diverse
household needs (e.g. families, singles, Elders). There is also need for more nearby community infrastructure and
services to support existing homes (e.g. schools, shops, medical support for Indigenous Elders).

2.5 Opportunity Areas
2.5.1 Collaborations and Partnerships
Stakeholders highlighted the importance of fostering collaborations in the District between communities and First
Nations, and pursuing partnerships with service providers, housing providers and BC Housing. Stakeholders
identified a need for collaborative conversations between emergency service providers, health care workers and
District Officials to better understand the housing needs of vulnerable populations.

2.5.2 Research and Policy
Those involved in housing development indicated a need for the PRRD and municipalities to review development
procedures to reduce any unnecessary restrictions on development and incentivize development through tax
incentives. Collecting data and conducting assessments were identified as important to addressing current and
future housing needs and issues. Stakeholders felt that increasing knowledge of housing needs will support the
District in preparing for future funding and investment opportunities.

2.5.3 Continued Support for Senior Housing and Affordable Housing Options
There are currently many initiatives aimed at providing more housing options for seniors and supportive living
across the PRRD. Stakeholders highlighted senior housing initiatives, including Heritage, the Mennonite’s Elder’s
Lodge, and Better at Home, that provide house keeping duties, food provisions, and medical care for seniors.
Stakeholders noted that providers (e.g. Northern Health) are interested in exploring similar opportunities to build
and operate senior housing in the PRRD, while investors are specifically interested in opportunities in Fort St. John.
Stakeholders suggested that a database of senior accommodation and support services available across the region
should be established to help residents access the services they need.

Stakeholders highlighted other housing initiatives that are aimed towards providing housing options to specific
groups including BC Hydro’s building for Hudson’s Hope’s staff and medical workers, BC Housing’s passive
apartment building with allocation for low-income households, and apartments for medical students at CMHC
rates.

2.5.4 Other Opportunities
Stakeholders identified a number of other opportunities for building new housing or providing supports for specific
groups:

Housing Needs Report Dawson Creek                                                                            P a g e | 13
•    Provide more off reserve housing across the region for First Nations
    •    Provide mental health housing that allow independence for tenants
    •    Provide private assisted living facilities to increase options and availability for seniors
    •    Provide housing options for individuals living in hospital care
    •    Increase funding for the Homeless Prevention Program
    •    Repurpose underutilized hotels for affordable housing units
    •    Utilize underutilized buildings and undeveloped properties to develop housing projects or accommodate
         support services

Housing Needs Report Dawson Creek                                                                      P a g e | 14
3.0 Dawson Creek Community Profile
The demographic and economic context of a community shape its housing needs. Age and stage of life, household
type and size, income, and employment all directly affect the type of housing units, sizes, and tenures needed. This
section provides an overview of these factors, using a combination of data from the Statistics Canada Census
Profiles and data tables and custom data prepared for Housing Needs Reports.
3.1 Population
Between 2006 and 2016 Dawson Creek grew by 10% percent from 10,994 to 12,178 residents (an increase of 1,184
residents) (Figure 3). Over the same time period, the PRRD grew by 4.8% (Figure 4). As of 2016, Dawson Creek
residents made up 20% of the PRRD’s total population.
Figure 3 – Population Changes in Dawson Creek and PRRD, 2006-2016
70,000 62,942
58,264 60,082
60,000
50,000
40,000
30,000
20,000
10,994 11,583 12,178
10,000
0
2006 2011 2016
Dawson Creek - Population PRRD - Population
Source: Statistics Canada Census Program, Census Profiles 2006, 2011, 2016
Housing Needs Report Dawson Creek P a g e | 15Figure 4 – Population Changes in Dawson Creek and PRRD, 2006-2016
7.0%
5.8%
6.0% 5.4% 5.1%
4.8%
5.0%
4.0%
3.1%
3.0% 2.2%
2.0%
1.0%
0.0%
2006 2011 2016
Dawson Creek - Change from Previous Census PRRD - Change from Previous Census
Source: Statistics Canada Census Program, Census Profiles 2006, 2011, 2016
3.2 Age
From 2006 to 2016, the median age in Dawson Creek declined from 35.6 to 34.4, indicating a trend of younger
residents moving into the area, or older residents leaving the community. Age group distribution over the past
three Census periods shows a relatively stable population overall. The age distribution in Dawson Creek is
comparable with that found within the PRRD. While generally the age cohorts showed little change between
Census periods, one age group that does appear to be increasing is young adults (aged 25 to 34) who went from
representing 13% of the population in 2006 to 18% of the population in 2016. The relative youthfulness of the
Dawson Creek population can largely be attributed to young workers moving to the region for employment
opportunities in the natural resource economy.
Figure 5 – Age Distribution in Dawson Creek, 2006-2016
100% 1% 2% 2% 1%
4% 5% 4% 3%
90% 7% 7% 6%
6%
9% 12% 85 and over
80% 11% 11%
75 to 84
70% 15% 13% 13%
15% 65 to 74
60% 13%
15% 13% 12% 55 to 64
50%
45 to 54
13% 15% 18% 17%
40%
35 to 44
30% 16% 13%
15% 14% 25 to 34
20% 15 to 24
10% 21% 19% 19% 21% 0 to 14
0%
2006 2011 2016 PRRD 2016
Source: Statistics Canada Census Program, Census Profiles 2006, 2011, 2016
Housing Needs Report Dawson Creek P a g e | 163.3 Mobility
In Dawson Creek, 7% of the population moved into the municipality between 2015 and 2016, compared to 6% in
the PRRD and 7% in BC (Figure 6). Of those who moved to Dawson Creek, 52% were intra-provincial migrants
(people who moved from elsewhere in BC), 34% were inter-provincial migrants (people who moved from another
province), and 14% are external migrants (people who moved from outside of Canada). Compared to the PRRD,
Dawson Creek has a lower proportion of individuals who moved intra-provincially and a higher proportion that has
moved interprovincially.
Figure 6 – Mobility Status in Dawson Creek, PRRD and BC, 2016
70%
60% 59%
60% 450
52%
50%
290
40%
34%
30%
30%
22%
19% 120
20%
14%
10%
10%
0%
Intraprovincial migrants (elsewhere in Interprovincial migrants (another External migrants (outside of Canada)
BC) province)
Dawson Creek PRRD BC
Source: Statistics Canada Census Program, Census Profiles 2016
3.4 Households
Between 2006 and 2016, the number of households in Dawson Creek grew by 8% from 4,650 to 5,035 which
corresponds with the population growth experienced over the same time period. In addition, the average
household size in Dawson Creek has remained the same at 2.3 for all three Census periods. This compares to the
average household size of 2.5 in 2016 for the PRRD. In 2016, 36% of households in Dawson Creek were 3 person or
more households (i.e. family households), as compared to 39% of PRRD households (Figure 7). Households in
Dawson Creek are predominantly one and two-person households (64% collectively).
Dawson Creek also has a lower proportion of family households with and without children than the PRRD, and
higher portion of one person non-census-family households (households consisting of one person) (Figure 8).
Multiple family census households make up 1% of the Dawson Creek households. These figures show that families
are somewhat less likely to live in the community than in the PRRD as a whole, and that households in Dawson
Creek are more likely to be non-family households (i.e. one person living alone or unrelated roommates).
Housing Needs Report Dawson Creek P a g e | 17Figure 7 – Household by Size Comparision in Dawson Creek and PRRD, 2016
40%
1,630 1,610 35%
35% 32% 32%
30%
25%
25%
20% 795
16% 16%
630 14%
15% 13%
370 9%
10% 7%
5%
0%
1 person 2 person 3 person 4 person 5 or more person
Dawson Creek PRRD
Source: Statistics Canada Census Program, Census Profiles 2016
Figure 8 – Households by Type in Dawson Creek and PRRD, 2016
45%
1,840 40%
40% 37% 1,630
35% 32%
30% 28%
1,195
25%
24%
25%
20%
15%
305
10%
6% 5%
65
5% 1% 1%
0%
Without children With children One-person Two-or-more person
One-census-family households Multiple-census-family Non-census-family households
households
Dawson Creek PRRD
Source: Statistics Canada Census Program, Census Profiles 2016
Housing Needs Report Dawson Creek P a g e | 18Figure 9 shows the ages of primary household maintainers by tenure, to illustrate the distribution of tenure across
age groups in 2016. Primary household maintainer refers to the person leading a household. The Census allows
two to be identified per household and the data is based on the first entry. In Dawson Creek, there was a smaller
proportion of households headed by the youngest and oldest age groups. Renter households are more likely to be
led by a younger age group (75% of renters were under the age of 54), while 25% of owner households were led by
individuals aged 55 or older.
Figure 9 – Age of Primary Household Maintainer by Tenure, 2016
35% 625
31%
30%
25% 640 620
21% 20%
510 510 320 315
20%
17% 17%16% 16%
245 355
15% 12% 215
11% 12%
150 230
10% 8% 8% 90
105 85
5%
5% 3% 3% 25
1%
0%
15 to 24 years 25 to 34 years 35 to 44 years 45 to 54 years 55 to 64 years 65 to 74 years 75 to 84 years 85 years and over
Owner Renter
Source: Statistics Canada Census Program, Census Profiles 2016
3.4.1 Tenure
Dawson Creek has seen the proportion of owner households decline over the past three Census periods, from 66%
in 2006 to 61% in 2016 (Figure 10), while the proportion of renter households in Dawson Creek has increased over
the same time period, from 34% to 39%. Between 2006 and 2016, and especially from 2011 onward, a large
number of residential units were constructed, the majority of which being rental units (apartments, duplexes with
suites, coach houses, etc.) which correspond with the trend of increased renter households. Many single detached
dwellings also were constructed with secondary suites. This trend is illustrated in the number of residential
building permits approved over this time period (Table 2). For comparison, between 2006 and 2016 across the
PRRD, owner households also declined (74% to 70%) and renter households increased (25% to 28%).
Housing Needs Report Dawson Creek P a g e | 19Figure 10 – Households by Tenure in Dawson Creek, 2006-2016
80%
3,060 3,110 74% 71% 70%
70% 66% 64% 3,055
61%
60%
50% 1,985
1,590 1,745 39%
40% 34% 36%
28% 28%
30% 25%
20%
10%
0%
Owner Renter Owner Renter
Dawson Creek PRRD
2006 2011 2016
Source: Statistics Canada Census Program, Census Profiles 2006, 2016, NHS Profile 2011
3.5 Economy
Between 2006 and 2016, Dawson Creek saw a slight decrease in labour participation from 72% to 71% and the
unemployment rate in Dawson Creek doubled from 6.1% to 12.1% over the same time period. These changes in
labour participation and unemployment rate took place during a period of time where there was a significant
downturn in the economy, which was most notably felt in the oil and gas industry in the region, and these
numbers reflect that. However, by 2018 an unemployment rate of 5.7% 5 was reported for North East BC, followed
by 6.36 in 2019 (October YTD). There also have been several large projects initiated in the PRRD in the last few
years that would have helped lower the unemployment rates including the construction of the Coastal GasLink
pipeline, Site C construction, Pembina pipeline expansion, and major growth in the Montney region. Many
employees working on these projects live in Dawson Creek, although some live in camps as their work moves along
the development of the pipelines. Comparatively, between 2006 and 2016, the PRRD participation rate also
decreased from 76% to 73% and the unemployment rate increased from 5.5% to 12.1%, which may be related to
the 2014-2015 downturn in the oil and gas industry.
In 2016, the top five industries employing Dawson Creek residents included retail trade (14%), health care and
social assistance (12%), accommodation and food services (10%), construction (10%), and mining, quarrying, oil
and gas extraction (8%).
5
https://www.workbc.ca/Labour-Market-Information/Regional-Profiles/Northeast#employment-statistics
6
https://www.alaskahighwaynews.ca/business/northeast-b-c-unemployment-holds-at-6-2-1.24001568
Housing Needs Report Dawson Creek P a g e | 20Figure 11 – Labour Participation Rate and Unemployment Rate in Dawson Creek and PRRD, 2006-2016
80% 76% 75%
72% 73% 71% 73%
70%
60%
50%
40%
30%
20%
12.1%12.1%
10% 6.1% 5.5% 6.7% 6.4%
0%
2006 2011 2016 2006 2011 2016
Participation rate Unemployment rate
Dawson Creek PRRD
Source: Statistics Canada Census Program, Custom Data Organization for BC Ministry of Municipal Affairs and Housing, 2006, 2011 and 2016
3.6 Household Median Income
Between 2006 and 2016, median before-tax household income grew by 27% in Dawson Creek, compared to 24%
across the PRRD, however Dawson Creek had a lower median household income than the PRRD. In 2016, the
median household income in Dawson Creek was $79,195. This is about $14,000 lower than, or about 84% of, the
PRRD median household income of $94,046 (Figure 12).
Median household income differs by household type. Non-census family households (individuals living alone,
though in some cases with roommates) had the lowest median household income in Dawson Creek followed by
female lone parent households. Couples with children had the highest median household income, which is typical
as they represent households generally at the peak of their earning potential and may have two-income streams
(Figure 13). Couples without children can represent older couples whose children have left and contain both
households nearing retirement (who may be high earners) and couples who are retired, who are living off
investments and pensions. Households with lower incomes are likely to be more vulnerable to housing issues, as
the options for what they can afford are naturally lower.
The median renter household income in a community is typically much lower than the median owner household
income, as is the case in Dawson Creek. In 2016, the median renter household income was $53,398, compared to
the median owner household income of $97,811. Median household incomes of owner households were 45%
greater than that of renters (Figure 14). Because median household incomes for renters is significantly lower than
owner households, there are also higher levels of core housing need among renter households (30% vs. 5.8%)
which creates a level of tenure insecurity. However, secure rental tenure represents an important component of
the housing continuum.
Housing Needs Report Dawson Creek P a g e | 21Of renter households, 70% earn less than $80,000, while 38% earn less than $40,000. Owner household income is
more evenly distributed across income groups (Figure 15). This indicates that renters may not necessarily choose
this tenure but rent because they are unable to afford ownership as an option.
Figure 12 – Median Before-Tax Household Income, 2006-2016
$100,000 $94,046
$90,000
$79,195
$80,000 $73,309
$70,000
$60,169
$60,000
$50,000
$40,000
$30,000
$20,000
$10,000
$0
2006 2016
Dawson Creek PRRD
Source: Statistics Canada Census Program, Custom Data Organization for BC Ministry of Municipal Affairs and Housing, 2006 & 2016
Figure 13 – Median Total Household Income in Dawson Creek and PRRD, 2016
$140,000 $131,584 $132,210
$124,818
$120,000 $113,856
$104,115
$98,670
$100,000 $88,448
$82,432
$80,000
$51,763
$54,682
$60,000 $52,160
$47,088
$40,000
$20,000
$0
Couple without Couple with Male Lone Parent Female Lone Parent Other-Census Family Non-Census-Family
Children Children
Dawson Creek PRRD
Source: Statistics Canada Census Program, Custom Data Organization for BC Ministry of Municipal Affairs and Housing, 2016
Housing Needs Report Dawson Creek P a g e | 22You can also read


