Co-existence of myopia and amblyopia in a guinea pig model with monocular form deprivation
←
→
Page content transcription
If your browser does not render page correctly, please read the page content below
Original Article
                                                                                                                                       Page 1 of 11

Co-existence of myopia and amblyopia in a guinea pig model with
monocular form deprivation
Lu Tian1,2, Ya-Tu Guo1,2, Ming Ying1,2, Yang-Chen Liu1,2, Xuan Li1,2, Yan Wang1,2
1
    Clinical College of Ophthalmology, Tianjin Medical University, Tianjin, China; 2Tianjin Eye Institute, Tianjin Key Lab of Ophthalmology and
Visual Science, Tianjin Eye Hospital, Tianjin, China
Contributions: (I) Conception and design: Y Wang, X Li; (II) Administrative support: None; (III) Provision of study materials or patients: None; (IV)
Collection and assembly of data: L Tian, YT Guo; (V) Data analysis and interpretation: L Tian, YT Guo; (VI) Manuscript writing: All authors; (VII)
Final approval of manuscript: All authors.
Correspondence to: Yan Wang, MD, PhD; Xuan Li, MD, PhD. Tianjin Eye Hospital, No. 4. Gansu Rd, He-ping District, Tianjin 300020, China.
Email: wangyan7143@vip.sina.com; xuanli08@yahoo.com.

                   Background: Form deprivation myopia is a type of ametropia, with identifiable causes in humans, that
                   has been induced in many animals. The age of onset of myopia induced by monocular form deprivation
                   coincides with the period of visual development in guinea pigs. However, visual acuity of form-deprived
                   eyes in guinea pigs is not understood yet. In this study, we investigated whether monocular form deprivation
                   would affect visual acuity in infant guinea pigs by evaluating the development of myopia and amblyopia after
                   monocular form deprivation, and whether form deprivation myopia and amblyopia occurred simultaneously
                   or successively.
                   Methods: Twenty pigmented guinea pigs (2 weeks old) were randomly assigned to two groups: monocularly
                   form-deprived (n=10), in which facemasks modified from latex balloons covered the right eye, and normal
                   controls (n=10). Refraction, axial length, and visual acuity were measured at 4 intervals (after 0, 1, 4, and
                   8 weeks of form deprivation), using cycloplegic streak retinoscopy, A-scan ultrasonography (with an
                   oscillation frequency of 10 MHz), and sweep visual evoked potentials (sweep VEPs), respectively. Sweep
                   VEPs were performed with correction of the induced myopic refractive error.
                   Results: Longer deprivation periods resulted in significant refractive errors in form-deprived eyes
                   compared with those in contralateral and normal control eyes; the axial lengths of form-deprived eyes
                   increased significantly after 4 and 8 weeks of form deprivation. These results revealed that myopia
                   was established at 4 weeks. The acuity of form-deprived eyes was unchanged compared to that at the
                   pretreatment time point, while that of contralateral eyes and eyes in normal control guinea pigs improved;
                   there were significant differences between the deprived eyes and the other two open eyes from 1 to 8 weeks
                   of form deprivation, showing that amblyopia was possibly established during 1 week of form deprivation.
                   Conclusions: This study demonstrated the feasibility of using sweep VEPs to estimate the visual acuity
                   of guinea pigs. Further, our results revealed that amblyopia likely occurred earlier than myopia; amblyopia
                   and myopia coexisted after a long duration of monocular form deprivation in guinea pigs. Understanding
                   this relationship may help provide insights into failures of treatment of amblyopia associated with myopic
                   anisometropia.

                   Keywords: Myopia; amblyopia; form deprivation; guinea pig

                   Submitted Jul 22, 2020. Accepted for publication Oct 30, 2020.
                   doi: 10.21037/atm-20-5433
                   View this article at: http://dx.doi.org/10.21037/atm-20-5433

© Annals of Translational Medicine. All rights reserved.                     Ann Transl Med 2021;9(2):110 | http://dx.doi.org/10.21037/atm-20-5433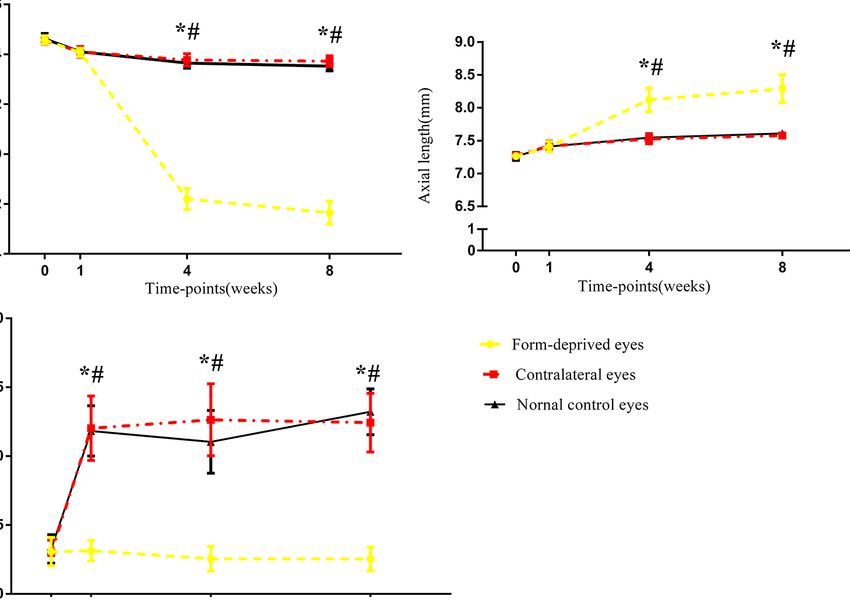
Page 2 of 11                                                Tian et al. Myopia and amblyopia after form deprivation in guinea pigs

Introduction                                                      amblyopia. However, the effects of brief, moderate, and long-
                                                                  term form deprivation periods on the visual acuity of guinea
Form deprivation myopia is a type of ametropia in humans,
                                                                  pigs have not been investigated, and little attention has been
with identifiable causes such as congenital cataract, ptosis,
                                                                  paid to whether myopia and amblyopia occur simultaneously
and corneal opacity. In order to investigate the mechanisms
                                                                  or successively. Therefore, in this study, we established a
of myopia in humans, form deprivation myopia has been
                                                                  monocular form deprivation model in guinea pigs with our
induced in many animals (1-5). Animal experimental studies
                                                                  own procedures, and then recorded refraction, axial length,
have established the importance of visual feedback in eye
                                                                  and the amplitude of sweep visual evoked potentials (sweep
and refractive state development, and have demonstrated
                                                                  VEPs) at different intervals in the deprived eyes, contralateral
that form deprivation myopia is a graded phenomenon;
                                                                  eyes, and normal control eyes. We found that sweep VEPs
increases in the degree of image degradation have been
                                                                  could be easily recorded in guinea pigs, as in rats (17) and
positively correlated with the severity of the induced
                                                                  mice (18). We also found that the amplitude of sweep VEPs
axial myopia, the uncoordinated ocular growth has been
                                                                  in the deprived eye decreased initially, while the axial length
found to be due to reduced retinal image contrast, and
                                                                  of the deprived eye increased with longer duration of form
the absence of visual feedback has been reported to be
                                                                  deprivation. We present the following article in accordance
related to the effective refractive state of the eye (6-8).
                                                                  with the ARRIVE reporting checklist (available at http://
Many experiments regarding normal visual development
                                                                  dx.doi.org/10.21037/atm-20-5433).
in these animals have shown that the age of onset of
form deprivation myopia in these animals coincided
with the period of visual development, and that larger            Methods
refractive errors were present in younger animals after a
                                                                  Experimental animals
longer duration of form deprivation (9-13). For example,
monocular form deprivation in monkeys at the age of               Twenty pigmented guinea pigs (male, 120–150 g, 2 weeks
2 weeks and led to the development of myopia of −13.5             old) were obtained from the Beijing Huafukang Laboratory
diopters (D) after 18 months; monocular form deprivation          Animal Ltd. (Beijing, China) and randomly assigned to
at the age of 1 year led to the development of only −4.5 D        two groups: the monocularly form-deprived group (n=10),
myopia after 26 months. Eye development in the guinea             and the normal control group (n=10). Groups of five guinea
pigs was basically completed by 3 weeks, and considerable         pigs were raised together in a plastic cage (15×26×32 cm)
myopia of approximately −3.4, −5.8, and −5.7 D was present        under a 12-h light-dark cycle with light provided by white
after 6, 11, and 16 days of form deprivation, respectively,       LEDs (spectrum: broad-band, illuminance: 500 lux, color
at the age of 5 days. Similarly, any abnormal visual              temperature: 4,500 K, frequency: 50–60 Hz), and room
experience (e.g., monocular form deprivation, strabismus,         temperature was maintained at 24 ℃, food (guinea pig
or anisometropia) imposed during the period of visual             feed and fresh vegetables) and water supplemented with
development could result in abnormalities of the visual           Vitamin C was available ad libitum. In the monocularly
system (e.g., amblyopia); however, as this was initiated at       form-deprived group, face-masks used for monocular form
progressively older ages, the resulting abnormality was           deprivation were modified by latex balloons, which covered
smaller or even without visual impairment at all (14). For        the right eye of guinea pig, leaving the left eye, nose,
example, in rhesus monkeys, monocular form deprivation            mouth and ears exposed (Figure 1), as shown in an earlier
initiated during early life produced a severe degree of           report (19). Light transmission through the latex balloon
amblyopia, and the effect on spatial vision decreased             was 20% (measured by TES 1330A Digital Lux Meter,
systematically as the age of onset was delayed (15,16).           Taiwan). All animals underwent sweep VEPs and biometric
Table 1 summarizes the onset time, duration, final induced        measurement (refraction and axial length) prior to the
diopter, and course of time from birth for emmetropization        experiment and at 1, 4, and 8 weeks after form deprivation
in each animal model of form deprivation myopia, as well as       induction. Sweep VEPs were done with correction of the
the relationship between the deprivation onset time and the       induced myopic refractive error. In the normal control
amblyopia severity in rhesus monkeys.                             group, the right eyes of all animals underwent sweep VEPs
   Monocular form deprivation during the period of visual         and biometric measurement (see details below) at each
development could not only result in myopia, but also             of intervals matching those of the form-deprived group.

© Annals of Translational Medicine. All rights reserved.        Ann Transl Med 2021;9(2):110 | http://dx.doi.org/10.21037/atm-20-5433
Annals of Translational Medicine, Vol 9, No 2 January 2021 Page 3 of 11
Table 1 Onset time, duration, final induced diopter and time-course from birth for emmetropization in each animal model of form deprivation
myopia, and the relationship between deprivation onset time and amblyopia severity in rhesus monkeys
Animal models Macaque monkey (1,9,15,16) Chick (2,10) Mouse (3,13) Tree threw (4,11) Guinea pig (5,12)
Onset time for myopia 2w 12 m 4w 9w 3–4 w 40–48 d 5d
Duration 18 m 26 m 3w 2w 3w 6d 11 d 16 d
Diopter (D) −13.5 −4.5 −12 −1.1 −4 −11.3 −3.4 −5.8 −5.7
Time-course for 18 m 8w 5–7 w 91–99 d 3w
emmetropization
Onset time for 5m 5–12 m 24 m
amblyopia
Amblyopia severity Severe Mild No deficit
d, days; w, weeks; m, months.
A B
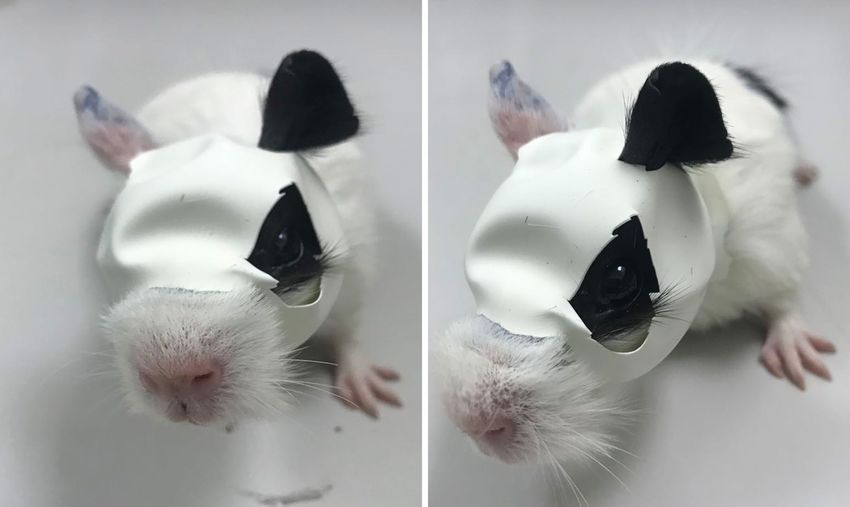
Figure 1 A pigmented guinea pig (2 weeks old) was well fitted with a face-mask that only covered the right eye, leaving the left eye, nose,
mouth and ears exposed.
Experiments were performed under a project license (no. snout in a fixed position (i.e., the snout was directed to
NKYY-DWLL-2020-099) granted by the Animal Ethical the left of the screen when the right eye was stimulated).
and Welfare Committees of Nankai Hospital, in compliance Rectal temperature was maintained at about 37.5 ℃ by a
with the Guide for the Care and Use of Laboratory Animals water circulating warming block. When the right eye was
of Nankai Hospital. stimulated, the face-mask was removed, and a corrective
lens was employed to compensate for the induced myopia of
the stimulated eye. The active needle electrode was placed
Sweep VEPs
in the left subcutaneous area of the binaural junction and
Visual stimulation pierced 1–1.5 cm forward. We put the reference electrode
Guinea pigs were anesthetized by inhaling 2% isoflurane, in the snout and the ground electrode in the hind paw,
and mounted in a stereotaxic apparatus that restrained the and the left eye (not stimulated) was occluded with a dark
© Annals of Translational Medicine. All rights reserved. Ann Transl Med 2021;9(2):110 | http://dx.doi.org/10.21037/atm-20-5433Page 4 of 11 Tian et al. Myopia and amblyopia after form deprivation in guinea pigs
5.0
2.5
Amplitude (μV)
0.0
−2.5
−5.0 1 s
11 s
0 12 24 36 48 60 72 84 96 108 120 132
Time (s)
0.05 cpd 0.065 cpd 0.084 cpd 0.11 cpd 0.18 cpd 0.23 cpd 0.30 cpd 0.39 cpd 0.50 cpd 0.65 cpd 0.80 cpd
Figure 2 A diagram regarding the course of time and the 11 stimuli trace. Each spatial frequency was presented for 11 s, and there was 1 s of
adaptation before data collection. The stimulus contrast was 80% and the temporal reversal rate (grating wave) was 3 Hz (about 6 reversals/s).
patch. Reti-Port System (Roland Consult, Germany) was previously described (18,20).
connected with electrodes to record sweep VEPs. The
sweep VEP stimulus, a horizontally oriented sine wave Refraction
grating, consisted of 11 spatial frequencies (0.05, 0.065, Refraction of the eye was measured using a streak
0.084, 0.11, 0.18, 0.23, 0.30, 0.39, 0.50, 0.65, and 0.80 retinoscope and trial lenses in a dark room. One drop of 1%
cycles per degree). The stimuli were presented using a tropicamide phenylephrine (Santen, Japan) was administered
21-inch CRT monitor. The stimulus contrast was 80% and to both eyes every 5 min, three times, to achieve complete
the temporal reversal rate (grating wave) was 3 Hz (about cycloplegia. The experimenter was blinded to the treatment
6 reversals/s). The mean luminance of the screen was administered. The mean value of the vertical and horizontal
100 cd/m2. The stimulus screen was viewed monocularly at meridians was taken as the refraction (21).
20 cm (100° wide × 82° high). Each spatial frequency was
presented for 11 s, and there was 1 s of adaptation before Axial length
data collection. The entire sweep took 132 s (12 s × 11 Axial length was measured by A-scan ultrasonography
spatial frequencies) (Figure 2). (MEDA2003s, Tianjin). The ultrasound frequency of the
probe emission was 10 MHz. The conducting velocity of the
Acuity extrapolation anterior chamber and the vitreous chamber was 1,540 m/s,
Figure 3 displays an example of acuity extrapolation. which has been previously used for measurements in guinea
The stimulus spatial frequency in cycle per degree (cpd) pigs (19). Topical anesthesia was achieved by oxybuprocaine
is plotted on the horizontal axis, and the sweep VEPs hydrochloride (Santen, Japan), prior to the measurement.
magnitude in microvolt (μv) is plotted on the vertical axis. The tip of the probe had a red light that guided the probe
The data were determined to be noise if the signal-to-noise to touch the center of the corneal surface perpendicularly
ratio (SNR, open/filled circles) was less than 2. As seen in during the measurement. A reliable measurement was
Figure 3A, the SNR did not exceed 2 for the 0.39, 0.50, confirmed when clear traces of various components of the
0.65, or 0.80 cpd data. Acuity was determined by fitting eye, with consistent waves, were detected. The axial length
a line between the high spatial frequency data that were was the distance from the cornea to the vitreous-retina
above noise (0.3 cpd) and the first spatial frequency that interface (Figure 4).
entered the noise (0.39 cpd) (solid arrows). The linear fit
was extrapolated to the X-axis (zero amplitude) for visual
Statistical analysis
acuity (dashed arrows). If there were no data points between
the peak spatial and the noise level, the highest spatial Statistical analysis was performed using SPSS software
frequency that was above noise was taken as visual acuity, as (Version 23.0; IBM SPSS, Inc., Chicago, IL, USA). Data
© Annals of Translational Medicine. All rights reserved. Ann Transl Med 2021;9(2):110 | http://dx.doi.org/10.21037/atm-20-5433Annals of Translational Medicine, Vol 9, No 2 January 2021 Page 5 of 11
A4 SIGNAL C R
NOISE
3 LINEAR REGRESSION
Amplitude (μV)
2
1
L1
0
Amplitude
L2
0.0 0.1 0.2 0.3 0.4 0.5 0.6 0.7 0.8 0.9
Spatial frequency (cpd)
B4
3
Amplitude (μV)
2
1
0 5 10
0 Depth (mm)
Figure 4 An example of ultrasound traces. Solid vertical lines from
0.0 0.2 0.4 0.6 0.8 1.0 1.2 left to right represent front of the cornea (C), front of the lens (L1),
Spatial frequency (cpd)
back of the lens (L2) and the vitreous-retina interface (R). The
Figure 3 An example of the acuity extrapolation technique with double-headed arrow between C and R represents axial length.
the sweep VEPs. The stimulus spatial frequency in cycle per
degree (cpd) is plotted on the horizontal axis, and the sweep VEPs
magnitude in microvolt (μv) is plotted on the vertical axis. The Results
data were determined to be noise if the signal-to-noise ratio (SNR, Comparison of refraction, axial length, and acuity between
open/filled circles) was less than 2. (A) Form-deprived eyes. The different eyes
SNR did not exceed 2 for the 0.39, 0.50, 0.65, or 0.80 cpd data.
Acuity was determined by fitting a line between the high spatial The results obtained from measuring refraction, axial
frequency data that were above noise (0.3 cpd) and the first spatial length, and visual acuity in the form-deprived eyes and the
frequency that entered the noise (0.39 cpd) (solid arrows). The contralateral eyes of the monocularly form-deprived group,
linear fit was extrapolated to the X-axis (zero amplitude) for visual and those in the right eyes of the normal control group
acuity (0.46 cpd, dashed arrow). (B) Normal control eyes. The are presented in Table 2. The overall analysis showed that
SNR did not exceed 2 for the 0.80 cpd. Acuity was determined results of the comparison between groups, the comparison
by fitting a line between the high spatial frequency data that were of times, and the interaction between groups and times
above noise (0.65 cpd) and the first spatial frequency that entered were significant. Upon increasing the deprivation period,
the noise (0.8 cpd) (solid arrows). The linear fit was extrapolated significant refractive errors were recorded in the form-
to the X-axis (zero amplitude) for visual acuity (0.96 cpd, dashed deprived eyes compared with those in the contralateral and
arrow). See text for details. normal control eyes (Figure 5A); the axial lengths of the form-
deprived eyes increased significantly compared with those in
contralateral and normal control eyes after 4 weeks of form
are presented as continuous variables and were evaluated deprivation, and 8 weeks of form deprivation (Figure 5B).
for normality using the Shapiro-Wilk test. The results are The changes observed in refraction and axial lengths
expressed as mean ± standard deviation (SD). All parameters indicate that the form deprivation myopia was established
among eyes and time-points were analyzed by two-way successfully during 4 weeks of form deprivation. Compared
repeated measurement ANOVA followed by Bonferroni with contralateral eyes and normal control eyes, the acuity
post hoc test. The differences were defined as significant at of form-deprived eyes was basically unchanged, while that
PPage 6 of 11 Tian et al. Myopia and amblyopia after form deprivation in guinea pigs
Table 2 Analysis of the interaction effects between time and treatment on refraction, axial length, and visual acuity
Refraction Axial length Visual acuity
Interaction effects
F P F P F P
Time 1,804.794 0.000 444.078 0.000 157.288 0.000
Time & group 967.353 0.000 100.469 0.000 45.731 0.000
Group 756.869 0.000 54.515 0.000 113.336 0.000
A 6 B
*# *# 9.0
4 *#
8.5 *#
Refraction (D)
Axial length (mm)
2 8.0
7.5
0
7.0
−2 6.5
1
−4 0
0 1 4 8 0 1 4 8
Time-points (weeks) Time-points (weeks)
C 2.0
Form-deprived eyes
*#
*# *# Contralateral eyes
1.5
Visual acuity (cpd)
Nornal control eyes
1.0
0.5
0.0
0 1 4 8
Time-points (weeks)
Figure 5 Refraction, axial length and acuity changes in form-deprived eyes, contralateral eyes and normal control eyes at different time
points. (A) Refraction at four time points; (B) axial length at four time points; (C) acuity at four time points. *, PAnnals of Translational Medicine, Vol 9, No 2 January 2021 Page 7 of 11
Table 3 Differences of refraction, axial length and visual acuity (mean ± SD) among all eyes in guinea pigs at each time-point
Time-points (weeks) 0 1 4 8 F p
Refraction (D)
FD 4.58±0.17 4.08±0.17a −1.80±0.42abAB −2.35±0.46abcAB 2,033.568 0.000
a ab ab
Contra 4.55±0.16 4.10±0.21 3.78±0.25 3.73±0.22 81.000 0.000
a ab ab
Normal 4.63±0.21 4.10±0.17 3.65±0.21 3.53±0.18 88.810 0.000
F 0.444 0.060 1,070.296 1,219.244
P 0.646 0.942 0.000 0.000
Axial length (mm)
FD 7.27±0.05 7.41±0.08a 8.12±0.18abAB 8.29±0.21abcAB 242.408 0.000
a ab abc
Contra 7.28±0.04 7.42±0.08 7.53±0.07 7.58±0.05 151.070 0.000
Normal 7.26±0.06 7.41±0.07a 7.55±0.06ab 7.61±0.05abc 112.617 0.000
F 0.229 0.035 82.612 96.644
P 0.797 0.966 0.000 0.000
Visual acuity (cpd)
FD 0.31±0.10 0.31±0.07AB 0.26±0.09AB 0.25±0.09AB 1.805 0.170
a a a
Contra 0.30±0.09 1.20±0.23 1.26±0.26 1.24±0.21 79.760 0.000
a a abc
Normal 0.33±0.10 1.18±0.18 1.10±0.23 1.32±0.17 115.251 0.000
F 0.222 82.888 69.013 132.736
P 0.802 0.000 0.000 0.000
“FD” refers to form-deprived eyes, “Contra” refers to contralateral eyes. a, indicates significant difference compare with 0-week time-point;
b
, indicates significant difference compare with 1-week time-point; c, indicates significant difference compare with 4-week time-point; A,
indicates significant difference between form deprived eyes and contralateral eyes after the same duration of form deprivation; B, indicates
significant difference between form deprived eyes and normal control eyes after the same duration of form deprivation.
weeks (P0.05 between any two time- used to study form deprivation myopia and amblyopia,
points from 0 to 8 weeks, post hoc test) and was 0.25±0.09 cpd the monkey—a non-human primate—might be an ideal
by 10 weeks of age (8 weeks of form deprivation); the acuity of animal model for both myopia and amblyopia, as the
the contralateral eyes increased rapidly during the first week retina of monkeys has a central cone-rich region and rod-
(PPage 8 of 11 Tian et al. Myopia and amblyopia after form deprivation in guinea pigs study showed that a calculated axial eye elongation of only of the optokinetic response selectively through the non- 5.4–6.5 μm was sufficient to make the schematic eye more deprived eye (30,31). However, induction of myopia myopic by 1 D (24). Therefore, it is difficult to accurately required a longer deprivation time of 2 weeks or more (3,32). detect the small changes in eye size and refraction after Therefore, we supposed that there might be an association myopia induction in mice (13). Guinea pigs are also between form deprivation myopia and amblyopia. However, mammals, and have become an increasingly popular the cause and effect relationship between anisometropic animal model for studying myopia (5,19,25). Many studies myopia and amblyopia is highly controversial; for example, reporting the normal development of refractive state, anisometropia is usually considered to be a leading cause of ocular dimensions, intraocular pressure and ciliary muscle amblyopia in humans, yet, there is a lack of studies that have (12,26,27), and the visual acuity, appear to be available (28). performed longitudinal tracking of at-risk infants (33,34). Although there are reports of the development of Studies using non-human primate models showed that significant myopia following monocular form deprivation anisometropia could precede amblyopia (35) or amblyopia in many animal models, and the development of form could precede anisometropia (36), but these results were deprivation amblyopia in monkey and mouse models, the obtained from lens-reared monkey. Our research, on the influence of form deprivation on the acuity of eyes, and other hand, is focused on form-deprived animals. Previous the development of form deprivation amblyopia as a result studies on form-deprived animals, such as monkeys (37,38), of monocular form deprivation in guinea pigs have not chickens (39-41), tree shrews (42), and guinea pigs (43) been investigated. The possible co-existence of amblyopia demonstrated recovery from form deprivation myopia, and myopia in form-deprived guinea pigs also remains even with very brief periods of unrestricted vision that unexplored. The present study was the first to use sweep were sufficient to block, or recover from, induced myopia. VEPs to test the visual acuity of guinea pigs, and to verify Similarly, the amblyopic effects of form deprivation in the co-existence of myopia and amblyopia after monocular infant monkeys were substantially reduced by daily periods form deprivation in guinea pigs. of unrestricted vision (44). A possible explanation for this As our results showed, refraction decreased, and axial recovery could be that the interruption of form deprivation length increased in form-deprived eyes, and both were failed to produce form deprivation amblyopia because the highly different from those observed in contralateral eyes form-deprived eyes had periodically received a relatively and normal control eyes after 4 weeks of form deprivation. clear image, followed by recovery from induced myopia. Further, acuity of form-deprived eyes remained the same In addition, as described in the introduction, myopia and as that at 2 weeks of age (0-week time-point), while that of amblyopia induced by form deprivation mostly developed contralateral eyes and normal control eyes improved with during the period of visual development. Further, age. In the form-deprived eyes, the development of acuity monocular form deprivation caused amblyopia that resulted was affected, while there was no effect on refraction and from ocular dominance imbalance in the visual cortex axial length after 1 week of form deprivation. The refraction and residual suppressive binocular interactions (45,46). and axial length changed after a longer duration of form A previous study in Macaca.arctoides monkey have indeed deprivation. These results showed that visual abnormality shown that myopia induced by form deprivation is affected possibly preceded ocular elongation or refraction decline; by optic nerve section (47). form deprivation amblyopia was developed during 1 week Based on the results and discussion above, we speculate of form deprivation, while form deprivation myopia was that early brief monocular form deprivation, setting up established between 1 and 4 weeks of form deprivation. competition between the eyes’ inputs to the cortex, leads Eventually, amblyopia and myopia coexisted after 4 to to a dramatic shift in the ocular dominance distribution of 8 weeks of monocular form deprivation. These results primary visual cortex units in favor of the non-deprived eye, were consistent with the observations of the study in which and residual suppressive binocular interactions, resulting diffuser-reared infants virtually exhibited amblyopia in the in amblyopia of the deprived eye (14). After the retina treated eyes (29). In C57BL/6 mice, during the critical receives the blurred visual stimulation input of long-term period, monocular form deprivation for even 4 days could duration of form deprivation, its morphological structure induce a maximal loss of responsiveness of cortical neurons and contents, including a variety of bioactive substances, are in the deprived eye (22). Even in adult mice, over 5 days changed, leading to sclera remodeling, ocular elongation, of monocular deprivation could lead to an enhancement and eventually, the development of myopia. © Annals of Translational Medicine. All rights reserved. Ann Transl Med 2021;9(2):110 | http://dx.doi.org/10.21037/atm-20-5433
Annals of Translational Medicine, Vol 9, No 2 January 2021                                                                  Page 9 of 11

   In this study, we did not measure the length of the               that form deprivation myopia and form deprivation
anterior segment, crystalline lenses, and vitreous chamber           amblyopia could coexist in guinea pigs after a long duration
of the eyes separately because, as shown in numerous                 of monocular form deprivation, which was induced
studies of visual deprivation in animal models, there was no         during an early period of visual development. The axial
significant change in the anterior segment and crystalline           growth, emmetropization rate, and key aspects of retinal
lenses; vitreous chamber depth was significantly correlated          development in guinea pigs are similar to those in humans,
with the total axial length of the eye. The reasons for              and there is a significant binocular interaction in the guinea
selecting sweep VEPs to evaluate the acuity in guinea                pig brain (48-50). The guinea pig has potential to become
pigs are as follows. Firstly, flash stimulation is not the best      an important mammalian model for studies of amblyopia.
stimulus for the visual cortex. Graphic stimulation provides         Amblyopia associated with myopic anisometropia is still
relatively stable results, and is ideal. Secondly, rodent eyes       difficult to treat successfully (51-54); thus, understanding
have a short axial length, relatively thick crystalline lens, and    the relationship of amblyopia and myopia could provide
lack fovea, but the cell density region in the retina is high.       useful insight into failures of treatment.
Consequently, the imaging of external objects in the retina
is very small, and they are unable to achieve an effective
                                                                     Acknowledgments
fixation. Therefore, the moving speed of stimulation must
be relatively high to bring about a change in the retinal            Funding: This work was supported by the National Natural
image. Fast moving graphic stimulation can stimulate the             Science Foundation of China (No. 81170828; 81670837);
maximum amplitude and the shortest latency of VEPs.                  the Tianjin Science & Technology Foundation (No.
Finally, the acuity obtained by sweep VEPs extrapolation             15JCZDJC35300); and the Tianjin Health and Family
is more intuitive, and easier to understand and deal with            Planning Communication Foundation (No. 14KG133).
statistically (17,18).
   There are some limitations to our study. First, electrode
                                                                     Footnote
placement might have affected the visual recording and so
implanted electrode or virtual-reality optokinetic system            Reporting Checklist: The authors have completed the
might provide stronger reliability for repeated measurement          ARRIVE reporting checklist. Available at http://dx.doi.
of visual acuity (31). Second, the refraction and the axial          org/10.21037/atm-20-5433
lengths were slightly different from those reported in
previous studies (12,19), probably due to the influence of           Data Sharing Statement: Available at http://dx.doi.
small eye artifacts and different A-scan ultrasonography.            org/10.21037/atm-20-5433
Third, the underlying mechanism of the visual pathway was
unclear, and a future study is needed to determine the role          Peer Review File: Available at http://dx.doi.org/10.21037/
of the retina and visual cortex. Fourth, we only used three          atm-20-5433
time points to investigate changes with form deprivation. It
is unclear whether the sweep VEPs changes of the deprived            Conflicts of Interest: All authors have completed the ICMJE
eyes occurred in a shorter deprivation time than 1 week,             uniform disclosure form (available at http://dx.doi.
and it is also difficult to know if the myopia development           org/10.21037/atm-20-5433). The authors have no conflicts
occurred at 1.5 or 2 weeks after form deprivation. A further         of interest to declare.
study is needed to determine the measurement changes at
shorter intervals.                                                   Ethical Statement: The authors are accountable for all
                                                                     aspects of the work in ensuring that questions related
                                                                     to the accuracy or integrity of any part of the work are
Conclusions
                                                                     appropriately investigated and resolved. Experiments
From our results alone, we cannot simply determine                   were performed under a project license (no. NKYY-
whether form deprivation myopia and form deprivation                 DWLL-2020-099) granted by the Animal Ethical and
amblyopia occurred simultaneously or successively in guinea          Welfare Committees of Nankai Hospital, in compliance
pigs, even though it seems likely that amblyopia occurred            with the Guide for the Care and Use of Laboratory Animals
earlier than myopia. However, our study provides evidence            of Nankai Hospital.

© Annals of Translational Medicine. All rights reserved.            Ann Transl Med 2021;9(2):110 | http://dx.doi.org/10.21037/atm-20-5433
Page 10 of 11 Tian et al. Myopia and amblyopia after form deprivation in guinea pigs
Open Access Statement: This is an Open Access article mechanisms of myopia in mice. Exp Eye Res
distributed in accordance with the Creative Commons 2013;114:96-105.
Attribution-NonCommercial-NoDerivs 4.0 International 14. Kiorpes L. Understanding the development of amblyopia
License (CC BY-NC-ND 4.0), which permits the non- using macaque monkey models. Proc Natl Acad Sci U S A
commercial replication and distribution of the article with 2019;116:26217-23.
the strict proviso that no changes or edits are made and the 15. Harwerth RS, Smith EL 3rd, Crawford ML, et al.
original work is properly cited (including links to both the Behavioral studies of the sensitive periods of development
formal publication through the relevant DOI and the license). of visual functions in monkeys. Behav Brain Res
See: https://creativecommons.org/licenses/by-nc-nd/4.0/. 1990;41:179-98.
16. Smith EL 3rd, Harwerth RS, Siderov J, et al. Prior
binocular dissociation reduces monocular form deprivation
References
amblyopia in monkeys. Invest Ophthalmol Vis Sci
1. Wiesel TN, Raviola E. Myopia and eye enlargement after 1992;33:1804-10.
neonatal lid fusion in monkeys. Nature 1977;266:66-8. 17. Guire ES, Lickey ME, Gordon B. Critical period for
2. Wallman J, Turkel J, Trachtman J. Extreme myopia the monocular deprivation effect in rats: assessment
produced by modest change in early visual experience. with sweep visually evoked potentials. J Neurophysiol
Science 1978;201:1249-51. 1999;81:121-8.
3. Schaeffel F, Burkhardt E, Howland HC, et al. 18. Ridder WH 3rd, Nusinowitz S. The visual evoked
Measurement of refractive state and deprivation myopia in potential in the mouse--origins and response
two strains of mice. Optom Vis Sci 2004;81:99-110. characteristics. Vision Res 2006;46:902-13.
4. Norton TT, Rada JA. Reduced extracellular matrix in 19. Lu F, Zhou X, Zhao H, et al. Axial myopia induced by a
mammalian sclera with induced myopia. Vision Res monocularly-deprived facemask in guinea pigs: A non-
1995;35:1271-81. invasive and effective model. Exp Eye Res 2006;82:628-36.
5. Howlett MH, McFadden SA. Form-deprivation 20. Ridder WH 3rd. Methods of visual acuity determination
myopia in the guinea pig (Cavia porcellus). Vision Res with the spatial frequency sweep visual evoked potential.
2006;46:267-83. Doc Ophthalmol 2004;109:239-47.
6. Troilo D, Smith EL, Nickla DL, et al. IMI – Report on 21. McFadden SA, Howlett MH, Mertz JR. Retinoic acid
Experimental Models of Emmetropization and Myopia. signals the direction of ocular elongation in the guinea pig
Invest Ophthalmol Vis Sci 2019;60:M31-M88. eye. Vision Res 2004;44:643-53.
7. Schaeffel F, Feldkaemper M. Animal models in myopia 22. Gordon JA, Stryker MP. Experience-dependent plasticity
research. Clin Exp Optom 2015;98:507-17. of binocular responses in the primary visual cortex of the
8. Chakraborty R, Read SA, Vincent SJ. Understanding mouse. J Neurosci 1996;16:3274-86.
Myopia: Pathogenesis and Mechanisms. In: Ang M, Wong 23. Lickey ME, Pham TA, Gordon B. Swept contrast visual
TY, editors. Updates on Myopia: A Clinical Perspective. evoked potentials and their plasticity following monocular
Singapore: Springer Singapore, 2020:65-94. deprivation in mice. Vision Res 2004;44:3381-7.
9. Bradley DV, Fernandes A, Lynn M, et al. Emmetropization 24. Schmucker C, Schaeffel F. A paraxial schematic eye
in the rhesus monkey (Macaca mulatta): birth to young model for the growing C57BL/6 mouse. Vision Res
adulthood. Invest Ophthalmol Vis Sci 1999;40:214-29. 2004;44:1857-67.
10. Wallman J, Adams JI, Trachtman JN. The eyes of young 25. Lu F, Zhou X, Jiang L, et al. Axial myopia induced by
chickens grow toward emmetropia. Invest Ophthalmol Vis hyperopic defocus in guinea pigs: A detailed assessment on
Sci 1981;20:557-61. susceptibility and recovery. Exp Eye Res 2009;89:101-8.
11. Norton TT, McBrien NA. Normal development of 26. Ostrin LA, Wildsoet CF. Optic nerve head and intraocular
refractive state and ocular component dimensions in the pressure in the guinea pig eye. Exp Eye Res 2016;146:7-16.
tree shrew (Tupaia belangeri). Vision Res 1992;32:833-42. 27. Pucker AD, Carpenter AR, McHugh KM, et al. Guinea pig
12. Zhou X, Qu J, Xie R, et al. Normal development of ciliary muscle development. Optom Vis Sci 2014;91:730-9.
refractive state and ocular dimensions in guinea pigs. 28. Garcia MB, Jha AK, Healy KE, et al. A Bioengineering
Vision Res 2006;46:2815-23. Approach to Myopia Control Tested in a Guinea Pig
13. Pardue MT, Stone RA, Iuvone PM. Investigating Model. Invest Ophthalmol Vis Sci 2017;58:1875-86.
© Annals of Translational Medicine. All rights reserved. Ann Transl Med 2021;9(2):110 | http://dx.doi.org/10.21037/atm-20-5433Annals of Translational Medicine, Vol 9, No 2 January 2021 Page 11 of 11
29. Smith EL 3rd, Hung LF. Form-deprivation myopia 1997;37:1557-64.
in monkeys is a graded phenomenon. Vision Res 41. Ritchey ER, Zelinka C, Tang J, et al. Vision-guided ocular
2000;40:371-81. growth in a mutant chicken model with diminished visual
30. Prusky GT, Alam NM, Douglas RM. Enhancement of acuity. Exp Eye Res 2012;102:59-69.
vision by monocular deprivation in adult mice. J Neurosci 42. Siegwart JT Jr, Norton TT. The susceptible period for
2006;26:11554-61. deprivation-induced myopia in tree shrew. Vision Res
31. Douglas RM, Alam NM, Silver BD, et al. Independent 1998;38:3505-15.
visual threshold measurements in the two eyes of freely 43. Zhou X, Lu F, Xie R, et al. Recovery from axial myopia
moving rats and mice using a virtual-reality optokinetic induced by a monocularly deprived facemask in adolescent
system. Vis Neurosci 2005;22:677-84. (7-week-old) guinea pigs. Vision Res 2007;47:1103-11.
32. Pardue MT, Faulkner AE, Fernandes A, et al. High 44. Wensveen JM, Harwerth RS, Hung LF, et al. Brief daily
susceptibility to experimental myopia in a mouse model periods of unrestricted vision can prevent form-deprivation
with a retinal on pathway defect. Invest Ophthalmol Vis amblyopia. Invest Ophthalmol Vis Sci 2006;47:2468-77.
Sci 2008;49:706-12. 45. Mitchell DE, Sengpiel F. Neural mechanisms of recovery
33. Barrett BT, Bradley A, Candy TR. The relationship following early visual deprivation. Philos Trans R Soc
between anisometropia and amblyopia. Prog Retin Eye Lond B Biol Sci 2009;364:383-98.
Res 2013;36:120-58. 46. Sakai E, Bi H, Maruko I, et al. Cortical effects of brief
34. Simons K. Amblyopia Characterization, Treatment, and daily periods of unrestricted vision during early monocular
Prophylaxis. Survey of Ophthalmology 2005;50:123-66. form deprivation. J Neurophysiol 2006;95:2856-65.
35. Smith EL 3rd, Harwerth RS, Crawford ML. Spatial 47. Raviola E, Wiesel TN. An animal model of myopia. N
contrast sensitivity deficits in monkeys produced by Engl J Med 1985;312:1609-15.
optically induced anisometropia. Invest Ophthalmol Vis 48. Howlett MH, McFadden SA. Emmetropization and
Sci 1985;26:330-42. schematic eye models in developing pigmented guinea
36. Kiorpes L, Wallman J. Does experimentally-induced pigs. Vision Res 2007;47:1178-90.
amblyopia cause hyperopia in monkeys? Vision Res 49. Loeliger M, Rees S. Immunocytochemical development of
1995;35:1289-97. the guinea pig retina. Exp Eye Res 2005;80:9-21.
37. Huang J, Hung LF, Smith EL 3rd. Recovery of peripheral 50. Ates K, Demirtas S, Goksoy C. Binocular interactions
refractive errors and ocular shape in rhesus monkeys in the guinea pig's visual-evoked potentials. Brain Res
(Macaca mulatta) with experimentally induced myopia. 2006;1125:26-30.
Vision Res 2012;73:30-9. 51. Curtin BJ, Schlossman A. Unilateral high myopia in
38. Qiao-Grider Y, Hung LF, Kee CS, et al. Recovery from childhood: clinical characteristics and treatment. Am
form-deprivation myopia in rhesus monkeys. Invest Orthopt J 1976;26:65-8.
Ophthalmol Vis Sci 2004;45:3361-72. 52. Kutschke PJ, Scott WE, Keech RV. Anisometropic
39. Napper GA, Brennan NA, Barrington M, et al. The amblyopia. Ophthalmology 1991;98:258-63.
duration of normal visual exposure necessary to 53. Pollard ZF, Manley D. Long-Term Results in the
prevent form deprivation myopia in chicks. Vision Res Treatment of Unilateral High Myopia with Amblyopia.
1995;35:1337-44. Am J Ophthalmol 1974;78:397-9.
40. Napper GA, Brennan NA, Barrington M, et al. The effect 54. Priestley BS, Hermann JS, Bloom M. Amblyopia
of an interrupted daily period of normal visual stimulation secondary to unilateral high myopia; results of pleoptic
on form deprivation myopia in chicks. Vision Res therapy. Am J Ophthalmol 1963;56:926-32.
Cite this article as: Tian L, Guo YT, Ying M, Liu YC, Li X,
Wang Y. Co-existence of myopia and amblyopia in a guinea
pig model with monocular form deprivation. Ann Transl Med
2021;9(2):110. doi: 10.21037/atm-20-5433
© Annals of Translational Medicine. All rights reserved. Ann Transl Med 2021;9(2):110 | http://dx.doi.org/10.21037/atm-20-5433You can also read